ROC -- Rate of Change
Contents
Overview
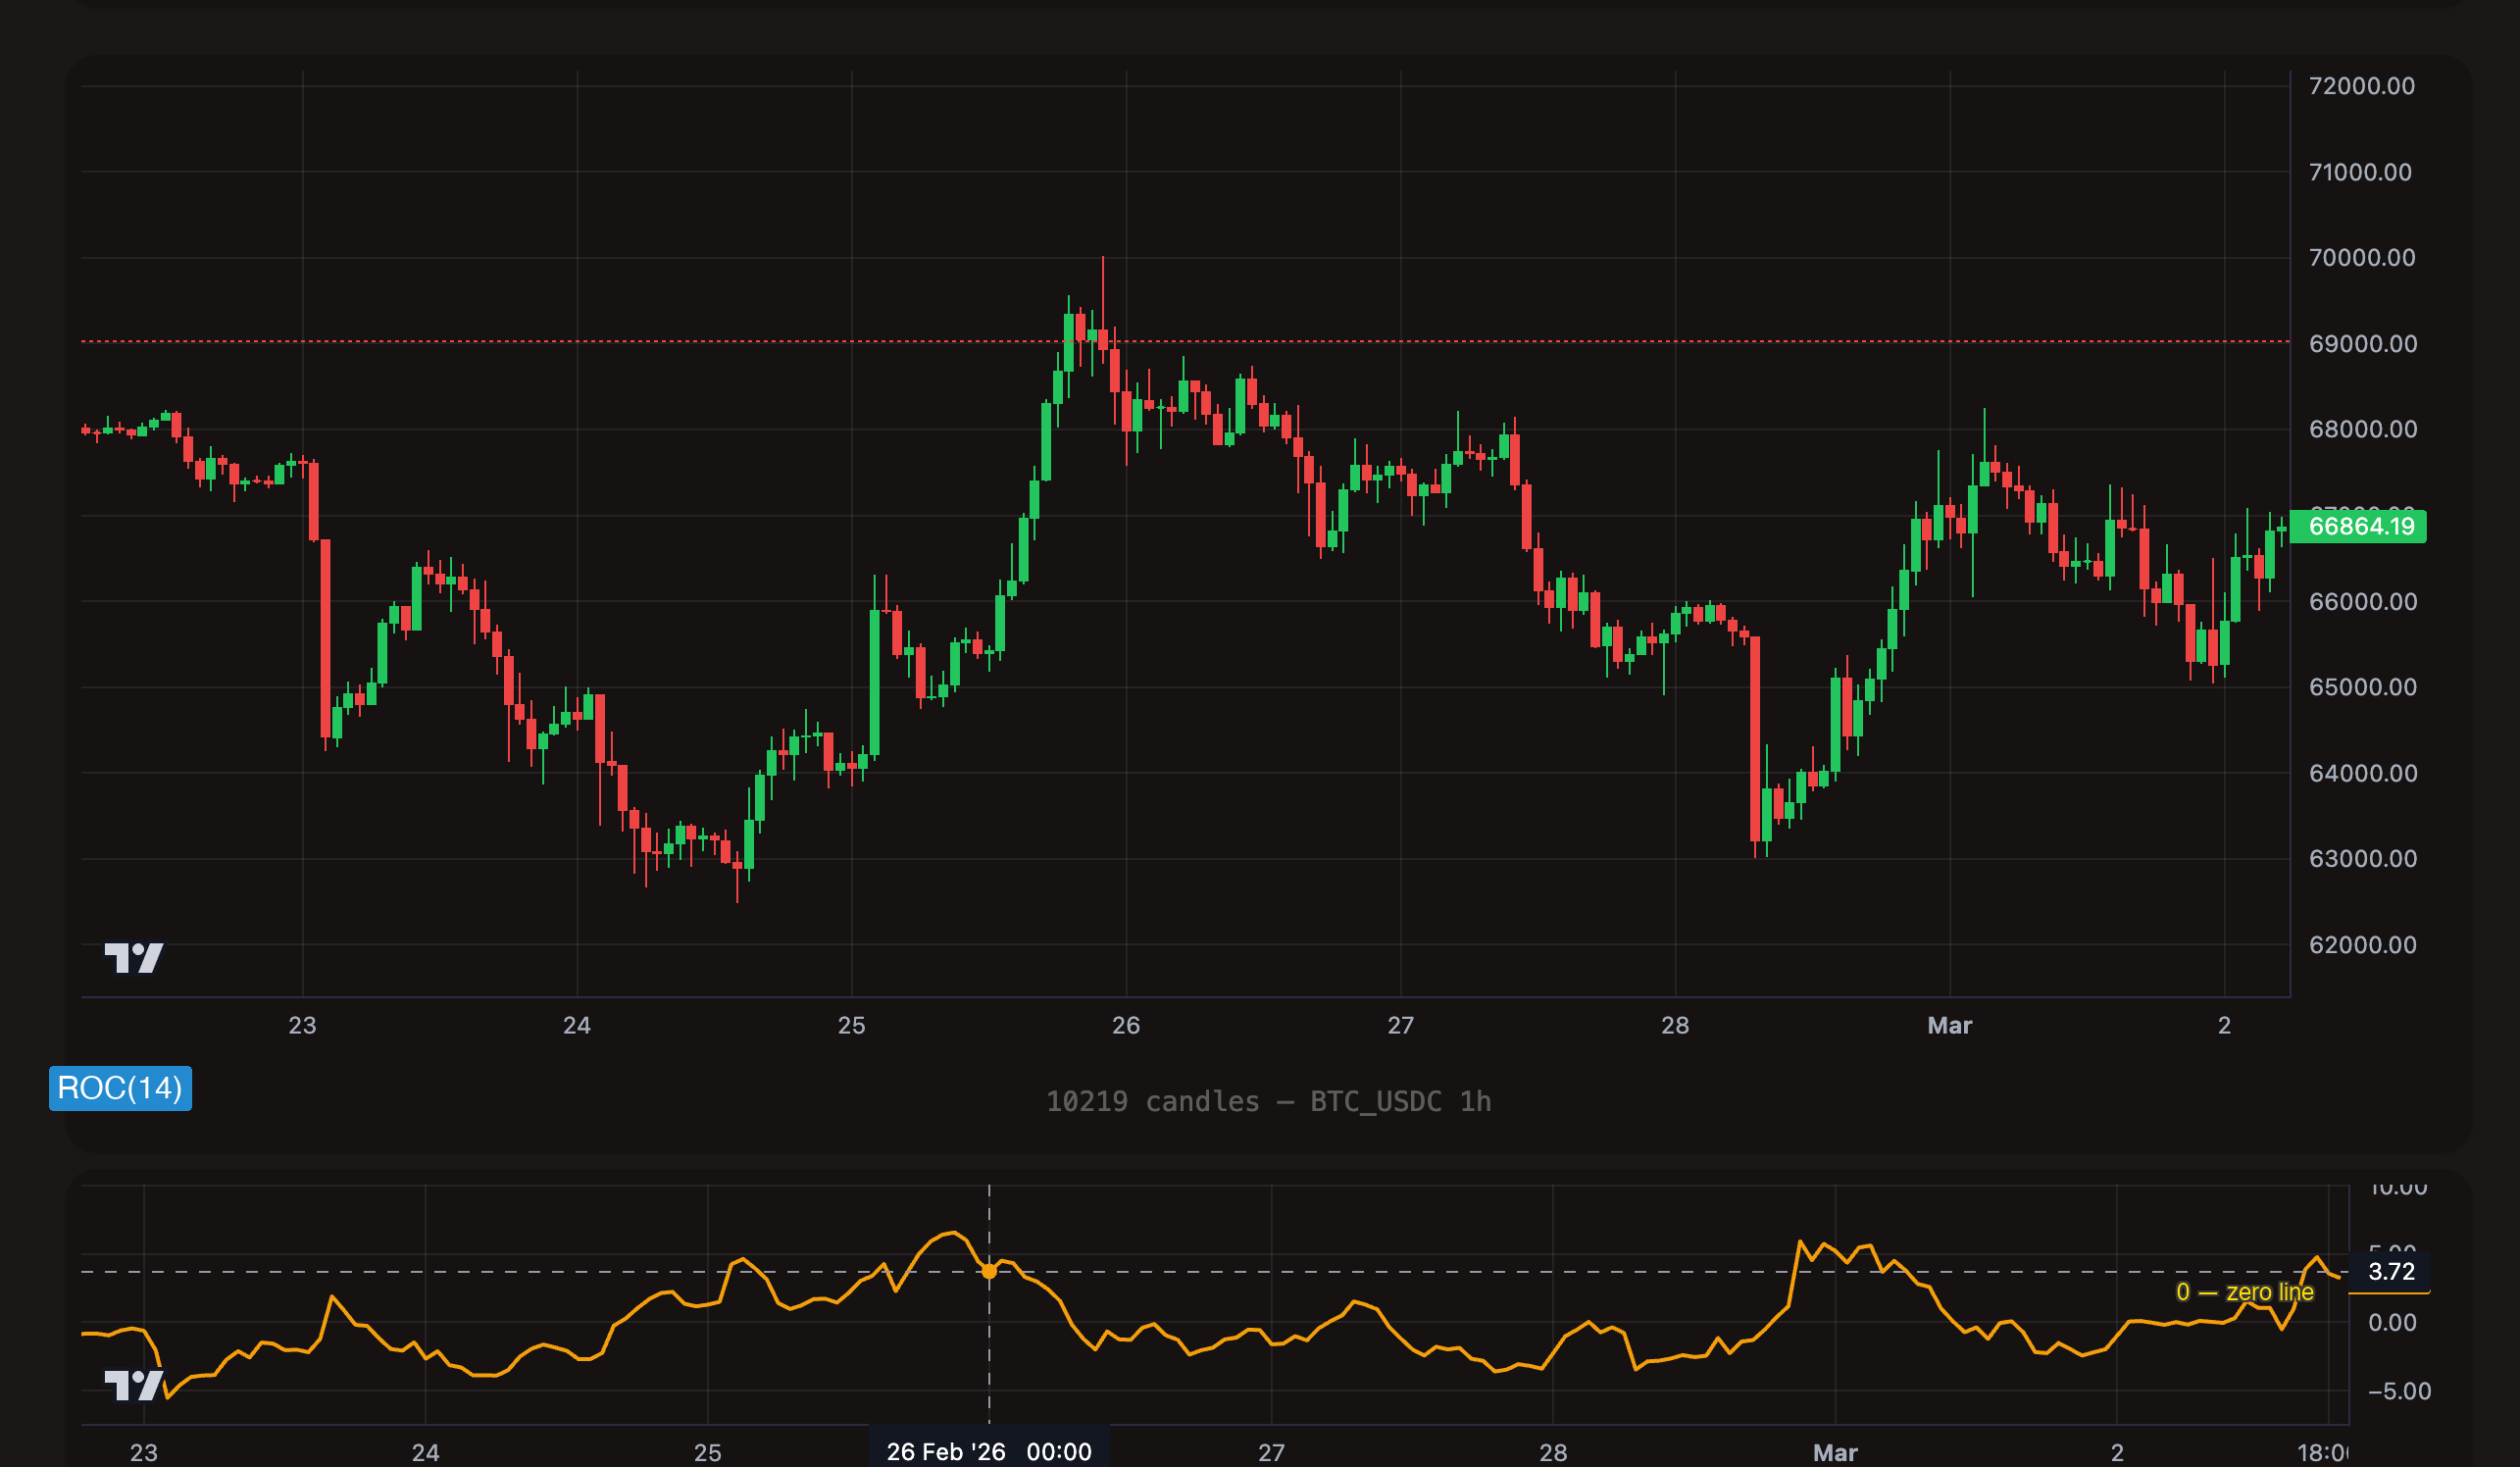
Rate of Change (ROC) measures the percentage change in price over the last N candles. It answers a simple question: how much has the price moved, in percentage terms, over a fixed lookback period?
The calculation is straightforward:
ROC = ((current_price - price_N_candles_ago) / price_N_candles_ago) * 100
- ROC of -5 means price has dropped 5% over the lookback period.
- ROC of 3 means price has risen 3% over the lookback period.
- ROC of 0 means price is unchanged.
Unlike bounded oscillators (RSI, StochRSI), ROC has no fixed range. It can be any positive or negative value. A flash crash could produce ROC of -20 or worse. This makes ROC uniquely suited for detecting the magnitude of price moves -- you set the threshold based on what you consider a significant move for the asset and timeframe you are trading.
Format
roc_{period}
The period defines how many candles back ROC compares the current price to.
| Example | Period | Use Case |
|---|---|---|
roc_5 | 5 | Very short lookback -- captures sudden spikes and drops within minutes |
roc_10 | 10 | Standard short-term -- good balance of sensitivity and reliability |
roc_14 | 14 | Medium lookback -- smooths out noise, shows broader momentum |
roc_20 | 20 | Longer lookback -- measures sustained moves, fewer false signals |
Period range: 1 to 200.
Value range: Unbounded (any positive or negative number, expressed as a percentage).
ROC Interpretation
| ROC Range | Interpretation |
|---|---|
| Below -5 | Sharp drop -- crash-level dip. Price has fallen more than 5% over the lookback period. Strong potential buy-the-dip signal. |
| -5 to -3 | Significant dip -- meaningful downward momentum. Worth monitoring or entering with confirmation. |
| -3 to 0 | Mild bearish -- price is drifting lower but not at an unusual rate. |
| 0 | Unchanged -- price is exactly where it was N candles ago. |
| 0 to 3 | Mild bullish -- price is drifting higher but not at an unusual rate. |
| 3 to 5 | Significant pump -- meaningful upward momentum. May signal strength or overextension. |
| Above 5 | Sharp rally -- price has risen more than 5% over the lookback period. Potential overbought or breakout confirmation. |
The thresholds above are general guidelines. What constitutes a "significant" move depends entirely on the asset and timeframe. A 3% ROC on a 15-minute chart for BTC is a major move. A 3% ROC on a daily chart for a small-cap altcoin may be routine. Calibrate your thresholds through backtesting on the specific pair and timeframe you trade.
Understanding Operators with ROC
Each operator behaves differently with ROC. Because ROC is unbounded, careful threshold selection is critical.
< (Less Than) -- State-Based
What it does: The trigger is true on every candle where ROC is below the threshold.
On the chart: Price has been dropping. ROC dips below your threshold (say, -5). For every candle that ROC remains below -5, this trigger fires. This captures the entire duration of the dip, not just the initial plunge.
[[actions.triggers]]
indicator = "roc_10"
operator = "<"
target = "-5"
timeframe = "15m"
During a sustained crash, ROC can stay deeply negative for many candles. Using < without max_count will fire on every single one, potentially opening many positions into a falling market. Always use max_count or combine with a recovery signal.
> (Greater Than) -- State-Based
What it does: The trigger is true on every candle where ROC is above the threshold.
On the chart: Price has been rising. ROC exceeds your threshold (say, 3). Every candle it stays above 3, this trigger fires.
[[actions.triggers]]
indicator = "roc_10"
operator = ">"
target = "3"
timeframe = "15m"
Typical use: Momentum confirmation for exits -- sell when upward momentum is strong. Or as a breakout filter -- only enter when price is moving decisively upward.
cross_below -- Event-Based
What it does: Fires once, at the exact candle where ROC transitions from above the threshold to below it. The previous candle had ROC >= the target, and the current candle has ROC < the target.
On the chart: ROC was hovering above zero and suddenly drops below zero. The moment it crosses the line, the trigger fires once.
[[actions.triggers]]
indicator = "roc_10"
operator = "cross_below"
target = "0"
timeframe = "1h"
Typical use: Detect the zero-line crossing. ROC crossing below 0 means price is now lower than it was N candles ago -- momentum has turned negative. This is a clean trend-change signal without the noise of staying in a zone.
cross_above -- Event-Based
What it does: Fires once, at the exact candle where ROC transitions from below the threshold to above it. The previous candle had ROC <= the target, and the current candle has ROC > the target.
On the chart: ROC was negative and climbs back above zero. The crossing moment is the trigger.
[[actions.triggers]]
indicator = "roc_10"
operator = "cross_above"
target = "0"
timeframe = "1h"
Typical use: Detect momentum recovery. ROC crossing above 0 means price is now higher than it was N candles ago -- momentum has turned positive. This signals the beginning of a potential upward move.
= (Equal) -- Not Recommended for ROC
Why: ROC produces floating-point values. Exact equality (e.g., roc_10 = 0) will almost never be true because ROC values are calculated to many decimal places. Use cross_above or cross_below with a target of 0 to detect zero-line crossings instead.
- Use
<for dip buying -- "price has dropped X%." Addmax_countto avoid stacking entries during prolonged drops. - Use
>for momentum confirmation or overbought exits. - Use
cross_above/cross_belowwith target0for clean trend-change signals at the zero line.
TOML Examples
Buy After a Sharp Dip
Enter when price has dropped 5% over the last 10 candles on the 15-minute chart. This targets sharp, rapid dips that often precede bounces.
[[actions]]
type = "open_long"
amount = "100 USDC"

  [[actions.triggers]]
  indicator = "roc_10"
  operator = "<"
  target = "-5"
  timeframe = "15m"
  max_count = 1
Sell When Momentum Weakens
Exit the position when upward momentum fades. ROC crossing below 0 means the recent rally has stalled and price is now below where it was 10 candles ago.
[[actions]]
type = "sell"
amount = "100%"

  [[actions.triggers]]
  indicator = "roc_10"
  operator = "cross_below"
  target = "0"
  timeframe = "1h"
Buy on Zero-Line Recovery
Wait for ROC to cross back above zero after a dip. This confirms that the price drop is over and momentum is turning positive, rather than trying to catch a still-falling knife.
[[actions]]
type = "open_long"
amount = "75 USDC"

  [[actions.triggers]]
  indicator = "roc_10"
  operator = "cross_above"
  target = "0"
  timeframe = "15m"
Sharp Dip with Consecutive Candle Confirmation
Combine ROC with a consecutive red candles trigger for higher-conviction dip entries. This fires only when price has dropped 3% and there have been 5 consecutive bearish candles -- confirming a real sell-off rather than a single volatile candle.
[[actions]]
type = "open_long"
amount = "100 USDC"

  [[actions.triggers]]
  indicator = "roc_10"
  operator = "<"
  target = "-3"
  timeframe = "15m"
  max_count = 1

  [[actions.triggers]]
  type = "consecutive_candles"
  direction = "bearish"
  count = 5
  timeframe = "15m"
Tips
A 5% drop in BTC over 10 candles on the 15-minute chart is a significant event. The same 5% drop for a small-cap altcoin might happen daily. Backtest your ROC thresholds on the specific trading pair to understand what constitutes a "significant" move for that asset and timeframe.
ROC works best on shorter periods (5--10) for dip-buying strategies because it captures rapid price changes. Longer periods (20+) smooth out the signal and are better suited for identifying broader trend shifts via zero-line crossovers.
ROC crossing above zero means the asset is now trading higher than it was N candles ago. ROC crossing below zero means the opposite. These zero-line crossovers are clean, event-based trend signals that pair well with other entry conditions. Use cross_above with target 0 for bullish confirmation, cross_below with target 0 for bearish confirmation.
During sudden market crashes, ROC can reach extreme negative values (-10, -15, or worse). While these can be excellent dip-buy opportunities, they can also be the beginning of a much larger move. Never rely solely on ROC magnitude for entries during high-volatility events. Combine with a trend filter or wait for a cross_above 0 recovery signal before entering.