Welcome to Botmarley
Botmarley is a self-hosted, sovereign cryptocurrency trading bot built in Rust. It runs entirely on your own hardware, giving you full control over your trading strategies, API keys, and market data. No cloud services, no third-party access to your funds, no monthly subscriptions.
You install it, you run it, you own it.
Botmarley supports Kraken and Binance exchanges. It automatically detects which exchange to use based on your account type and trading pair.
What Botmarley Does
At its core, Botmarley automates cryptocurrency trading based on rules you define. You write a strategy that says things like "buy BTC when RSI drops below 30" or "sell 50% of my position when price rises 5% from entry," and Botmarley executes those rules 24/7 without you needing to watch charts.
Here is how the pieces fit together:
graph LR
    Browser["Browser<br/>(Web Interface)"]
    Bot["Botmarley<br/>(Trading Bot)"]
    PG["PostgreSQL<br/>(Your Data)"]
    Exchange["Exchange API<br/>(Kraken / Binance)"]

    Browser <-->|"http://localhost:3000"| Bot
    Bot <-->|"State & Logs"| PG
    Bot <-->|"Market Data & Orders"| Exchange
- Browser -- You interact with Botmarley through a web interface at
http://localhost:3000. Pages update in real time as your bot trades. - Botmarley -- A blazing-fast trading engine built in Rust with Tokio and Axum. Handles strategy execution, order placement, data fetching, and serves a reactive web interface powered by HTMX.
- PostgreSQL -- Stores your accounts, trading sessions, backtest results, PnL history, activity logs, and configuration.
- Exchange API -- Botmarley connects to Kraken and Binance to fetch market data and place orders on your behalf.
Key Features
| Feature | Description |
|---|---|
| Dashboard | At-a-glance overview of active sessions, total PnL, and quick navigation to key areas. |
| Strategy Editor | Visual builder and raw TOML editor for defining trading rules. Real-time validation as you build. |
| Backtesting | Test strategies against historical data before risking real money. See PnL, trade count, win rate, and individual actions on a chart. |
| Live Trading | Execute strategies in real-time on Kraken and Binance. Start, pause, resume, and stop sessions. Live-updating charts with trade markers. |
| Accounts | Manage exchange API keys and paper (simulated) accounts. Each account is isolated. |
| Portfolio | Track total portfolio value over time in USD and BTC, with asset breakdowns per account. |
| Market Data | Download, browse, chart, and analyze historical candle data. Run indicators on stored data. |
| History Sync | Fetch historical 1-minute candles from your exchange. Derived timeframes (5m, 15m, 1h) are calculated locally. |
| Task Queue | Background job system for long-running operations like data sync and bulk backtests. |
| Activity Logs | Detailed log of every action the bot takes, filterable by category (strategy, trading, backtest, account, data, system). |
| Settings | Configure server host/port, storage paths, active trading pairs, Telegram notifications, password protection, and UI themes. |
Who This Manual Is For
This manual is for cryptocurrency traders -- both beginners exploring automated trading for the first time and experienced traders who want full control over their bot.
- If you are new to trading bots, start with the Getting Started section. It walks you through installation, your first run, and a tour of every page.
- If you want to jump straight into building strategies, head to Strategies.
- If you are deploying Botmarley on a server, see Deployment.
You do not need any programming knowledge to use Botmarley. Strategies are defined in TOML files (a simple configuration format), and everything else is done through the web interface.
How to Use This Manual
The sidebar on the left organizes content into sections:
- Getting Started -- Installation, first run walkthrough, and a tour of the interface.
- Features -- Deep dives into each major feature: Dashboard, Accounts, Strategies, Backtesting, Live Trading, and Market Data.
- System -- Settings, task queue, activity logs, authentication, and Telegram integration.
- Deployment -- Running Botmarley locally and in production environments.
- Reference -- Strategy TOML specification, indicator reference, and glossary.
Use the search bar at the top to find specific topics. Each page is self-contained, so you can read them in any order.
Installation
This page walks you through installing Botmarley on your machine. By the end, you will have the bot running and accessible in your browser.
What You Need Before Starting
Botmarley is distributed as a pre-built binary. The only external dependency is PostgreSQL for data storage.
| Prerequisite | Why | How to check |
|---|---|---|
| PostgreSQL 15+ | Stores all bot state, trades, and logs. | psql --version |
The easiest way to run PostgreSQL is with Docker:
| Optional | Why | How to check |
|---|---|---|
| Docker | Run PostgreSQL in a container (no manual install). | docker --version |
| Docker Compose | Orchestrates the PostgreSQL container. | docker compose version |
If you already have PostgreSQL 15+ running on your system, you can use that instead of Docker. See the Environment Variables page for how to configure a custom database connection.
Installing Docker
If you do not have Docker installed:
macOS:
brew install --cask docker
Ubuntu/Debian Linux:
sudo apt update
sudo apt install docker.io docker-compose-v2
Windows:
Download and install Docker Desktop for Windows.
Download Botmarley
Download the latest release for your platform:
| Archive | Platform |
|---|---|
botmarley-arm64.tar.gz | Linux ARM64 — AWS Graviton, Raspberry Pi |
botmarley-amd64.tar.gz | Linux x86_64 — Most servers, Intel/AMD desktops |
botmarley-macos-arm64.tar.gz | macOS Apple Silicon (M1/M2/M3/M4) |
botmarley-windows-amd64.tar.gz | Windows x64 |
Not sure which one you need?
- Linux: Run
uname -m.aarch64→ ARM64,x86_64→ AMD64 - macOS: Use the Apple Silicon build (all modern Macs since late 2020)
- Windows: Use the Windows x64 build
Extract the Archive
Linux / macOS:
# Replace with your downloaded archive name
tar -xzf botmarley-arm64.tar.gz
cd botmarley
Windows (PowerShell):
tar -xzf botmarley-windows-amd64.tar.gz
cd botmarley
This creates the following files:
| Path | Purpose |
|---|---|
server (or server.exe on Windows) | The Botmarley binary |
templates/ | Web interface templates |
static/ | CSS, JavaScript, and images |
Initialize Botmarley
Before running for the first time, initialize the data directory:
Linux / macOS:
./server init
Windows (PowerShell):
.\server.exe init
This creates ~/.botmarley/ (or %USERPROFILE%\.botmarley\ on Windows) with:
- Default
settings.tomlconfiguration - Built-in trading strategies
- Example strategies for learning
- Data directories for market history
You only need to run init once. If the data directory already exists, the command will skip files that are already present and only add missing ones.
Start PostgreSQL
Botmarley stores all its state in PostgreSQL. The quickest way to get started is with Docker:
docker run -d \
  --name botmarley-db \
  -e POSTGRES_USER=botmarley \
  -e POSTGRES_PASSWORD=botmarley_dev \
  -e POSTGRES_DB=botmarley \
  -p 5432:5432 \
  postgres:17
If you prefer Docker Compose, create a docker-compose.yml with a postgres service, or use the one from the Production Deployment guide.
Verify the database is running:
docker ps | grep botmarley-db
Run Botmarley
Linux / macOS:
./server
Windows (PowerShell):
.\server.exe
Botmarley initializes the database schema on first run and starts listening on port 3000.
Verify the Installation
Open your browser and navigate to:
http://localhost:3000
You will see the license setup page. Follow the instructions in First Run to configure your API key and start trading.
If you see a connection error, check that:
- PostgreSQL is running:
docker ps - The server started without errors in the terminal
- Port 3000 is not already in use by another application
Stopping Botmarley
To stop the server, press Ctrl+C in the terminal where it is running.
To stop PostgreSQL:
docker stop botmarley-db
Your PostgreSQL data persists inside the Docker volume. Running docker stop keeps your data. To wipe the database and start fresh, run docker rm botmarley-db and create a new container.
Next Steps
With Botmarley running, continue to First Run for a guided walkthrough of the initial setup — including license activation and exchange configuration.
First Run
You have Botmarley installed and running at http://localhost:3000. This page walks you through the essential first-time setup: configuring settings, adding an account, downloading market data, creating a strategy, and running your first backtest.
By the end, you will have tested a strategy against historical data without risking any real money.
graph LR
    A["1. Settings"] --> B["2. Add Account"]
    B --> C["3. Download Data"]
    C --> D["4. Create Strategy"]
    D --> E["5. Run Backtest"]
When you open http://localhost:3000 for the first time, you will see the main dashboard. This is your starting point for everything that follows.

License Setup
Botmarley requires an API key to unlock all features.
- Visit lipinski.work to request your API key
- Open Settings in the Botmarley web interface
- Enter your API key in the License section
- Click Save
Botmarley validates your key immediately. Once validated, all features become available.
Without a valid key, only the Settings page is accessible.
Step 1: Configure Settings
Navigate to Settings in the sidebar (or go to http://localhost:3000/settings).
The Settings page has several sections. For your first run, focus on these:
Trading Pairs
In the Trading card, set your Active Pairs. These are the cryptocurrency pairs you want to trade and download data for. Enter them comma-separated in the format BASE/QUOTE:
BTC/USDC, ETH/USDC
Start with one or two pairs. You can always add more later. BTC/USDC is a good starting point because it has the most historical data and liquidity.
Data Storage
The Storage Path tells Botmarley where to save Arrow files (historical candle data). The default path works for most setups. If you want to store data on a different drive, change it here.
History Start Date
Set History Start Date to control how far back Botmarley fetches historical data. A reasonable starting point is 6-12 months ago. The more history you have, the more thorough your backtests will be, but downloading takes longer.
Save
Click Save Settings at the bottom. A green success banner confirms your settings were saved.
You can skip the Telegram Bot and Authentication sections for now. They are useful for production deployments but not required for getting started.
Step 2: Add Your First Account
Navigate to Accounts in the sidebar.
Click the Add Account button. A modal dialog appears with these fields:
| Field | What to enter |
|---|---|
| Name | A friendly name, e.g., "Paper Trading" |
| Description | Optional, e.g., "For testing strategies" |
| Account Type | Select Paper (Simulated) |
A paper account simulates trades without connecting to any exchange. No API keys are needed. This is the safest way to learn how Botmarley works.
Click Create to save the account.
Do not use a live exchange account with real API keys until you are comfortable with how strategies behave. Always test with a paper account first.
When You Are Ready for Live Trading
When you eventually want to trade with real funds, create a new account with:
- Account Type: Kraken or Binance
- API Key and API Secret: Generated from your exchange account (see Managing Accounts for step-by-step instructions for each exchange)
Your API keys are stored locally in Botmarley's PostgreSQL database. Never share your API secret. When generating keys on your exchange, grant only the permissions you need (query funds, create orders) and avoid granting withdrawal permissions.
Step 3: Download Market Data
Navigate to History in the sidebar.
Before you can backtest, Botmarley needs historical candle data. The History Sync page lets you download it from Kraken or Binance.
- Select an exchange (Kraken or Binance) in the dropdown.
- Your active pairs (configured in Settings) appear as checkboxes. Make sure the pairs you want are checked.
- Click Start Sync.
Botmarley downloads 1-minute candles from the selected exchange and stores them in Apache Arrow format. This runs as a background task -- you can watch progress on the same page, which auto-refreshes every 2 seconds.
The initial download can take several minutes depending on how far back your history start date is. Subsequent syncs are incremental -- they only fetch new candles since the last sync.
Once the sync completes, navigate to Data in the sidebar to verify. You should see entries in the table showing your pairs, the number of records, date range, and file size.
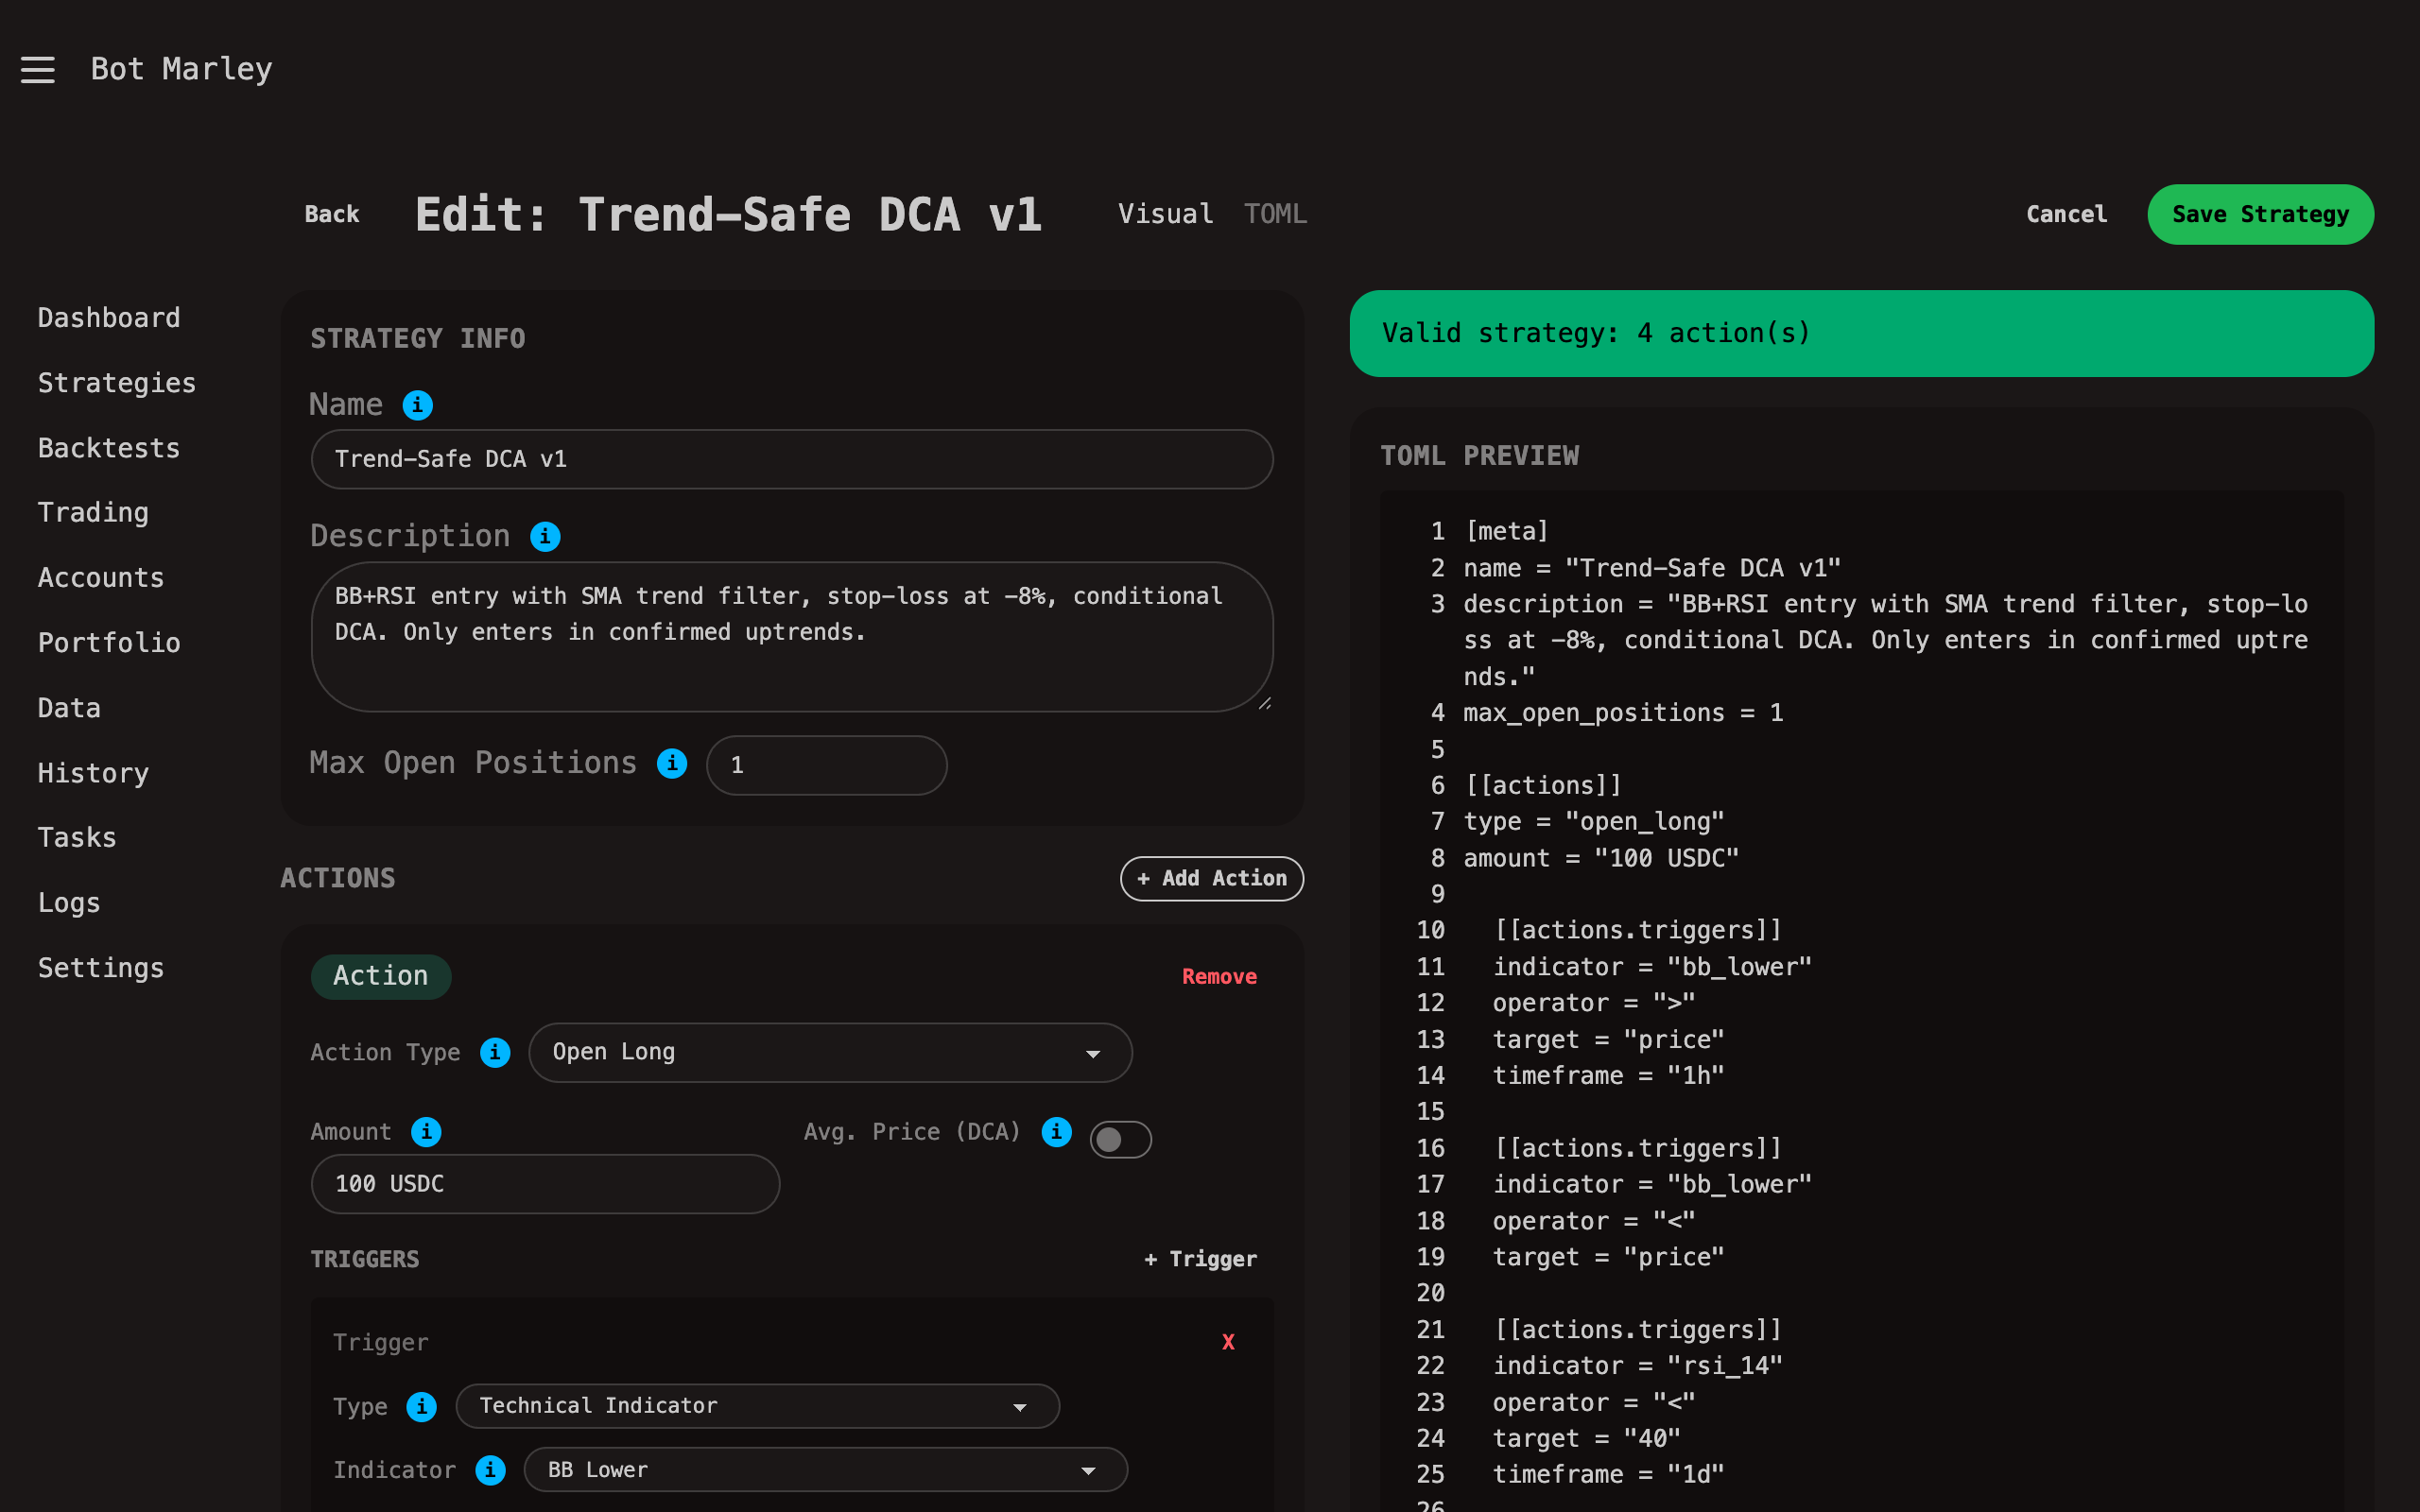
Step 4: Create Your First Strategy
Navigate to Strategies in the sidebar and click + New Strategy.
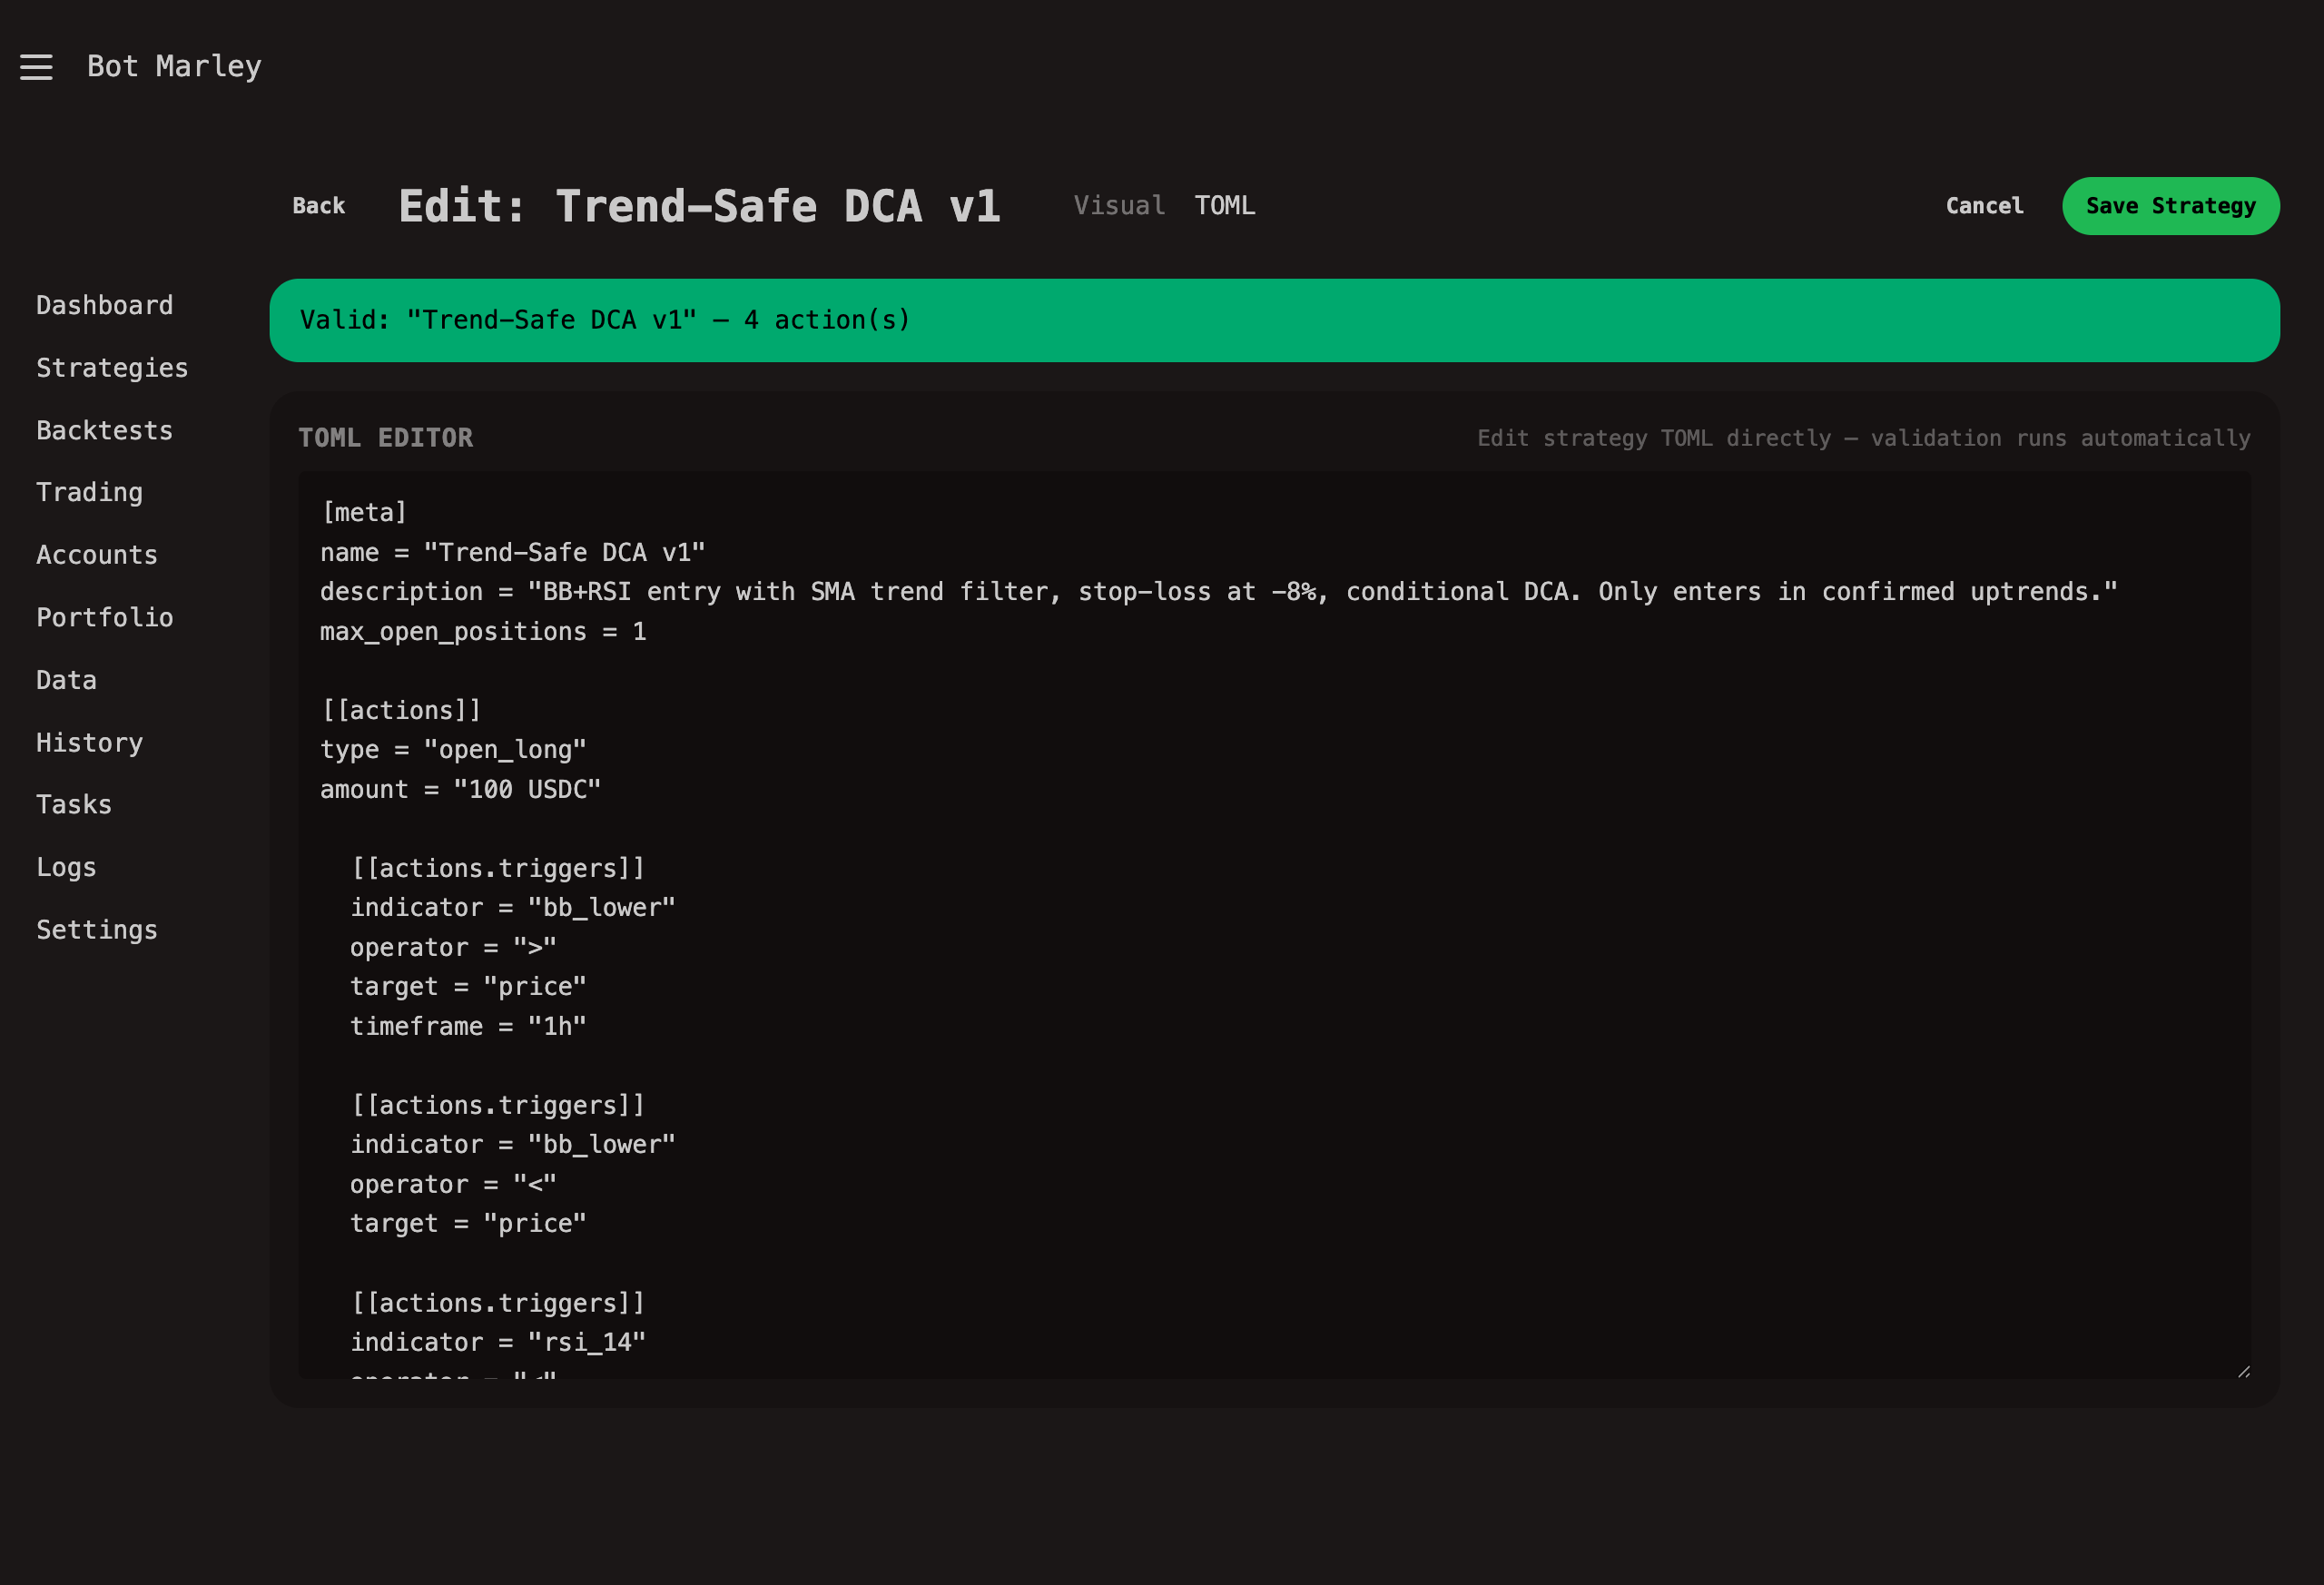
The Strategy Editor opens with two modes:
- Visual (default) -- A form-based builder with dropdowns and input fields.
- TOML -- A raw text editor for the strategy configuration file.
For your first strategy, use the Visual mode. Here is a simple RSI-based strategy to start with:
Strategy Info
- Name:
RSI Bounce - Description:
Buy when RSI is oversold, sell when overbought - Max Open Positions:
1
Action 1: Open Long
Click + Add Action, then configure:
- Action Type: Open Long
- Amount:
100 USDC
Now add a trigger: Click + Trigger within this action.
- Type: Technical Indicator
- Indicator: RSI 14
- Operator: Less Than (<)
- Target:
30 - Timeframe: 1h
This means: "Open a long position worth 100 USDC when the 1-hour RSI(14) drops below 30."
Action 2: Sell
Click + Add Action again:
- Action Type: Sell
- Amount:
100%
Add a trigger:
- Type: Technical Indicator
- Indicator: RSI 14
- Operator: Greater Than (>)
- Target:
70 - Timeframe: 1h
This means: "Sell the entire position when the 1-hour RSI(14) rises above 70."
Validate and Save
As you build, the right panel shows a live TOML Preview of your strategy and a validation status. It should show a green "Valid strategy: 2 action(s)" banner.
The generated TOML looks like this:
[meta]
name = "RSI Bounce"
description = "Buy when RSI is oversold, sell when overbought"
max_open_positions = 1

[[actions]]
type = "open_long"
amount = "100 USDC"

  [[actions.triggers]]
  indicator = "rsi_14"
  operator = "<"
  target = "30"
  timeframe = "1h"

[[actions]]
type = "sell"
amount = "100%"

  [[actions.triggers]]
  indicator = "rsi_14"
  operator = ">"
  target = "70"
  timeframe = "1h"
Click Save Strategy to store it.
Step 5: Run Your First Backtest
Go back to the Strategies list. You should see "RSI Bounce" in the table. Click the Backtest button on its row.
A modal dialog appears asking for:
| Field | What to enter |
|---|---|
| Pair | Select a pair you downloaded data for (e.g., BTC/USDC) |
| Initial Capital | 10000 (USD) |
| Start Date | The start of your downloaded data range |
| End Date | The end of your downloaded data range |
Click Run Backtest. Botmarley runs the strategy against the historical data and redirects you to the Backtests page.
Find your backtest in the list and click View to see the results:
- PnL -- Total profit or loss in dollars and as a percentage.
- Trade count -- How many buy/sell actions were executed.
- Win rate -- Percentage of profitable trades.
- Chart -- A candlestick chart with trade markers showing where each action occurred.
- Actions table -- A detailed log of every trade with timestamps, prices, and amounts.
Your first strategy probably will not be profitable -- and that is perfectly fine. Backtesting is about learning and iterating. Go back to the Strategy Editor, adjust the RSI thresholds or add additional triggers, and run another backtest. Repeat until you find settings that produce results you are comfortable with.
What to Do Next
You now understand the core workflow: settings, accounts, data, strategies, backtesting. From here:
- Quick Tour -- Walk through every page in the interface.
- Strategies -- Learn about all the trigger types, indicators, and strategy patterns.
- Backtesting -- Understand backtest results in depth and run bulk backtests.
- Live Trading -- When you are ready, start a live session with a paper, Kraken, or Binance account.
Quick Tour
This quick tour walks you through every major section of Botmarley so you know where everything lives.
Navigation
The sidebar on the left provides access to all sections:
| Section | What It Does |
|---|---|
| Dashboard | Portfolio overview and active session status |
| Accounts | Manage exchange connections |
| Portfolio | Track total portfolio value over time |
| Strategies | Create and edit trading strategies |
| Backtesting | Test strategies against historical data |
| Trading | Run live trading sessions |
| Data | Download and browse market data |
| Tasks | View background job queue |
| Logs | Activity and event history |
| Settings | Application configuration |
Dashboard
The dashboard (/) shows a summary of your portfolio value and any active trading sessions. It's your home base for monitoring at a glance.
Accounts
Navigate to Accounts to connect your Kraken or Binance exchange account or create a Paper (simulated) account for testing. Each account stores API credentials securely and can be verified with a balance check.
Strategies
The Strategies section lets you create, edit, and manage trading strategies defined in TOML format. Each strategy consists of:
- Actions — buy/sell operations, each with their own trigger conditions
- Indicators — technical analysis tools (SMA, EMA, RSI, Bollinger Bands, MACD, OBV, OBV-SMA, TTM Trend, StochRSI, ROC, ATR, Vol SMA, Price)
- Position management — DCA settings, max open positions, allocation percentages
Backtesting
Before going live, test your strategies against historical data in the Backtesting section. You'll see:
- Profit/Loss (absolute and percentage)
- Win rate and trade count
- Maximum drawdown
- An interactive chart showing entries and exits
Live Trading
When you're confident in a strategy, start a Trading Session. Select an account, a strategy, and a trading pair, then hit Start. You can:
- Pause — temporarily halt execution
- Resume — continue from where you paused
- Stop — end the session permanently
Real-time updates stream via SSE (Server-Sent Events), so the page updates automatically.
Market Data
The Data section lets you download historical candle data from Kraken or Binance. Data is stored in Apache Arrow format for fast access. You can browse downloaded datasets and run indicator calculations.
Settings
Configure application-wide settings including:
- Server host and port
- Telegram bot notifications
- Password protection
- Data storage paths
What's Next?
Now that you know the layout, dive into the specific sections that interest you most. We recommend starting with Accounts to set up your first connection, then exploring Strategies to build your first trading strategy.
Dashboard
The Dashboard is your home page — the first thing you see when you open Botmarley at http://localhost:3000.
What You'll See
The dashboard provides a high-level overview of your trading operation:

Portfolio Summary
If you have accounts connected and portfolio sync running, you'll see:
- Total Portfolio Value (USD) — combined value across all accounts
- Total Portfolio Value (BTC) — your holdings measured in Bitcoin
- BTC Price — current Bitcoin price in USD
- Last Sync — when portfolio data was last refreshed
Active Trading Sessions
Any currently running or paused trading sessions appear here with:
- Session name and trading pair
- Current status (Running, Paused)
- Profit/Loss so far
- Number of actions executed
Click on any active session to jump directly to its detail page with real-time charts and controls.
Empty State
If this is your first time using Botmarley, the dashboard will show helpful links to get started:
- Add an Account — connect to Kraken or create a Paper account
- Create a Strategy — build your first trading strategy
- Download Data — fetch historical market data for backtesting
Auto-Refresh
The dashboard uses HTMX polling to stay up-to-date. Active session stats refresh automatically without needing to reload the page.
Navigation
From the dashboard, you can quickly navigate to any section using the sidebar. The most common workflows from here:
graph LR
    D[Dashboard] --> A[Accounts]
    D --> S[Strategies]
    D --> T[Trading]
    D --> B[Backtesting]
    A --> T
    S --> B
    B --> T
This flow represents the typical journey: set up accounts, create strategies, backtest them, then go live.
Accounts
Accounts are the bridge between Botmarley and the outside world. Every action the bot takes -- whether it is placing a live trade on an exchange or simulating one locally -- happens through an account. Before you can backtest a strategy, run a live session, or track a portfolio, you need at least one account configured.
What Is an Account?
An account in Botmarley represents a single source of funds. It stores:
- Name and description -- a human-readable label you choose (e.g. "My Kraken Spot" or "Paper Testing").
- Account type -- determines whether the account connects to a real exchange or runs in simulation.
- API credentials -- only required for real exchange accounts.
- Verification status -- tells you whether Botmarley has successfully tested the credentials.
- Assets -- the token balances held in that account (BTC, ETH, USD, etc.).
You can have as many accounts as you like. A common setup is one Paper account for testing and one Kraken account for live trading.
Account Types
Botmarley supports three account types. Each behaves differently with respect to credentials, verification, and trading.
Paper (Simulated)
| Property | Value |
|---|---|
| Requires credentials | No |
| Connects to exchange | No |
| Verification status | Always "N/A" |
Paper accounts are purely local. No money leaves your machine, and no API calls are made to any exchange. Paper accounts are ideal for:
- Learning how Botmarley works without financial risk.
- Testing a new strategy before going live.
- Running backtests against historical data.
When you create a Paper account, Botmarley assigns it a starting balance that you can adjust manually. Trades executed against a Paper account update its local balances but never touch a real order book.
Start with a Paper account. You can always add a real exchange account later once you are comfortable with how your strategies behave.
Kraken (Real Exchange)
| Property | Value |
|---|---|
| Requires credentials | Yes (API key + secret) |
| Connects to exchange | Yes -- Kraken REST + WebSocket APIs |
| Verification status | Must be verified before use |
Kraken accounts connect Botmarley to your real Kraken exchange account using API credentials that you generate on Kraken's website. Once verified, Botmarley can:
- Sync balances -- pull your current holdings from Kraken.
- Place orders -- execute buy/sell orders during live trading sessions.
- Fetch market data -- download candle history via the Kraken REST API.
You control what Botmarley is allowed to do by setting the appropriate API key permissions on Kraken (see the Managing Accounts chapter for details).
A Kraken account operates with real money. Double-check your strategy in Paper mode before pointing it at a Kraken account.
Binance
| Property | Value |
|---|---|
| Requires credentials | Yes (API key + secret) |
| Connects to exchange | Yes |
| Verification | HMAC-SHA256 signed request to /api/v3/account |
A Binance account connects to the Binance exchange using your API key and secret. Botmarley supports:
- Verify credentials -- test the connection with a signed request.
- Sync balances -- pull your current holdings from Binance.
- Place orders -- execute spot market orders (BUY with quoteOrderQty, SELL with quantity).
- Fetch market data -- download candle history via the Binance REST API.
Botmarley automatically applies LOT_SIZE and MARKET_LOT_SIZE filters from Binance exchangeInfo to ensure order quantities are valid.
A Binance account operates with real money. Double-check your strategy in Paper mode before pointing it at a Binance account.
Verification States
Every account has a verification status that reflects whether Botmarley has successfully tested the connection to the exchange.
| Status | Badge Color | Meaning |
|---|---|---|
| Unverified | Yellow | Credentials have been entered but not yet tested. |
| Verified | Green | Botmarley connected to the exchange and confirmed the credentials work. |
| Failed | Red | The last verification attempt failed (bad key, wrong permissions, network error). |
| N/A | Gray | Verification does not apply to this account type (Paper accounts). |
Verification is performed by making a signed API request to the exchange's private balance endpoint. If the exchange responds without errors, the credentials are marked Verified. If the exchange returns an authentication error or the request fails, the status is set to Failed.
If verification fails, check that your API key has not expired and that you copied both the key and the secret correctly. Kraken secrets are base64-encoded strings -- make sure you copied the entire value without extra whitespace.
When to Use Paper vs. Real Accounts
flowchart TD
    A["New strategy idea"] --> B{"Tested in backtesting?"}
    B -- No --> C["Run backtest with Paper account"]
    C --> B
    B -- Yes --> D{"Happy with results?"}
    D -- No --> E["Adjust strategy parameters"]
    E --> C
    D -- Yes --> F{"Ready for real money?"}
    F -- No --> G["Run live Paper session\n(simulated orders)"]
    G --> F
    F -- Yes --> H["Switch to Kraken account\nfor live trading"]
The recommended workflow:
- Backtest first -- use a Paper account and historical data to validate your strategy logic.
- Paper-trade live -- run the strategy in live mode against a Paper account. This exercises the real-time data feed without risking funds.
- Go live -- once confident, create or select a verified Kraken account and start a live trading session.
This progression lets you catch problems early, before any real capital is at stake.
Managing Accounts
This chapter walks through every account management operation: creating, verifying, syncing, editing, and deleting accounts. All of these actions are performed from the Accounts page at /accounts.
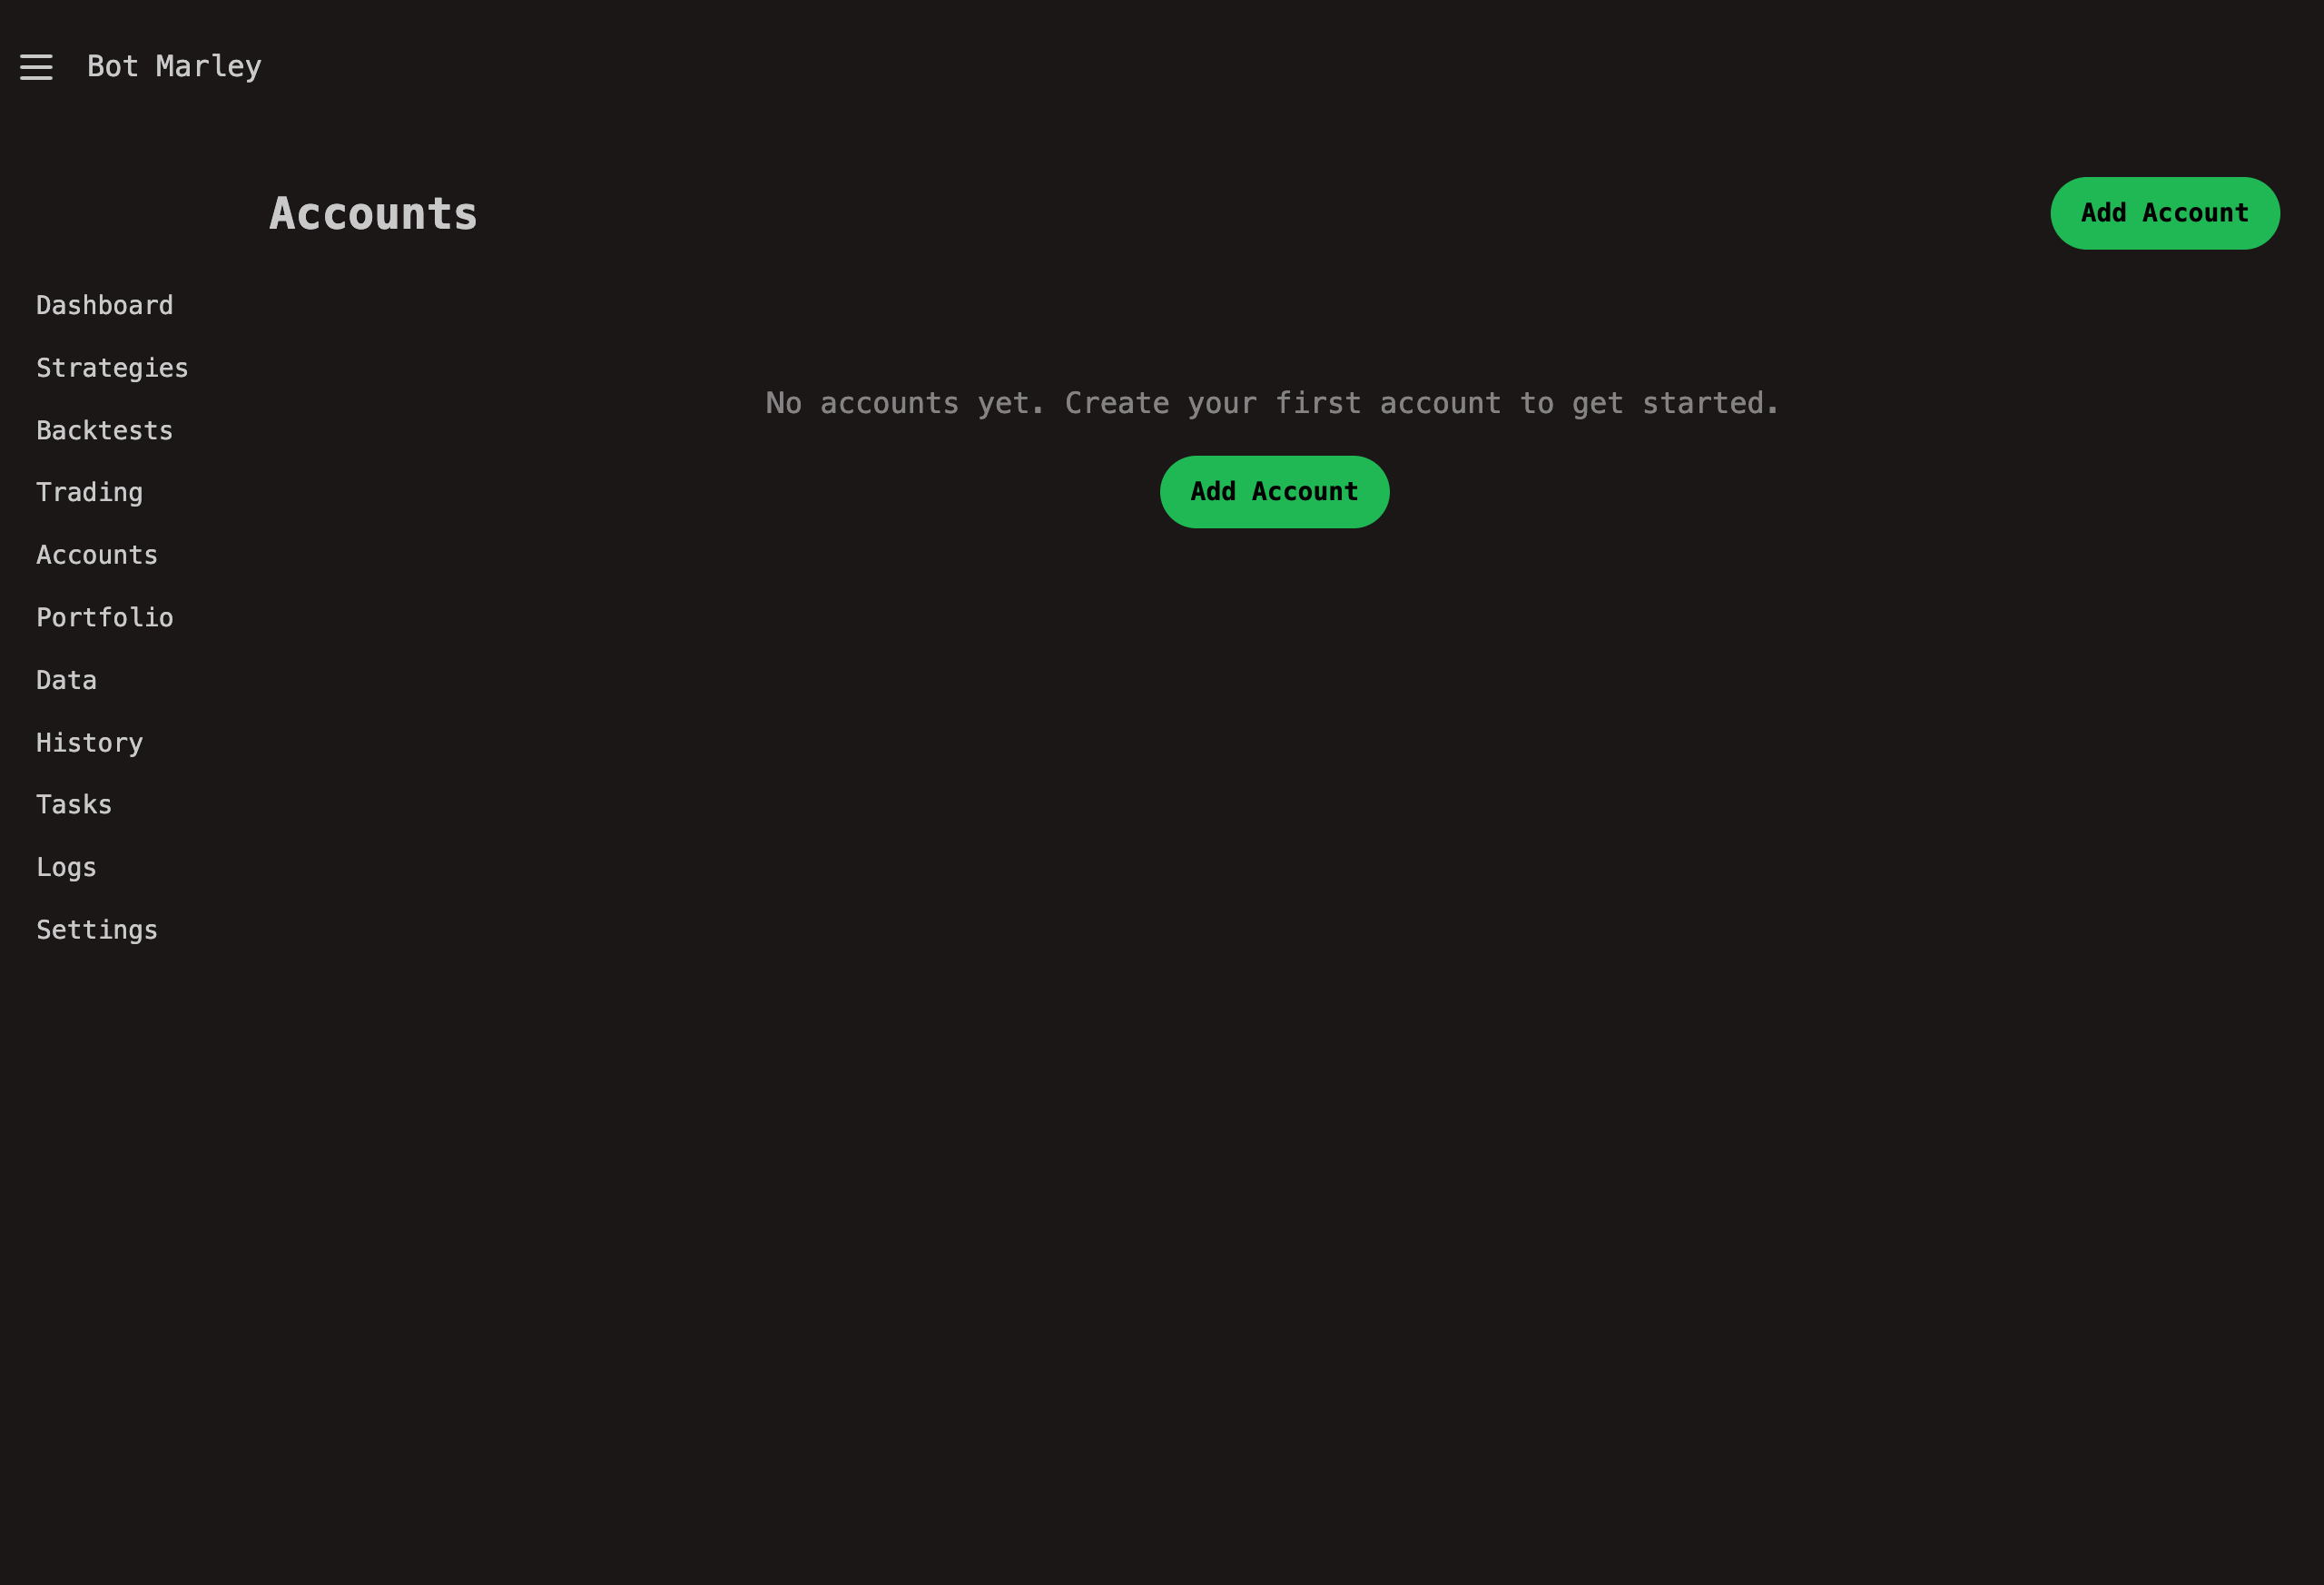
Creating a New Account
The Accounts page lists all your configured accounts with their type, verification status, and available actions.
- Navigate to the Accounts page using the sidebar or by visiting
/accounts. - Click the Add Account button in the top-right corner. A modal dialog opens.
- Fill in the form fields:
| Field | Required | Description |
|---|---|---|
| Name | Yes | A label for the account (e.g. "Kraken Main", "Paper Test"). |
| Description | No | Optional notes for your own reference. |
| Account Type | Yes | Choose Paper, Kraken, or Binance from the dropdown. |
| API Key | Kraken/Binance only | Your exchange API key. Hidden when Paper is selected. |
| API Secret | Kraken/Binance only | Your exchange API secret. Hidden when Paper is selected. |
- Click Create.
Botmarley redirects you back to the accounts list. Your new account appears in the table with a verification status of Unverified (for exchange accounts) or N/A (for Paper accounts).
For Paper accounts, you can skip the API fields entirely. Just give it a name, select "Paper (Simulated)", and click Create.
Getting Exchange API Keys
To connect an exchange account, you need an API key pair generated from the exchange's website.
Kraken API Keys
- Log in to your Kraken account at https://www.kraken.com.
- Navigate to Settings (gear icon) then API.
- Click Create API Key (or Generate New Key).
- Give the key a descriptive name (e.g. "Botmarley Trading Bot").
- Set the permissions (see below).
- Click Generate Key.
- Copy both the API Key and the Private Key (secret) immediately. Kraken only shows the secret once. If you lose it, you must generate a new key pair.
- Paste the key and secret into Botmarley's account creation form.
Kraken displays the API secret (Private Key) only at the moment of creation. There is no way to retrieve it later. If you navigate away before copying it, you will need to delete the key and generate a new one.
Binance API Keys
- Log in to your Binance account at https://www.binance.com.
- Navigate to Account then API Management.
- Click Create API and give the key a label (e.g. "Botmarley Trading Bot").
- Complete any required security verification (2FA).
- Copy both the API Key and the Secret Key immediately. Binance only shows the secret at creation time.
- Paste the key and secret into Botmarley's account creation form.
Binance displays the API Secret Key only at the moment of creation. If you close the dialog before copying it, you will need to delete the key and generate a new one.
Setting API Key Permissions
Both Kraken and Binance let you control what each API key can do. The permissions you need depend on how you plan to use Botmarley.
Kraken Permissions
Read-only (monitoring and portfolio tracking)
If you only want to sync balances and track your portfolio, enable:
- Query Funds -- allows Botmarley to read your account balances.
- Query Open Orders & Trades -- allows Botmarley to read trade history.
This is the safest option. The key cannot place or cancel orders.
Trading (live bot execution)
If you want Botmarley to place orders on your behalf during live trading sessions, you also need:
- Create & Modify Orders -- allows Botmarley to submit new orders.
- Cancel/Close Orders -- allows Botmarley to cancel open orders.
Permissions to avoid
Unless you have a specific reason, do not enable:
- Withdraw Funds -- Botmarley never needs withdrawal access.
- Access WebSockets API -- not currently required for Botmarley's Kraken integration (REST is used).
Binance Permissions
Read-only (monitoring and portfolio tracking)
- Enable Reading -- allows Botmarley to read your account balances and trade history.
Trading (live bot execution)
- Enable Spot & Margin Trading -- allows Botmarley to place spot market orders.
Permissions to avoid
- Enable Withdrawals -- Botmarley never needs withdrawal access.
- Enable Futures -- Botmarley currently supports spot trading only.
Only grant the permissions Botmarley actually needs. Never enable withdrawal permissions for a bot API key. If a key is ever compromised, withdrawal access would put your funds at direct risk.
Verifying Credentials
After creating an exchange account, its status is Unverified. Verification confirms that the API key and secret are correct and that Botmarley can reach the exchange.
How to verify
- On the Accounts page, find the account row in the table.
- Click the Verify button (checkmark icon or "Verify" label).
- Botmarley enqueues an
AccountVerifytask and redirects you to the Tasks page. - The task worker picks up the job and makes a signed request to the exchange's balance endpoint. Kraken uses HMAC-SHA512 signing against
/0/private/Balance; Binance uses HMAC-SHA256 signing against/api/v3/account. - If the exchange responds successfully, the account status changes to Verified.
- If authentication fails, the status changes to Failed.
You can check the result by returning to the Accounts page or watching the task complete on the Tasks page.
Verification is a one-time check. If you later rotate your API keys on the exchange, you will need to update the credentials in Botmarley and re-verify.
Troubleshooting verification failures
| Symptom | Likely cause | Fix |
|---|---|---|
| Status stays "Failed" | Incorrect API key or secret | Double-check the values; re-paste from the exchange if needed. |
| Status stays "Failed" | API key expired or revoked | Generate a new key on the exchange. |
| Status stays "Failed" | Missing read/query permissions | Edit the key on the exchange and enable the required permission. |
| Task never completes | Network issue or server not running | Check the server logs and internet connectivity. |
Syncing Account Assets
Syncing pulls the current token balances from the exchange into Botmarley's database. This is how Botmarley knows what you hold.
How to sync
- On the Accounts page, click the Sync button on the account row.
- Botmarley enqueues an
AccountSynctask. - The task worker calls the exchange API (Kraken's
/0/private/Balanceor Binance's/api/v3/account), retrieves all non-zero balances, normalizes the token names, and upserts them into theaccount_assetstable. - Once complete, the account's asset list is updated.
You can expand an account row to see its assets, or visit the Portfolio page for an aggregated view across all accounts.
Paper accounts cannot be synced from an exchange (there is no exchange). Their balances are set manually or updated by the trading engine during simulated sessions.
Token name normalization
Kraken uses internal token names that differ from standard symbols. Botmarley normalizes them automatically during sync:
| Kraken name | Normalized |
|---|---|
| XXBT | XBT |
| XETH | ETH |
| ZUSD | USD |
| XLTC | LTC |
| XXRP | XRP |
Tokens that do not match a known pattern (e.g. DOT, USDC) are stored as-is.
Binance uses standard token symbols (BTC, ETH, USDC, etc.), so no normalization is needed for Binance accounts.
Editing an Account
- On the Accounts page, click the Edit button (pencil icon) on the account row.
- The edit modal opens with the current name, description, and type pre-filled.
- Modify the fields you want to change.
- For credentials: leave the API Key and API Secret fields empty to keep the existing values. Only fill them in if you want to replace them.
- Click Save Changes.
After editing credentials, you should re-verify the account to confirm the new keys work.
Deleting an Account
- On the Accounts page, click the Delete button on the account row.
- Botmarley deletes the account and all associated assets from the database.
Deleting an account removes it and all its stored asset data from Botmarley's database. This cannot be undone. Your funds on the actual exchange are not affected -- only Botmarley's local record is removed.
Deletion also cascades to portfolio snapshots associated with that account. Aggregate (cross-account) portfolio snapshots are not deleted, but they will no longer include the removed account in future syncs.
API Key Security
Botmarley stores API credentials in the local PostgreSQL database. Here are the safeguards in place and the precautions you should take.
What Botmarley does
- Secrets are never sent to the browser. The
Accountstruct has ato_view()method that masks the API key (showing only the first and last 4 characters) and omits the secret entirely. - Credentials stay local. Botmarley is a single-tenant application running on your machine. There is no cloud service, no third-party server, and no telemetry that transmits your keys.
What you should do
- Never share your API secret with anyone.
- Never enable Withdraw permissions on keys used by bots.
- Use a dedicated API key for Botmarley rather than reusing one from another tool.
- Rotate keys periodically -- delete the old key on the exchange and generate a new one.
- Restrict IP access if the exchange supports it for your key -- lock the key to the IP address where Botmarley runs.
- Back up your database carefully -- the PostgreSQL database contains the raw API secret. Treat database dumps with the same care as the secrets themselves.
Portfolio Tracking
The Portfolio page gives you a consolidated view of everything you hold across all your accounts -- Paper and exchange alike -- valued in both USD and BTC, updated automatically over time.
What Is Portfolio Tracking?
Portfolio tracking answers a simple question: how much is everything worth, right now and over time?
Botmarley periodically takes a "snapshot" of your portfolio. Each snapshot records:
- The total value in USD across all accounts.
- The total value in BTC (your USD total divided by the current BTC price).
- The BTC/USD price at that moment.
- A per-token breakdown showing balance and USD value for each asset.
By storing snapshots over time, Botmarley can draw charts showing how your portfolio value has changed -- and whether you are gaining or losing ground relative to Bitcoin itself.
How It Works
Portfolio syncing follows a pipeline that runs on a fixed schedule and can also be triggered manually.
Automatic sync schedule
A background scheduler starts when the Botmarley server boots. After an initial 60-second startup delay, it enqueues a PortfolioSync task every 1 hour. The task worker picks it up and runs the full sync pipeline.
The sync pipeline
flowchart LR
    A["Scheduler\n(every 1h)"] -->|enqueues task| B["Task Worker"]
    B --> C["Sync Exchange\nAccounts"]
    C --> D["Query All\nAccount Assets"]
    D --> E["Fetch USD Prices\n(Kraken Ticker API)"]
    E --> F["Compute Totals\n(USD + BTC)"]
    F --> G["Store Snapshot\n(PostgreSQL)"]
In detail, each sync performs these steps:
- Sync verified exchange accounts -- for every exchange account with status "Verified", Botmarley calls the exchange API to pull the latest balances. Failed syncs for individual accounts are logged but do not stop the pipeline.
- Query all account assets -- reads every non-zero asset balance across all accounts (including Paper) from the database.
- Fetch USD prices -- calls the Kraken public Ticker API to get current USD prices for each unique token. Stablecoins and fiat are handled locally (see below).
- Compute totals -- sums up
balance * pricefor every asset to gettotal_value_usd. Fetches the BTC/USD price separately and calculatestotal_value_btc = total_value_usd / btc_price. - Store snapshot -- inserts one aggregate row (with
account_id = NULL) into theportfolio_snapshotstable, including a JSON breakdown of per-token values.
The Portfolio Page
The portfolio page is located at /portfolio. It has several sections, described from top to bottom.
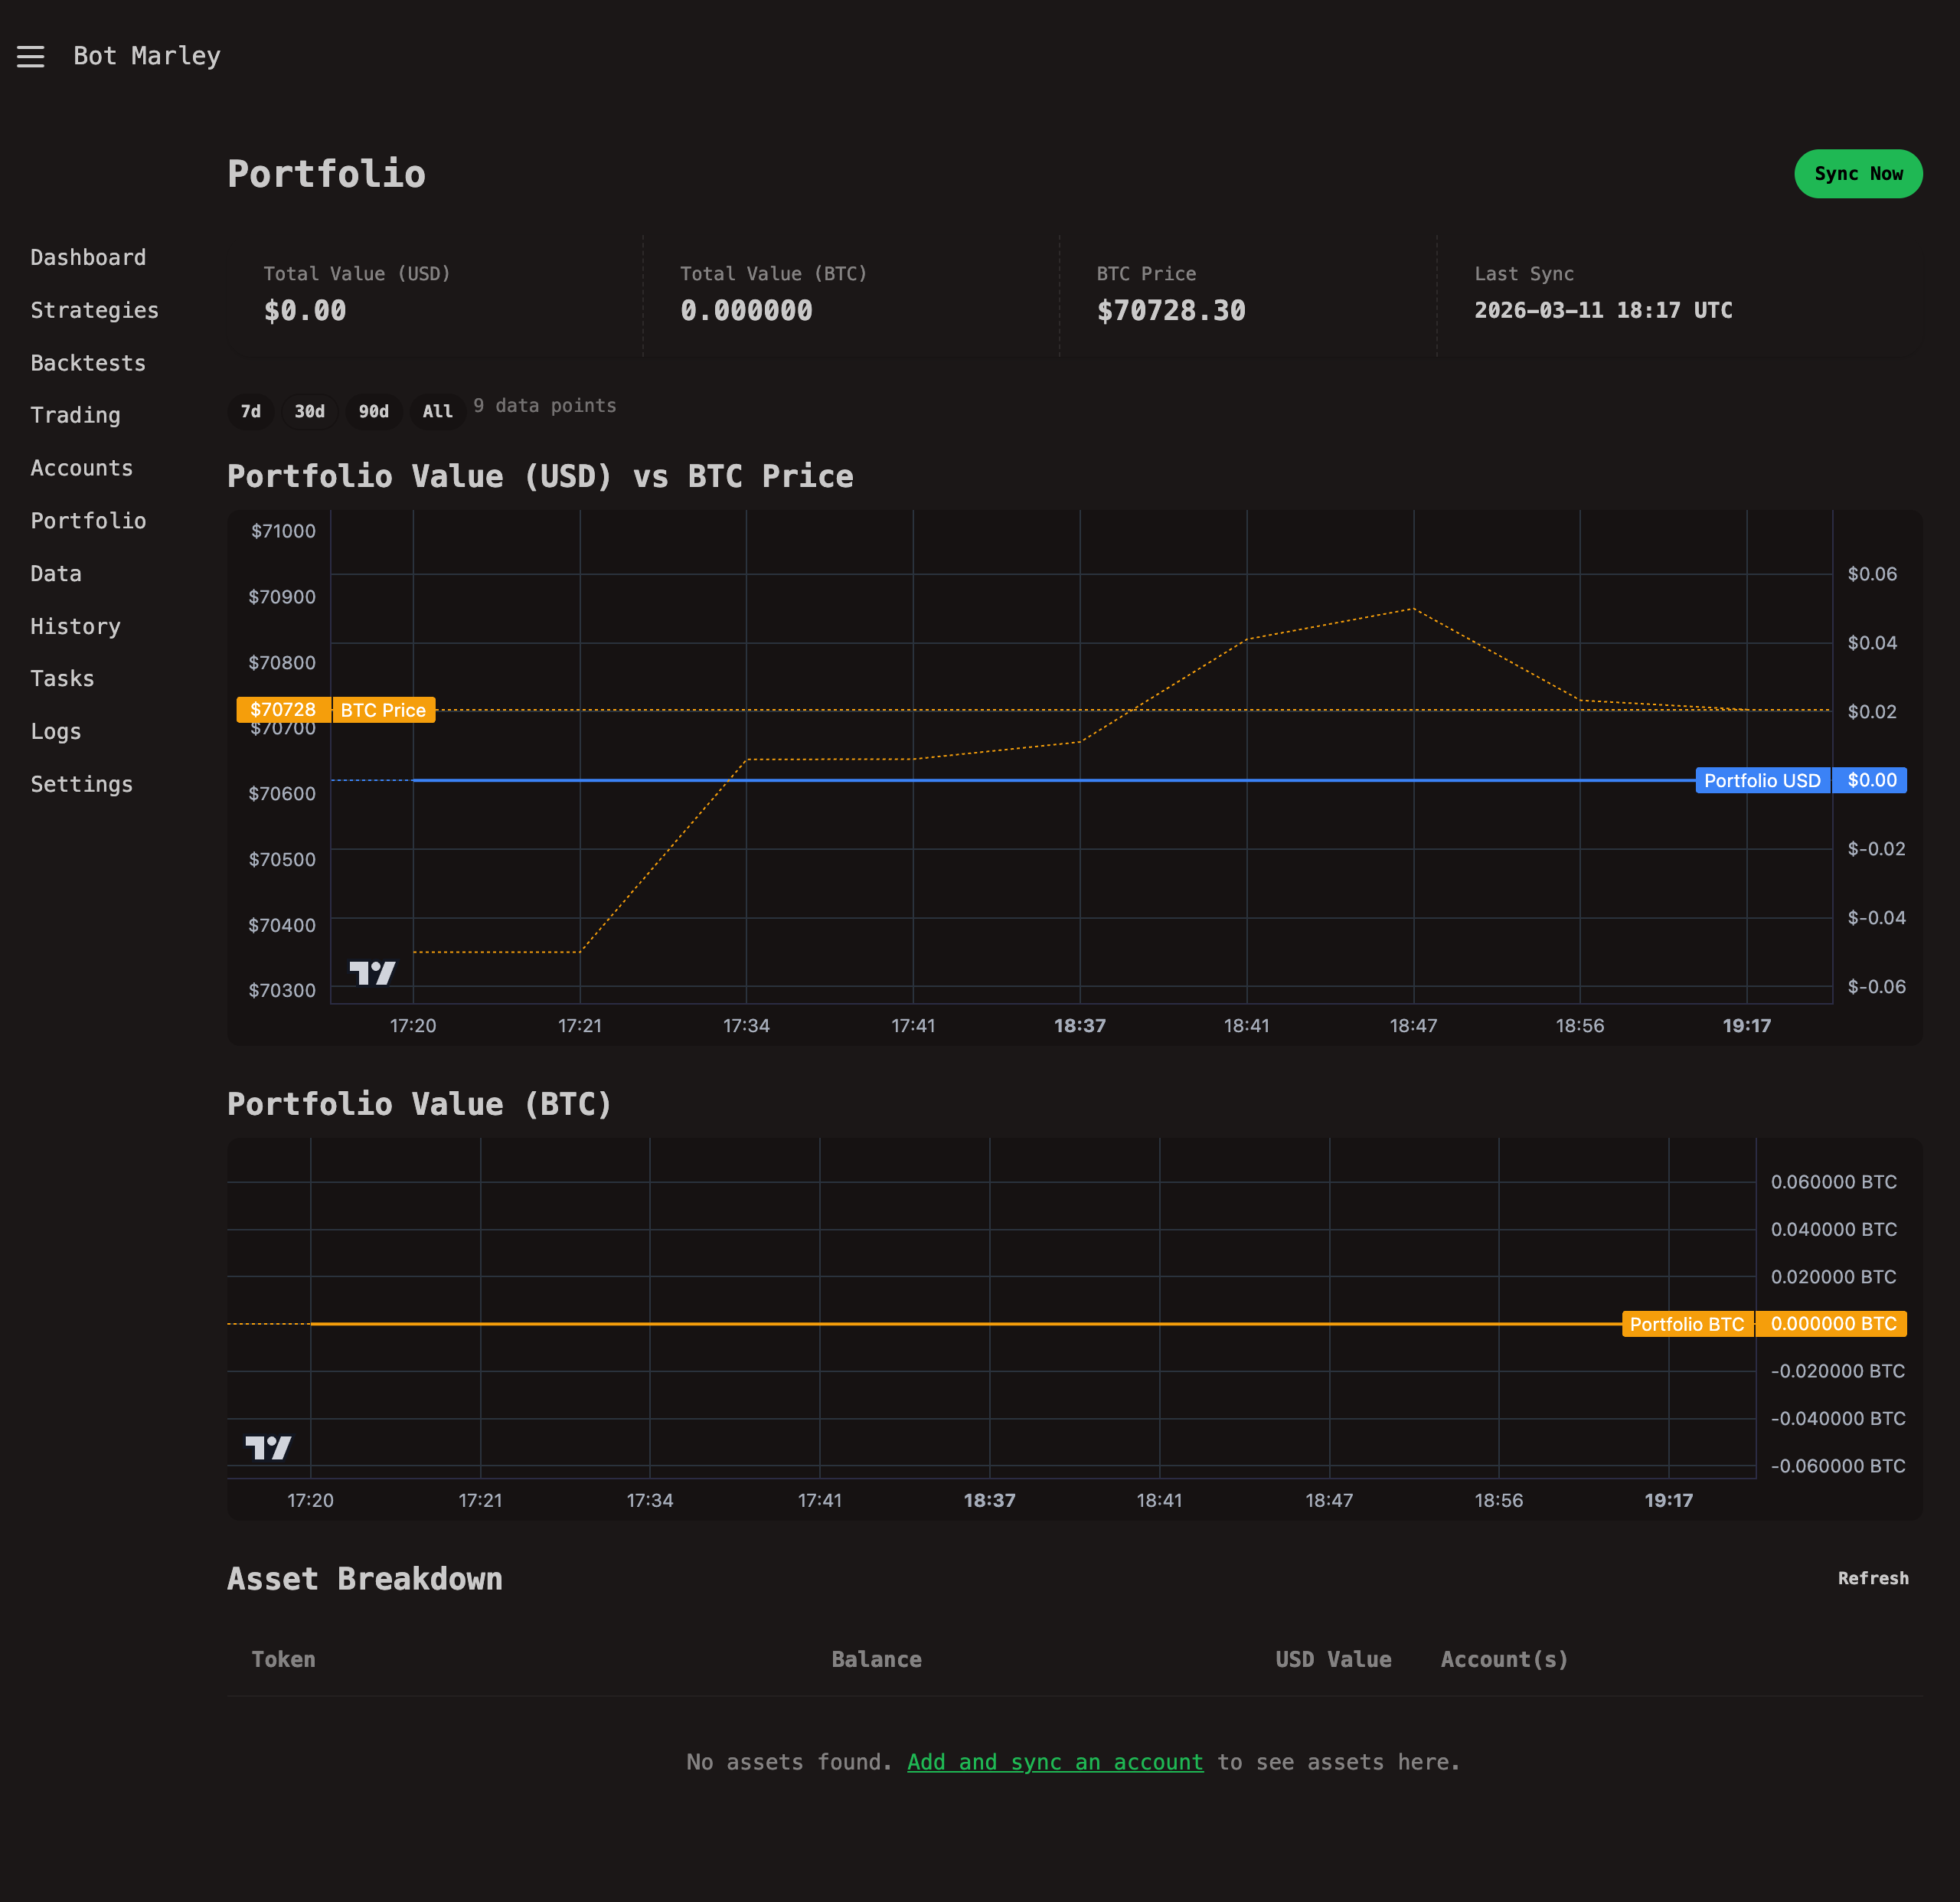
Summary Cards
Four stat cards appear at the top of the page:
| Card | Description | Example |
|---|---|---|
| Total Value (USD) | Sum of all assets across all accounts, converted to USD. | $12,345.67 |
| Total Value (BTC) | Your USD total divided by the current BTC price. | 0.142857 |
| BTC Price | The latest BTC/USD price fetched from Kraken. | $86,420.00 |
| Last Sync | Timestamp of the most recent portfolio snapshot. | 2026-03-11 14:00 UTC |
If no snapshots exist yet (fresh install), the page shows an empty state with buttons to manage accounts or run a first sync.
Range Selector
Below the summary cards, a row of small buttons lets you control the time range for the charts:
| Button | Time range |
|---|---|
| 7d | Last 7 days |
| 30d | Last 30 days (default) |
| 90d | Last 90 days |
| All | All available history |
Switching ranges fetches new data from /api/portfolio/chart?range=... and updates both charts without a full page reload. A small label next to the buttons shows how many data points are in the current view.
USD Chart: Portfolio Value + BTC Price Overlay
The first chart displays two lines on a dual-axis layout:
- Portfolio USD (blue, right axis) -- your total portfolio value over time in US dollars.
- BTC Price (amber/dashed, left axis) -- the Bitcoin price over the same period.
This overlay lets you visually compare whether your portfolio is outperforming or underperforming a simple Bitcoin hold. The charts are rendered using Lightweight Charts loaded from a CDN.
BTC Chart: Portfolio Value in BTC
The second chart shows a single amber line: your portfolio's value expressed in Bitcoin. If this line trends upward, you are accumulating more BTC-equivalent value over time, even if the USD value moves sideways.
Asset Breakdown Table
Below the charts, a table lists every token you hold across all accounts:
| Column | Description |
|---|---|
| Token | The asset symbol (BTC, ETH, USDC, etc.) |
| Balance | Total holdings of that token across all accounts. |
| USD Value | Balance multiplied by the current USD price. |
| Account(s) | Which accounts hold this token and how much each one holds. |
The table includes a Refresh button that fetches the latest data via HTMX without reloading the page. Assets are sorted by USD value in descending order, so your largest holdings appear first.
Manual Sync
You do not have to wait for the hourly scheduler. To trigger a portfolio sync on demand:
- Go to the Portfolio page (
/portfolio). - Click the Sync Now button in the top-right corner.
- Botmarley enqueues a
PortfolioSynctask and redirects you back to the portfolio page. - The task worker processes the sync (usually completes within a few seconds).
- Refresh the page to see updated values and charts.
After adding a new exchange account and verifying it, click "Sync Now" on the Portfolio page to immediately pull in its balances rather than waiting for the next scheduled sync.
How Prices Are Fetched
Botmarley uses the Kraken public Ticker API to fetch USD prices. This endpoint requires no authentication and has generous rate limits.
The API call
A single request is made to https://api.kraken.com/0/public/Ticker?pair=XXBTZUSD,XETHZUSD,... with all needed trading pairs joined by commas. The response includes the last trade price for each pair, which Botmarley uses as the current price.
Token-to-pair mapping
Botmarley maps normalized token names to Kraken trading pair identifiers:
| Token | Kraken Pair |
|---|---|
| BTC / XBT | XXBTZUSD |
| ETH | XETHZUSD |
| LTC | XLTCZUSD |
| XRP | XXRPZUSD |
| XLM | XXLMZUSD |
| (others) | {TOKEN}USD |
For tokens that Kraken does not list, the price falls back to 0.0 and a warning is logged.
Stablecoin Handling
Stablecoins and fiat currencies are handled without an API call:
| Tokens | Assumed USD price |
|---|---|
| USD, USDC, USDT, BUSD, DAI, TUSD, USDP, GUSD | $1.00 |
| EUR, GBP, CAD, AUD, CHF, JPY | ~$1.00 (rough approximation) |
The fiat approximation (treating EUR, GBP, etc. as $1.00) is a simplification. For portfolios with significant fiat holdings in non-USD currencies, the total USD value will be approximate. A more accurate forex conversion may be added in a future release.
Architecture: Full Sync Flow
The following diagram shows the complete lifecycle of a portfolio sync, from trigger through to the stored snapshot.
sequenceDiagram
    participant S as Scheduler (1h) /<br>Manual Button
    participant Q as Task Queue
    participant W as Task Worker
    participant K as Kraken API
    participant DB as PostgreSQL

    S->>Q: Enqueue PortfolioSync task
    Q->>W: Dequeue task

    Note over W: Step 1: Sync exchange accounts
    W->>DB: List verified exchange accounts
    DB-->>W: [Kraken accounts]
    loop Each verified account
        W->>K: POST /0/private/Balance (signed)
        K-->>W: Token balances
        W->>DB: Upsert account_assets
    end

    Note over W: Step 2: Gather all assets
    W->>DB: SELECT token, balance FROM account_assets
    DB-->>W: All non-zero balances

    Note over W: Step 3: Fetch prices
    W->>K: GET /0/public/Ticker?pair=...
    K-->>W: USD prices per pair

    Note over W: Step 4-5: Compute and store
    W->>W: total_usd = SUM(balance * price)<br>total_btc = total_usd / btc_price
    W->>DB: INSERT INTO portfolio_snapshots
    DB-->>W: Snapshot ID

    W->>Q: Mark task complete
If a single exchange account fails to sync (e.g., temporary network error), the pipeline continues with the remaining accounts. The snapshot will still be created using whatever data was successfully retrieved. Check the Activity Logs or Task Queue for details on any failures.
Strategies Overview
What Is a Trading Strategy?
A trading strategy is a set of rules that tell Botmarley when to buy and when to sell a cryptocurrency. Instead of watching charts all day and making emotional decisions, you define your rules once, and Botmarley follows them automatically -- 24 hours a day, 7 days a week.
Think of a strategy as a recipe:
- Ingredients are market data (prices, indicators, candle patterns).
- Instructions are the rules (if RSI drops below 30, buy).
- The result is consistent, disciplined trading without human emotion.
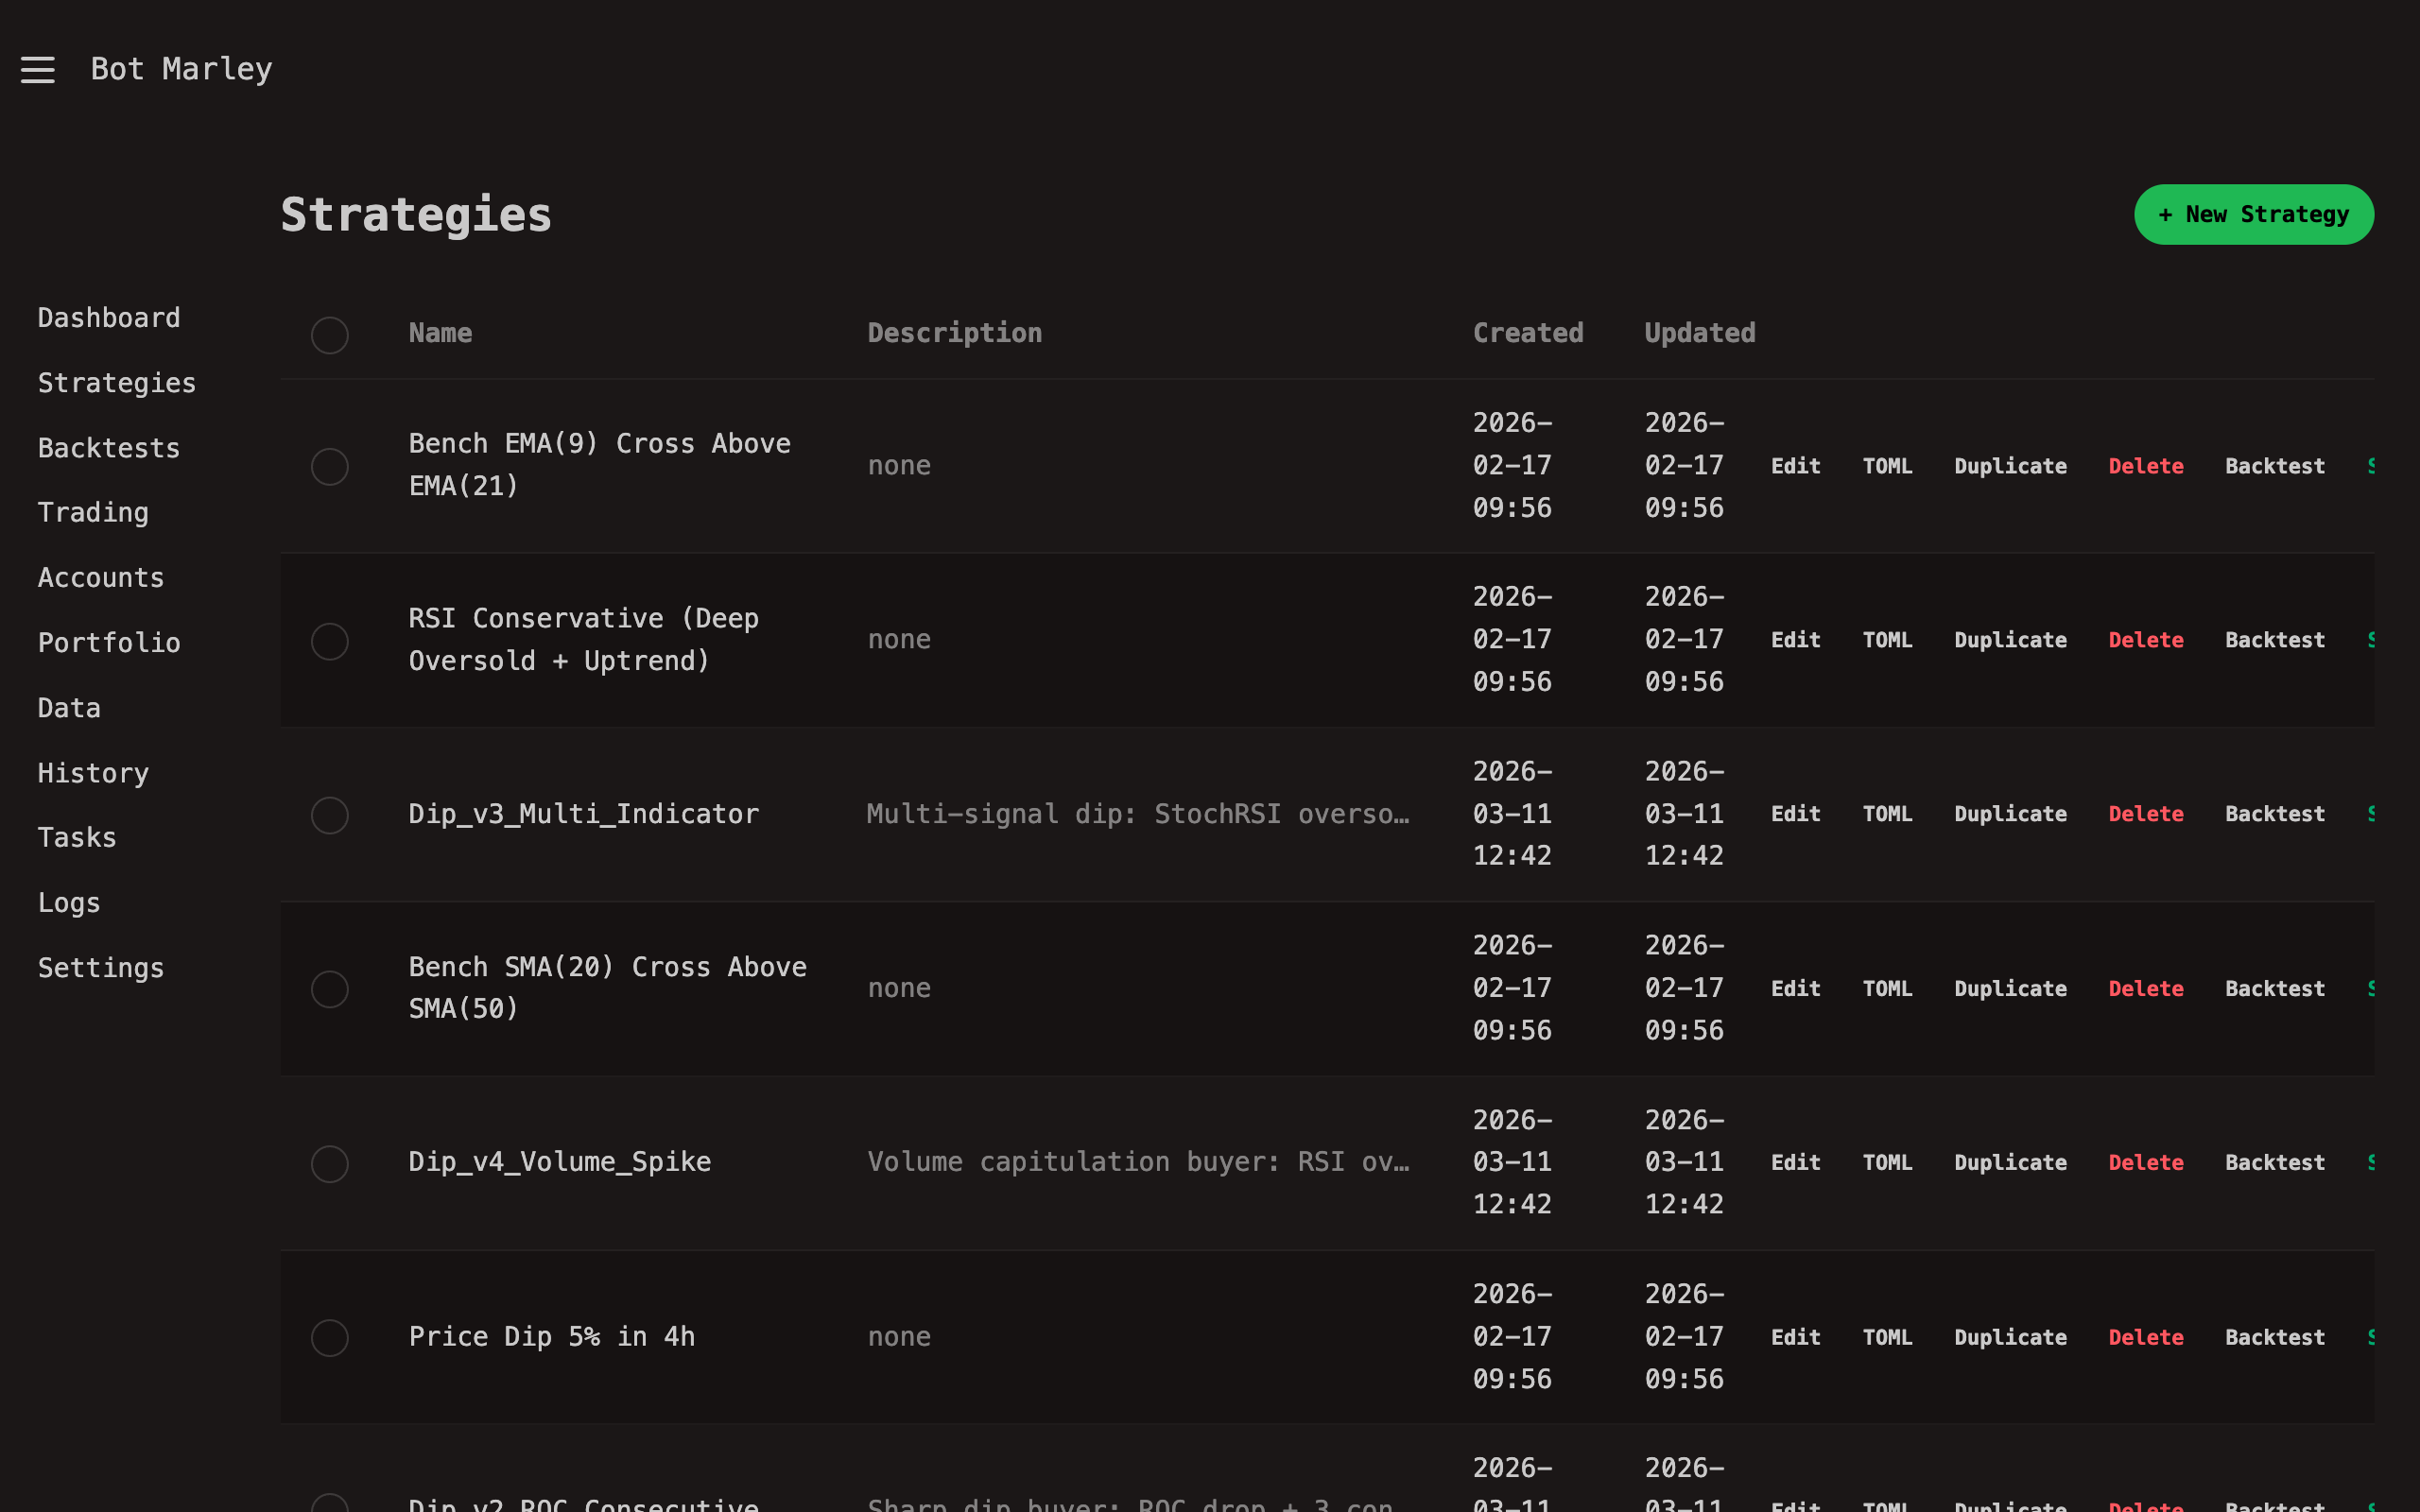
The Strategies List
The web interface provides a central place to manage all your strategies. From the list page you can edit, duplicate, delete, backtest, or start live trading for any strategy with a single click.
How Botmarley Strategies Work
Botmarley strategies are defined as TOML files -- simple, human-readable text files that describe a rule engine. Each strategy file lives in the strats/ directory and contains:
- Metadata -- the strategy's name, description, and position limits.
- Actions -- a list of things the bot can do (open a position, add to it, or sell).
- Triggers -- conditions that must be true for each action to fire.
Botmarley's strategy engine is exchange-agnostic. The same strategy TOML file works for any trading pair -- you select the pair when you start a backtest or live session, not in the strategy itself.
Strategy Evaluation Flow
Every time a new candle closes, Botmarley evaluates your strategy. Here is how the evaluation loop works:
flowchart TD
    A["New Candle Received"] --> B["For Each Action in Strategy"]
    B --> C{"Check ALL Triggers<br/>(AND logic)"}
    C -- "All triggers TRUE" --> D["Execute Action<br/>(open_long / buy / sell)"]
    C -- "Any trigger FALSE" --> E["Skip This Action"]
    D --> F["Update Position State"]
    E --> F
    F --> G{"More Actions?"}
    G -- "Yes" --> B
    G -- "No" --> H["Wait for Next Candle"]
    H --> A

    style A fill:#4a9eff,color:#fff
    style D fill:#22c55e,color:#fff
    style E fill:#6b7280,color:#fff
    style H fill:#4a9eff,color:#fff
Key points about evaluation:
- Each action is evaluated independently -- one strategy can have multiple buy and sell actions, and each is checked every tick.
- Triggers within an action are AND-combined -- ALL triggers must be true for the action to fire.
- Actions are evaluated in order -- from first to last as written in the TOML file.
Basic Strategy Anatomy
A Botmarley strategy TOML file has two main sections:
1. The [meta] Section
This defines your strategy's identity and global settings:
[meta]
name = "My First Strategy"
description = "A simple RSI-based entry and exit"
max_open_positions = 3
| Field | Required | Description |
|---|---|---|
name | Yes | Human-readable name for the strategy |
description | No | Optional explanation of the strategy's logic |
max_open_positions | No | Maximum concurrent open positions. Omit for unlimited. |
2. The [[actions]] Array
Each [[actions]] block defines one thing the bot can do, along with the conditions that must be met:
[[actions]]
type = "open_long"          # What to do: open_long, buy, or sell
amount = "100 USDC"         # How much: fixed amount or percentage
average_price = false        # Whether to average the entry price (DCA)

  [[actions.triggers]]       # When to do it: one or more trigger conditions
  indicator = "rsi_14"
  operator = "<"
  target = "30"
A Simple Complete Example
Here is a complete, working strategy that buys when RSI is oversold and sells when it recovers:
[meta]
name = "RSI_Scalper"

# ACTION 1: Open a position when RSI drops below 30
[[actions]]
type = "open_long"
amount = "100 USDC"

  [[actions.triggers]]
  indicator = "rsi_14"
  operator = "<"
  target = "30"

# ACTION 2: Sell half when RSI recovers to 50
[[actions]]
type = "sell"
amount = "50%"

  [[actions.triggers]]
  indicator = "rsi_14"
  operator = ">"
  target = "50"

# ACTION 3: Sell everything when RSI reaches 70
[[actions]]
type = "sell"
amount = "100%"

  [[actions.triggers]]
  indicator = "rsi_14"
  operator = ">"
  target = "70"
What this strategy does, step by step:
- Action 1 watches RSI(14). When it drops below 30 (oversold territory), the bot opens a new position by buying 100 USDC worth of the asset.
- Action 2 watches for RSI to rise above 50. When it does, the bot sells 50% of the position to lock in partial profit.
- Action 3 watches for RSI to rise above 70 (overbought territory). When it does, the bot sells the remaining 100% of the position to fully exit.
Start simple. A strategy with 2-3 actions is often more effective than a complex one with 10 actions. You can always add complexity after backtesting confirms the base logic works.
What's Next?
Now that you understand how strategies are structured, explore the following topics:
- Strategy Editor -- how to create and edit strategies in the web interface.
- Actions -- detailed explanation of
open_long,buy, andsell. - Indicators Reference -- every indicator Botmarley supports.
- Timeframes -- how multi-timeframe analysis works.
- Position Management -- DCA, position limits, and partial sells.
- Strategy Examples -- complete, battle-tested strategies you can use as starting points.
Strategy Editor
The Strategy Editor is where you create, edit, and manage your trading strategies. Access it from the sidebar by clicking Strategies or navigating directly to /strats.
The Strategies List Page
The strategies list page (/strats) shows all your saved strategies. For each strategy you can see:
- The strategy name and description
- When it was created and last updated
- Action buttons for editing, duplicating, backtesting, and deleting
flowchart LR
    A["Strategies List<br/>/strats"] --> B["Edit<br/>/strats/edit/{id}"]
    A --> C["New Strategy<br/>/strats/new"]
    A --> D["Duplicate"]
    A --> E["Delete"]
    A --> F["Backtest"]
    B --> G["Save"]
    C --> G
    G --> A

    style A fill:#4a9eff,color:#fff
    style G fill:#22c55e,color:#fff
Creating a New Strategy
To create a new strategy:
- Navigate to
/strats(click Strategies in the sidebar). - Click the New Strategy button.
- The editor opens with an empty TOML document.
- Write your strategy in TOML format (see Strategy Overview for the structure).
- Click Save.
The editor assigns a unique ID (UUID) to your new strategy automatically.
If you are new to writing strategies, start by duplicating one of the existing strategies and modifying it. This is faster than writing from scratch and helps you learn the TOML structure by example.
The Visual Strategy Editor
The visual editor provides a form-based interface for building strategies without writing TOML by hand. You can add actions, configure triggers, set indicator parameters, and define position management rules -- all through a structured UI.
The TOML Text Editor
The strategy editor at /strats/edit/{id} provides a text-based TOML editor where you write your strategy directly. The editor shows the raw TOML content of your strategy file.
A typical editing session looks like this:
- The
[meta]section is at the top -- set your strategy's name and description here. - Below that, define your
[[actions]]blocks with their triggers. - As you type, the editor validates your TOML in real time.
Editor Layout
The editor page provides:
- Strategy name displayed at the top
- TOML text area for editing the strategy content
- Save button to persist changes
- Back to list link to return to
/strats
Real-Time Validation
Every time you save or validate your strategy, Botmarley checks the TOML content for errors. The validation endpoint (POST /api/strats/validate) checks:
- TOML syntax -- is the file valid TOML?
- Required fields -- does
[meta]have aname? Does each action have atypeandamount? - Valid action types -- only
open_long,buy, andsellare accepted. - Amount format -- must be
"100 USDC"(fixed) or"50%"(percentage). - Indicator format -- must match known patterns like
rsi_14,sma_50,bb_lower. - Operator validity -- must be one of
>,<,=,cross_above,cross_below. - Timeframe validity -- if specified, must be
1m,5m,15m,1h,4h, or1d. - Period ranges -- indicator periods must be between 1 and 200.
max_open_positions-- if set, must be 1 or greater.
When validation fails, the error response includes:
| Field | Description |
|---|---|
field_path | Where the error is, e.g. actions[0].triggers[1].operator |
error_code | Machine-readable code like INVALID_FORMAT or REQUIRED |
message | Human-readable description of the problem |
suggestion | Hint for how to fix the error |
Botmarley will not let you save an invalid strategy. Fix all validation errors before saving. This prevents broken strategies from being used in backtests or live trading.
Common Validation Errors
| Error | Cause | Fix |
|---|---|---|
INVALID_ACTION_TYPE | Typo in action type | Use open_long, buy, or sell |
INVALID_AMOUNT_FORMAT | Missing unit or wrong format | Use "100 USDC" or "50%" |
INVALID_PERIOD | Non-numeric indicator period | Use rsi_14 not rsi_fourteen |
INVALID_PERIOD_RANGE | Period 0 or > 200 | Keep periods between 1 and 200 |
REQUIRED | Missing indicator or operator | Add the missing field to your trigger |
INVALID_TIMEFRAME | Unknown timeframe string | Use 1m, 5m, 15m, 1h, 4h, or 1d |
INVALID_OPERATOR | Unknown comparison operator | Use >, <, =, cross_above, cross_below |
Saving Strategies
When you click Save, Botmarley:
- Validates the TOML content server-side.
- If valid, writes the TOML file to the
strats/directory with the strategy's UUID as the filename. - Returns a success response with the strategy ID.
- Logs the save action to the activity log.
If the strategy is new (no ID yet), a new UUID is generated. If you are editing an existing strategy, the same ID is reused and the file is overwritten.
Strategy files are stored as plain .toml files in the strats/ directory. The filename is the UUID (e.g., 6f814a05-73e8-483f-8963-aa8a4ab8e1e7.toml). You can also edit these files directly with any text editor -- Botmarley reads them from disk.
Duplicating Strategies
To duplicate a strategy:
- Go to the strategies list (
/strats). - Click the Duplicate button on the strategy you want to copy.
- Botmarley creates a copy with " (Copy)" appended to the name.
- You are redirected to the editor for the new copy.
This is useful when you want to create variations of an existing strategy (for example, testing different RSI thresholds or DCA levels).
Deleting Strategies
To delete a strategy:
- Go to the strategies list (
/strats). - Click the Delete button on the strategy you want to remove.
- The TOML file is removed from the
strats/directory. - You are redirected back to the list.
Deleting a strategy is permanent. The TOML file is removed from disk. If you think you might want the strategy later, duplicate it first or keep a backup.
Bulk Delete
You can also select multiple strategies and delete them all at once using the bulk delete feature on the strategies list page. Select the checkboxes next to the strategies you want to remove, then click the bulk delete button.
Discovering Available Pairs
When you open the backtest modal from the strategies list page, Botmarley automatically scans your downloaded market data to show you which trading pairs are available. This is based on the .arrow files in your data storage directory.
The available pairs and their date ranges are shown in the backtest form, so you can select:
- Which pair to backtest against (e.g.,
XBTUSD,ETHUSD) - Start and end dates -- pre-filled based on your actual data range
If you do not see the pair you want, you need to download its historical data first. Go to the Market Data section to download candle history from Kraken.
Actions
Actions are the building blocks of your strategy. Each action defines what the bot should do when its trigger conditions are met. A strategy can have any number of actions, and each is evaluated independently on every candle.
The Three Action Types
Botmarley supports three action types, each serving a distinct purpose in the lifecycle of a trade:
flowchart LR
    A["open_long<br/>Open new position"] --> B["buy<br/>Add to position (DCA)"]
    B --> C["sell<br/>Exit position"]

    style A fill:#22c55e,color:#fff
    style B fill:#4a9eff,color:#fff
    style C fill:#ef4444,color:#fff
open_long -- Open a New Position
The open_long action creates a new position by buying an asset. This is the entry point of any trade.
When to use: Use open_long for the initial entry into a trade. This action only fires when there is no existing open position (or when max_open_positions has not been reached).
Example:
[[actions]]
type = "open_long"
amount = "100 USDC"
average_price = false

  [[actions.triggers]]
  indicator = "rsi_14"
  operator = "<"
  target = "30"
This opens a new position worth 100 USDC when RSI(14) drops below 30.
open_long is the only action type that creates a new position. If you already have an open position and want to add more, use buy instead.
buy -- Add to an Existing Position (DCA)
The buy action adds to an already open position. This is how you implement Dollar-Cost Averaging (DCA) -- buying more when the price drops to lower your average entry price.
When to use: Use buy to add to a position that was opened by open_long. This action only fires when a position is already open.
Example:
[[actions]]
type = "buy"
amount = "200 USDC"
average_price = true

  [[actions.triggers]]
  type = "pos_price_change"
  value = "-2%"
  max_count = 1
This adds 200 USDC to the existing position when the price drops 2% from the entry price. The average_price = true flag means the entry price is recalculated (see average_price explained below). The max_count = 1 ensures this DCA level only triggers once per position.
sell -- Exit a Position
The sell action exits part or all of an open position. You can sell a percentage of your position or sell everything.
When to use: Use sell for taking profit, cutting losses (stop-loss), or any exit condition.
Example -- partial exit:
[[actions]]
type = "sell"
amount = "50%"

  [[actions.triggers]]
  indicator = "rsi_14"
  operator = ">"
  target = "50"
This sells half the position when RSI rises above 50, locking in partial profit while letting the rest ride.
Example -- full exit:
[[actions]]
type = "sell"
amount = "100%"

  [[actions.triggers]]
  type = "pos_price_change"
  value = "3%"
This sells the entire position when the price rises 3% from entry, closing the trade completely.
Amount Formats
Every action requires an amount field that specifies how much to buy or sell. Botmarley supports two formats:
Fixed Amount: "100 USDC"
A fixed dollar amount. The bot buys or sells exactly this much.
amount = "100 USDC"
When to use: For entries and DCA levels where you want predictable position sizing. Most strategies use fixed amounts for open_long and buy actions.
Supported currencies: USDC, USD, BTC, ETH, and other standard ticker symbols.
Percentage Amount: "50%"
A percentage of either the available balance (for buys) or the current position size (for sells).
amount = "50%"    # Sell half the position
amount = "100%"   # Sell the entire position
When to use:
- For sell actions:
"50%"means sell half your position;"100%"means exit completely. - For buy actions:
"50%"means use 50% of available balance.
Use percentage amounts for sells and fixed amounts for buys. This gives you predictable entry sizing while allowing flexible exit sizing. For example, selling "50%" first and then "100%" of the remainder lets you scale out of a position as the price rises.
Amount Format Rules
| Format | Example | Valid For | Description |
|---|---|---|---|
| Fixed | "100 USDC" | open_long, buy | Buy exactly 100 USDC worth |
| Fixed | "0.01 BTC" | open_long, buy | Buy exactly 0.01 BTC |
| Percentage | "50%" | buy, sell | 50% of balance or position |
| Percentage | "100%" | sell | Sell the entire position |
Negative amounts are not allowed. The amount must be a positive number. Use the action type (sell) to indicate selling, not a negative amount.
average_price Explained
The average_price flag controls whether the bot recalculates the position's entry price after a buy or open_long action. This is the core mechanism behind Dollar-Cost Averaging (DCA).
How It Works
When average_price = true and the bot buys more of an asset, the entry price is recalculated as a weighted average:
new_entry_price = (old_qty * old_price + new_qty * new_price) / (old_qty + new_qty)
Example:
- You open a position: buy 100 USDC worth of BTC at $50,000. Entry price = $50,000.
- Price drops to $48,000. A DCA
buytriggers: buy 200 USDC more at $48,000. - With
average_price = true, the new entry price becomes:- Total cost: $100 + $200 = $300
- Total BTC: 0.002 + 0.004167 = 0.006167 BTC
- New entry price: $300 / 0.006167 = $48,649
- Now the price only needs to rise to $48,649 (not $50,000) to break even.
When to Use It
| Scenario | average_price | Why |
|---|---|---|
| DCA buy on dip | true | Lower your average entry so you break even sooner |
| Adding to a winner | false | Keep the original entry price for P&L tracking |
Initial open_long | false | No previous position to average with |
All sell actions | false | Selling does not affect entry price |
The average_price flag is only meaningful for open_long and buy actions. Setting it on a sell action has no effect.
Multiple Actions: How They Work Together
A strategy typically has multiple actions -- at least one entry (open_long) and one exit (sell). Here is how they interact:
Evaluation Order
Actions are evaluated independently and in order on every candle:
flowchart TD
    A["Candle Closes"] --> B["Evaluate Action 1<br/>(open_long)"]
    B --> C["Evaluate Action 2<br/>(buy / DCA level 1)"]
    C --> D["Evaluate Action 3<br/>(buy / DCA level 2)"]
    D --> E["Evaluate Action 4<br/>(sell / take profit)"]
    E --> F["Evaluate Action 5<br/>(sell / stop loss)"]

    style A fill:#4a9eff,color:#fff
Key Rules
open_longonly fires when no position is open (or whenmax_open_positionsallows another).buyonly fires when a position IS open -- it has nothing to add to otherwise.sellonly fires when a position IS open -- you cannot sell what you do not have.- Multiple sell actions can coexist -- you might have a take-profit sell at +3% AND a stop-loss sell at -8%. Whichever condition is met first will fire.
- After a 100% sell, the position is closed -- subsequent
buytriggers will not fire untilopen_longcreates a new position.
Typical Action Structure
Most strategies follow this pattern:
# 1. Entry
[[actions]]
type = "open_long"
amount = "100 USDC"
# ... entry triggers ...

# 2. DCA Level 1 (optional)
[[actions]]
type = "buy"
amount = "200 USDC"
average_price = true
# ... dip trigger ...

# 3. DCA Level 2 (optional)
[[actions]]
type = "buy"
amount = "300 USDC"
average_price = true
# ... deeper dip trigger ...

# 4. Take Profit
[[actions]]
type = "sell"
amount = "100%"
# ... profit trigger ...

# 5. Stop Loss
[[actions]]
type = "sell"
amount = "100%"
# ... loss trigger ...
You can have multiple sell actions with different conditions. For example, sell 50% at +2% profit and the remaining 100% at +5% profit. This lets you scale out of a position gradually.
Triggers Overview
Triggers are the decision engine of every Botmarley strategy. An action (buy, sell, open position) only executes when its triggers say "go." Without triggers, an action would never fire. Without the right triggers, your strategy would trade at the wrong time.
Think of it this way:
- An action answers what to do (buy 100 USDC, sell 50%, open a long position).
- A trigger answers when to do it (RSI dropped below 30, price fell 3% from entry, the 4h candle just closed).
Every action has one or more triggers attached to it. When all of them are satisfied at the same moment, the action fires.
The Three Trigger Types
Botmarley supports three categories of triggers. Each watches a different kind of market signal:
| Type | What It Watches | Example |
|---|---|---|
| Technical | Indicator values and crossovers | RSI(14) drops below 30, SMA(50) crosses above SMA(200) |
| PriceChange | Price movement, position P&L, time, momentum | Price dropped 3% in the last hour, position is up 2% from entry |
| NextCandle | Candle close events | The 4h candle just closed, the daily candle just closed |
You will often combine these types on the same action. For example, "buy when the 4h candle closes AND RSI is below 35" uses a NextCandle trigger together with a Technical trigger.
The dedicated chapters cover each type in depth:
- Technical Indicators -- indicator comparisons and crossovers
- Price Change -- price movement, P&L tracking, trailing stops, time exits
- Next Candle -- scheduled candle-close events
AND Logic: Multiple Triggers on One Action
When you attach multiple triggers to a single action, Botmarley treats them as AND conditions. Every trigger must be true simultaneously for the action to fire.
graph LR
    T1["Trigger 1<br/>RSI(14) < 30"]
    T2["Trigger 2<br/>SMA(50) > SMA(200)"]
    T3["Trigger 3<br/>Price fell -3%"]
    AND{{"ALL must<br/>be true"}}
    A["Action fires:<br/>Buy 100 USDC"]

    T1 --> AND
    T2 --> AND
    T3 --> AND
    AND --> A
In TOML, this looks like multiple [[actions.triggers]] blocks under the same [[actions]]:
# This action requires ALL THREE triggers to be true
[[actions]]
type = "open_long"
amount = "100 USDC"

[[actions.triggers]]
indicator = "rsi_14"
operator = "<"
target = "30"
timeframe = "1h"

[[actions.triggers]]
indicator = "sma_50"
operator = ">"
target = "sma_200"
timeframe = "1d"

[[actions.triggers]]
type = "price_change"
value = "-3%"
timeframe = "1h"
There is no OR logic within a single action. If you want "buy when RSI < 30 OR price drops 5%," create two separate actions -- one with the RSI trigger, one with the price drop trigger. Each action fires independently.
The max_count Field
Every trigger type supports an optional max_count field. It limits how many times that trigger can fire per position.
[[actions.triggers]]
type = "pos_price_change"
value = "-2%"
max_count = 1
max_count value | Behavior |
|---|---|
Not set (or None) | Trigger can fire unlimited times per position |
1 | Trigger fires once per position, then is disabled for that position |
3 | Trigger fires up to 3 times per position |
This is essential for DCA (Dollar-Cost Averaging) strategies where you want layered entries. Without max_count, a DCA trigger at -2% would keep firing every time the price bounces back and forth across the -2% threshold. With max_count = 1, it fires once, and you rely on the next DCA level (-4%, -6%) to add more capital.
A common pattern is to set max_count = 1 on each DCA level so each level fires exactly once per position. This prevents accidental double-buying at the same price level.
How Triggers Reset
Trigger fire counts reset when a new position opens. If a trigger on a DCA action has max_count = 1 and it fires once during Position A, that counter goes back to zero when Position A is closed and Position B is opened later.
The lifecycle looks like this:
graph TD
    A["Position opens"] --> B["Triggers active<br/>fire counts = 0"]
    B --> C{"Trigger<br/>conditions met?"}
    C -- "Yes" --> D["Action fires<br/>fire count += 1"]
    D --> E{"fire count<br/>< max_count?"}
    E -- "Yes" --> C
    E -- "No (or max_count reached)" --> F["Trigger disabled<br/>for this position"]
    C -- "No" --> G["Wait for<br/>next evaluation"]
    G --> C
    F --> H["Position closes"]
    H --> I["All fire counts<br/>reset to 0"]
    I --> A
max_count is tracked per trigger, per position. If you have two separate actions each with their own -2% trigger and max_count = 1, each of them fires independently -- you would get two buys at the -2% level. Make sure your DCA levels are on separate actions with distinct thresholds.
Putting It All Together
Here is a minimal strategy that demonstrates all three trigger types working together:
[meta]
name = "Triggers Overview Demo"
description = "Shows all three trigger types in one strategy"
max_open_positions = 2

# ENTRY: open when RSI is oversold (Technical)
[[actions]]
type = "open_long"
amount = "100 USDC"

[[actions.triggers]]
indicator = "rsi_14"
operator = "<"
target = "30"
timeframe = "1h"

# DCA: buy more if position drops 3% (PriceChange)
[[actions]]
type = "buy"
amount = "100 USDC"
average_price = true

[[actions.triggers]]
type = "pos_price_change"
value = "-3%"
max_count = 1

# ACCUMULATE: buy on every 4h candle close (NextCandle)
[[actions]]
type = "buy"
amount = "25 USDC"
average_price = true

[[actions.triggers]]
type = "next_candle"
timeframe = "4h"
max_count = 5

# EXIT: sell when position is up 2% (PriceChange)
[[actions]]
type = "sell"
amount = "100%"

[[actions.triggers]]
type = "pos_price_change"
value = "2%"
This strategy opens a position when RSI dips, adds to it on dips and on a schedule, and exits at +2% profit. The max_count values prevent runaway accumulation: the DCA fires once, and the scheduled buys stop after 5 candles.
Continue reading the dedicated chapters for each trigger type to learn all the available fields and see more examples.
Technical Indicator Triggers
Technical triggers compare an indicator's current value against a target. They answer questions like "is RSI below 30?", "did the 50-day SMA just cross above the 200-day SMA?", or "is price above the upper Bollinger Band?"
These are the most common triggers in any strategy. If you have used TradingView alerts or any charting tool, you will recognize the logic immediately.
Anatomy of a Technical Trigger
A technical trigger has four fields:
[[actions.triggers]]
indicator = "rsi_14"        # What to measure
operator = "<"              # How to compare
target = "30"               # What to compare against
timeframe = "1h"            # On which candle timeframe (optional)
max_count = 1               # How many times it can fire per position (optional)
| Field | Required | Description |
|---|---|---|
indicator | Yes | The indicator to read. Format: type_period (e.g., rsi_14, sma_50, ema_200) or a special name (bb_lower, macd_line, price, ttm_trend). |
operator | Yes | How to compare the indicator to the target. One of: >, <, =, cross_above, cross_below. |
target | Yes | The value to compare against. Either a number ("30", "0", "-3") or another indicator ("sma_200", "bb_upper", "price"). |
timeframe | No | Which candle timeframe to evaluate on: 1m, 5m, 15m, 1h, 4h, 1d. If omitted, uses the session's default timeframe. |
max_count | No | Maximum number of times this trigger can fire per position. Omit for unlimited. |
Available Indicators
All of these can be used in the indicator field or as a target:
| Indicator | Format | Example | Description |
|---|---|---|---|
| SMA | sma_{period} | sma_50, sma_200 | Simple Moving Average |
| EMA | ema_{period} | ema_9, ema_21, ema_200 | Exponential Moving Average |
| RSI | rsi_{period} | rsi_14, rsi_7 | Relative Strength Index (0-100) |
| Bollinger Bands | bb_{band} | bb_lower, bb_upper, bb_middle | Bollinger Band levels |
| MACD | macd_{component} | macd_line, macd_signal, macd_histogram | MACD components |
| StochRSI | stoch_rsi_{period} | stoch_rsi_14 | Stochastic RSI (0-100) |
| ROC | roc_{period} | roc_10 | Rate of Change (%) |
| ATR | atr_{period} | atr_14 | Average True Range |
| OBV | obv | obv | On-Balance Volume (no period) |
| OBV SMA | obv_sma_{period} | obv_sma_20 | SMA of On-Balance Volume |
| Volume SMA | vol_sma_{period} | vol_sma_20 | SMA of Volume |
| TTM Trend | ttm_trend | ttm_trend | TTM Squeeze trend (1 = bullish, -1 = bearish) |
| Price | price | price | Current market price (close) |
Operators Explained
> (Greater Than) and < (Less Than)
Simple threshold comparisons. The trigger is true whenever the indicator is above or below the target value.
# True whenever RSI(14) is below 30
[[actions.triggers]]
indicator = "rsi_14"
operator = "<"
target = "30"
These fire on every candle where the condition is true, not just the moment it crosses the threshold. If RSI stays below 30 for ten candles, the trigger is "active" on all ten. (Use max_count if you only want it to fire once.)
cross_above and cross_below (Crossover Detection)
A crossover trigger fires at the moment of transition. It checks two consecutive candles:
cross_above: The indicator was at or below the target on the previous candle, and is above it on the current candle.cross_below: The indicator was at or above the target on the previous candle, and is below it on the current candle.
graph LR
    subgraph "cross_above"
        P1["Previous candle:<br/>SMA(50) <= SMA(200)"]
        C1["Current candle:<br/>SMA(50) > SMA(200)"]
        P1 -->|"transition"| C1
    end
    subgraph "cross_below"
        P2["Previous candle:<br/>SMA(50) >= SMA(200)"]
        C2["Current candle:<br/>SMA(50) < SMA(200)"]
        P2 -->|"transition"| C2
    end
# Golden cross: SMA(50) crosses above SMA(200)
[[actions.triggers]]
indicator = "sma_50"
operator = "cross_above"
target = "sma_200"
timeframe = "1d"
Use cross_above and cross_below instead of > and < when you want to catch the turning point rather than the sustained condition. A golden cross (sma_50 cross_above sma_200) fires once when the trend shifts bullish, rather than on every single candle where SMA(50) happens to be above SMA(200).
= (Equal)
Exact match comparison. This is rarely used because indicator values are continuous floating-point numbers and exact equality is unlikely. The primary use case is the TTM Trend indicator, which outputs discrete integer values:
1= bullish trend-1= bearish trend
# TTM Trend is bullish
[[actions.triggers]]
indicator = "ttm_trend"
operator = "="
target = "1"
Do not use = with floating-point indicators like RSI or SMA. A condition like rsi_14 = 30 will almost never be exactly true because RSI values are typically decimals like 29.87 or 30.12. Use < or > instead.
Target Types
The target field accepts two kinds of values:
Numeric Target
A fixed number. Used for absolute thresholds like RSI levels, zero-line crossings, or price levels.
target = "30"      # RSI threshold
target = "0"       # MACD zero-line
target = "-3"      # Negative value (ROC dropped below -3%)
target = "50000"   # A specific price level
Indicator Target
Another indicator. Used for comparing two moving averages, checking if price is above/below a band, or volume breakout detection.
target = "sma_200"     # Compare against 200-period SMA
target = "ema_50"      # Compare against 50-period EMA
target = "bb_upper"    # Compare against upper Bollinger Band
target = "price"       # Compare indicator against current price
target = "obv_sma_20"  # Compare OBV against its SMA
target = "macd_signal" # Compare MACD line against its signal line
When using an indicator as a target, both the indicator and target are evaluated on the same candle at the same timeframe. The order matters: indicator = "sma_50" with target = "sma_200" means "is SMA(50) above/below SMA(200)?", not the other way around.
Examples
Example 1: RSI Oversold Entry
Open a position when RSI(14) drops below 30 on the 1-hour chart.
[[actions]]
type = "open_long"
amount = "100 USDC"

[[actions.triggers]]
indicator = "rsi_14"
operator = "<"
target = "30"
timeframe = "1h"
When to use: Classic mean-reversion entry. RSI below 30 suggests the asset is oversold and may bounce.
Example 2: Golden Cross (SMA 50/200)
Open a position when the daily SMA(50) crosses above SMA(200).
[[actions]]
type = "open_long"
amount = "200 USDC"

[[actions.triggers]]
indicator = "sma_50"
operator = "cross_above"
target = "sma_200"
timeframe = "1d"
When to use: Long-term trend following. The golden cross is one of the most widely watched signals in traditional finance and crypto alike.
Example 3: Death Cross Exit
Sell the entire position when SMA(50) crosses below SMA(200), signaling a trend reversal.
[[actions]]
type = "sell"
amount = "100%"

[[actions.triggers]]
indicator = "sma_50"
operator = "cross_below"
target = "sma_200"
timeframe = "1d"
When to use: As a safety exit. Even if your take-profit has not been reached, a death cross suggests the uptrend is over.
Example 4: Bollinger Band Bounce
Open a position when price drops below the lower Bollinger Band on the 1-hour chart (and RSI confirms oversold conditions on the daily chart).
[[actions]]
type = "open_long"
amount = "100 USDC"

[[actions.triggers]]
indicator = "bb_lower"
operator = ">"
target = "price"
timeframe = "1h"

[[actions.triggers]]
indicator = "rsi_14"
operator = "<"
target = "40"
timeframe = "1d"
When to use: Volatility-based entry. When price punches below the lower band, it has moved more than two standard deviations from the mean. Combining with RSI filters out false signals during strong downtrends.
Notice the operator direction: bb_lower > price means "the lower band is above the current price," which is the same as saying "price is below the lower band." Botmarley always reads left-to-right: indicator operator target.
Example 5: MACD Zero-Line Crossover
Buy when the MACD line crosses above zero, confirming bullish momentum.
[[actions]]
type = "open_long"
amount = "100 USDC"

[[actions.triggers]]
indicator = "macd_line"
operator = "cross_above"
target = "0"
timeframe = "4h"
When to use: Momentum confirmation. The MACD crossing above zero means the short-term EMA has moved above the long-term EMA, confirming upward momentum.
Example 6: TTM Trend Filter with RSI
Only enter when RSI is oversold AND the TTM Trend confirms bullish direction.
[[actions]]
type = "open_long"
amount = "100 USDC"

[[actions.triggers]]
indicator = "rsi_14"
operator = "<"
target = "35"

[[actions.triggers]]
indicator = "ttm_trend"
operator = "="
target = "1"
When to use: Filtered entries. RSI alone can give false signals in a strong downtrend. Adding TTM Trend = 1 ensures you only buy dips during an overall uptrend.
Example 7: EMA Crossover (Fast over Slow)
Enter when EMA(9) crosses above EMA(21) on the 5-minute chart for short-term scalping.
[[actions]]
type = "open_long"
amount = "50 USDC"

[[actions.triggers]]
indicator = "ema_9"
operator = "cross_above"
target = "ema_21"
timeframe = "5m"
When to use: Short-term momentum trading. Faster EMA pairs (9/21, 12/26) react more quickly than SMA pairs, making them suitable for scalping on lower timeframes.
Example 8: Uptrend Filter (SMA 50 Above SMA 200)
Use as a guard condition on another action. Only allow entries while the macro trend is bullish.
[[actions]]
type = "open_long"
amount = "100 USDC"

[[actions.triggers]]
indicator = "sma_50"
operator = ">"
target = "sma_200"
timeframe = "1d"

[[actions.triggers]]
indicator = "rsi_14"
operator = "<"
target = "35"
timeframe = "1h"
When to use: Multi-timeframe filtering. The daily SMA check acts as a macro trend gate (only buy in uptrends), while the hourly RSI finds dip entries within that uptrend. This is the foundation of the "trend-safe DCA" pattern.
Timeframe Considerations
When you set a timeframe on a technical trigger, Botmarley evaluates the indicator on candles of that timeframe. A few things to keep in mind:
- If you omit
timeframe, the trigger uses the trading session's default timeframe. - You can mix timeframes on the same action. For example, one trigger checks the daily SMA while another checks the hourly RSI. Both must be true for the action to fire.
- Valid timeframes are:
1m,5m,15m,1h,4h,1d. - Lower timeframes (1m, 5m) produce more signals but are noisier. Higher timeframes (4h, 1d) produce fewer signals but are more reliable.
A powerful pattern is to use a higher timeframe for trend direction (daily SMA or TTM Trend) and a lower timeframe for entry timing (hourly RSI or 5-minute EMA crossover). This gives you the best of both worlds: reliable trend identification with precise entry points.
Deep-Dive: Indicators Reference
For in-depth explanations of each indicator — with annotated chart screenshots, operator behavior, and TOML examples — see the Indicators Reference and its sub-pages:
- SMA — Simple Moving Average — Golden Cross, Death Cross, trend filters
- EMA — Exponential Moving Average — Fast crossovers, scalping pairs
- RSI — Relative Strength Index — Oversold/overbought zones, recovery signals
- MACD — Crossovers, histogram, zero-line signals
- Bollinger Bands — Bounce, squeeze, mean reversion
- StochRSI, ROC, ATR, OBV, VolSMA, TTM Trend, Price
- Operators Reference — Complete guide to
>,<,=,cross_above,cross_below
Indicators Reference
Botmarley supports 27 technical indicators that you can use in strategy triggers. Each indicator has a dedicated page with in-depth explanations and TOML trigger examples.
Quick Reference Table
Classic Technical Indicators
| Indicator | Format | Period | Value Range | Description |
|---|---|---|---|---|
| SMA | sma_20 | 1-200 | price-based | Simple Moving Average |
| EMA | ema_50 | 1-200 | price-based | Exponential Moving Average |
| RSI | rsi_14 | 1-200 | 0-100 | Relative Strength Index |
| Bollinger Bands | bb_upper, bb_middle, bb_lower | fixed 20 | price-based | Volatility bands |
| MACD | macd_line, macd_signal, macd_histogram | fixed 12/26/9 | unbounded | Trend/momentum |
| StochRSI | stoch_rsi_14 | 1-200 | 0-100 | Stochastic RSI |
| ROC | roc_10 | 1-200 | unbounded | Rate of Change (%) |
| ATR | atr_14 | 1-200 | 0+ | Average True Range |
| OBV | obv | none | unbounded | On-Balance Volume |
| OBV SMA | obv_sma_20 | 1-200 | unbounded | SMA of OBV |
| VolSMA | vol_sma_20 | 1-200 | 0+ | Volume Simple Moving Average |
| TTM Trend | ttm_trend | none | -1 / 0 / 1 | Trend direction indicator |
| Price | price | none | actual | Current candle close price |
Statistical Indicators
| Indicator | Format | Period | Value Range | Description |
|---|---|---|---|---|
| RSTD | rstd_20 | 5-500 | 0+ | Rolling Standard Deviation |
| Z-Score | zscore_20 | 5-500 | -4 to +4 | Standard score (deviations from mean) |
| Percentile Rank | prank_50 | 10-500 | 0-100 | Price percentile within rolling window |
| Parkinson | parkinson_20 | 5-500 | 0+ | High-low range volatility estimator |
| Garman-Klass | gk_vol_20 | 5-500 | 0+ | OHLC-based volatility estimator |
| Yang-Zhang | yz_vol_20 | 5-500 | 0+ | Comprehensive volatility (overnight + intraday) |
| Hurst | hurst_200 | 50-500 | 0-1 | Hurst exponent (trend vs mean-reversion) |
| Half-Life | halflife_200 | 50-500 | 1+ | Mean reversion speed (candles to half-revert) |
| Vol Regime | vol_regime_100 | 20-500 | 1 / 2 / 3 | Volatility regime classifier |
| VWAP | vwap | rolling | price-based | Volume Weighted Average Price |
| VWAP Dev | vwap_dev_20 | 5-500 | unbounded | Price deviation from VWAP (in %) |
| Skewness | skew_60 | 10-500 | -3 to +3 | Return distribution asymmetry |
| Kurtosis | kurt_60 | 10-500 | -2 to +10 | Tail risk (fat vs thin tails) |
| Autocorrelation | autocorr_1 | lag 1-50 | -1 to +1 | Momentum persistence measurement |
Indicator Categories
Trend Indicators
- SMA — The classic moving average. Equal weight to all candles. Best for identifying long-term trends and support/resistance levels.
- EMA — Weighted toward recent prices. Reacts faster than SMA. Best for short-term trading and entry timing.
- TTM Trend — Simplified trend direction (1 = bullish, -1 = bearish). Great as a filter on other triggers.
Momentum Indicators
- RSI — Measures overbought/oversold conditions on a 0-100 scale. The most popular momentum indicator.
- MACD — Tracks the relationship between two EMAs. Shows both trend direction and momentum strength.
- StochRSI — More sensitive version of RSI. Catches short-term reversals.
- ROC — Percentage price change. Detects sharp dips and pumps.
- Autocorrelation — Measures momentum persistence. Positive = trends continue; near zero = random; negative = reversals likely.
Volatility Indicators
- Bollinger Bands — Dynamic envelope around price. Widens in volatility, narrows in calm. Great for mean-reversion strategies.
- ATR — Measures volatility magnitude. Use for position sizing and volatility filters.
- RSTD — Rolling standard deviation of price. The raw building block of volatility measurement.
- Parkinson — Volatility from high-low range. More efficient than close-to-close estimators.
- Garman-Klass — Volatility from full OHLC data. Even more efficient than Parkinson.
- Yang-Zhang — The most comprehensive volatility estimator. Combines overnight gaps + intraday range.
- Vol Regime — Classifies volatility into low/normal/high regimes. Self-calibrating across all assets.
Statistical / Mean-Reversion Indicators
- Z-Score — How many standard deviations from the mean. Universal thresholds across all assets. The core mean-reversion signal.
- Percentile Rank — Where current price sits in its rolling range (0-100). Great for detecting historically rare levels.
- Hurst — THE regime detector. Tells you if the market is trending, mean-reverting, or random walk.
- Half-Life — How fast price reverts to the mean (in candles). Determines if mean reversion happens fast enough to trade.
Institutional / Fair Value Indicators
- VWAP — Volume Weighted Average Price. The benchmark institutions use for fair value.
- VWAP Dev — Percentage deviation from VWAP. Measures how far price has strayed from institutional fair value.
Distribution Intelligence
- Skewness — Measures return distribution asymmetry. Positive = upside surprises likely; negative = crash risk elevated.
- Kurtosis — Measures tail fatness. Low = predictable; high = extreme moves likely. A pure risk indicator.
Volume Indicators
- OBV — Cumulative volume flow. Confirms trends and detects divergences.
- VolSMA — Average volume. Detect unusual volume spikes.
Special
- Price — Current candle close. Compare against any indicator or absolute level.
Operators
All indicators are compared using one of five operators. See the Operators Reference for the complete guide, including the critical difference between state-based operators (>, <, =) that fire on every matching candle and event-based operators (cross_above, cross_below) that fire once at the moment of crossing.
| Operator | Type | Description |
|---|---|---|
> | State-based | True whenever indicator is above target |
< | State-based | True whenever indicator is below target |
= | State-based | True when indicator equals target (use for TTM Trend only) |
cross_above | Event-based | Fires once when indicator crosses from below to above target |
cross_below | Event-based | Fires once when indicator crosses from above to below target |
Period Constraints
- Minimum period: 1
- Maximum period: 200
- Invalid period (0 or >200): validation error
Shorter periods react faster but generate more false signals. Longer periods are smoother but lag behind price. Choose based on your strategy's timeframe and risk tolerance.
SMA -- Simple Moving Average
Contents
The Simple Moving Average is the most fundamental technical indicator in trading. It calculates the arithmetic mean of the last N closing prices, giving equal weight to every candle in the window. If you set the period to 50, the SMA takes the last 50 closing prices, adds them up, and divides by 50. Each new candle drops the oldest price and adds the newest.
Because every candle carries the same weight, SMA is a smooth, stable line that filters out short-term noise. The trade-off is lag -- SMA reacts slowly to sudden price changes because old prices influence the average just as much as the most recent one.
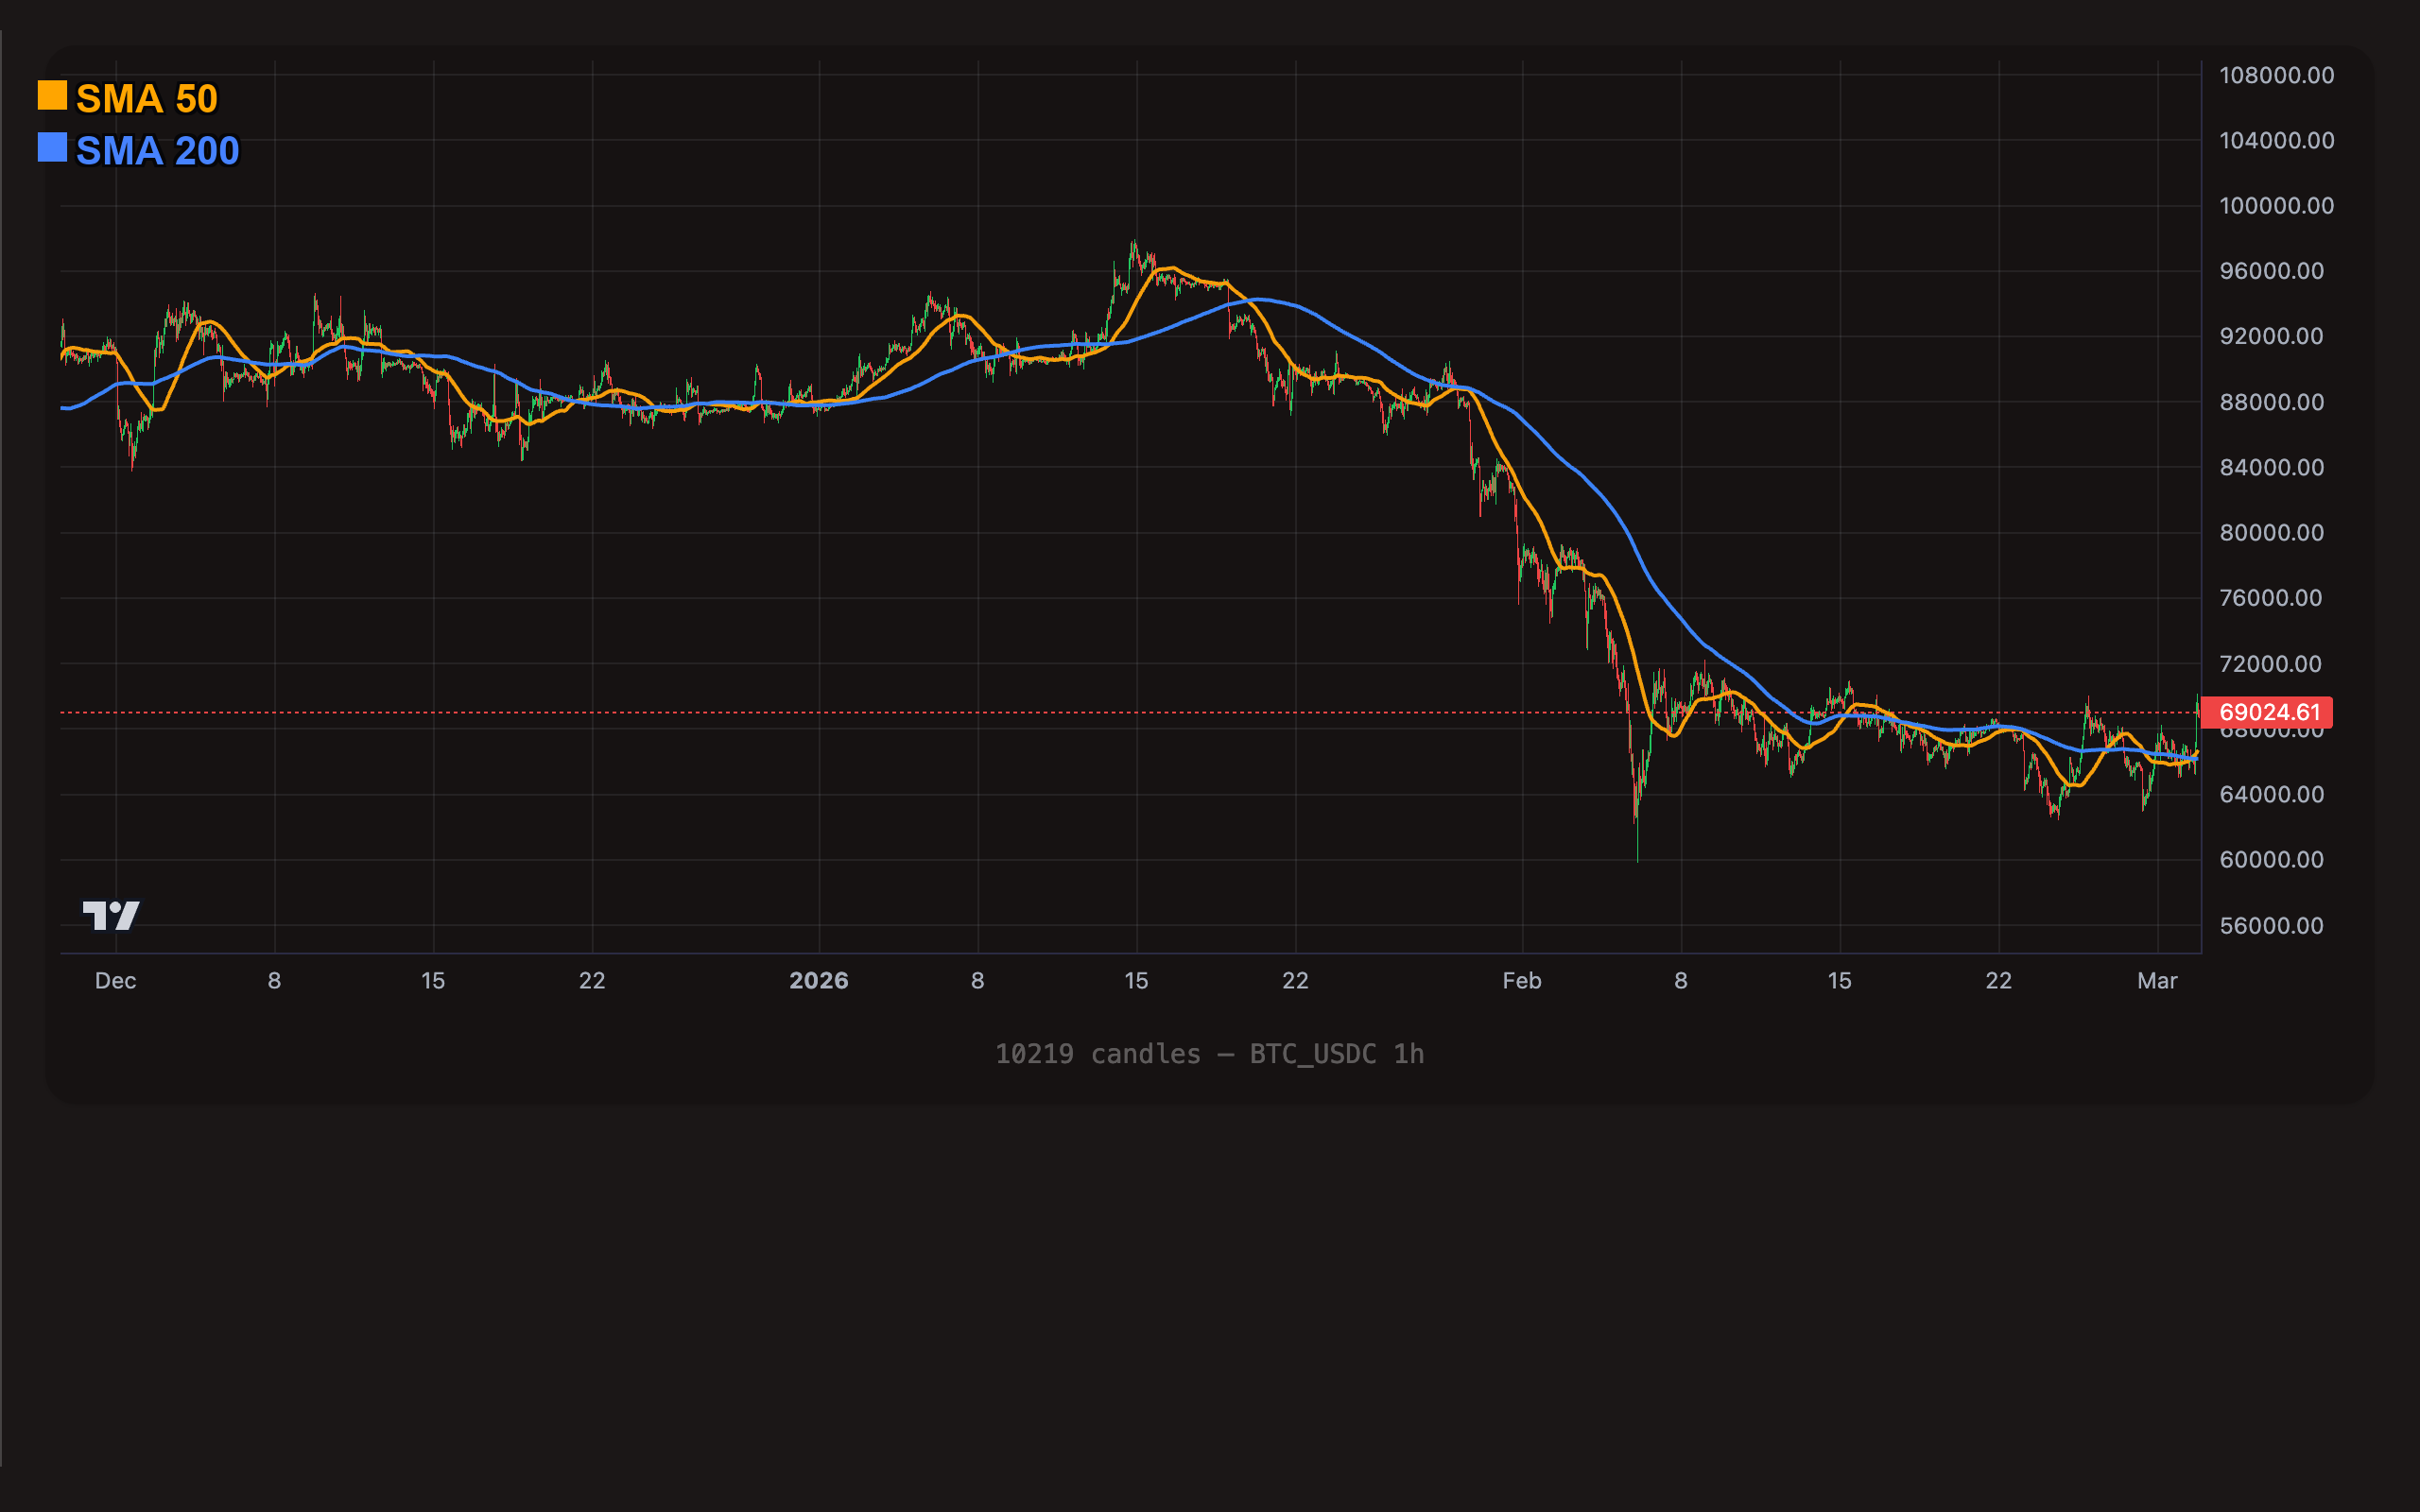
BTC/USDC 1-hour chart with SMA(50) (orange) and SMA(200) (blue). The faster SMA(50) reacts more quickly to price changes while the slower SMA(200) shows the long-term trend.
Format
sma_{period}
The period must be an integer between 1 and 200.
Examples:
| TOML value | Meaning |
|---|---|
sma_20 | 20-period Simple Moving Average |
sma_50 | 50-period Simple Moving Average |
sma_200 | 200-period Simple Moving Average |
Common Periods
| Period | Style | Typical Use |
|---|---|---|
sma_20 | Short-term | Tracks recent momentum. On daily candles this covers roughly one trading month. Good for timing entries in active markets. |
sma_50 | Medium-term | The "workhorse" moving average. Widely watched by traders as a dynamic support/resistance level. A popular component of crossover strategies. |
sma_200 | Long-term | The institutional benchmark. Price above the 200-period SMA is generally considered a bull market; below it, a bear market. Often used as a macro trend filter. |
Understanding Operators with SMA
Every trigger in Botmarley compares an indicator to a target using an operator. Here is what each operator means visually on the chart when used with SMA.
> (Greater Than)
"Price is ABOVE the SMA line on the chart."
As long as the candle closes above the line, this condition is true. Think of it as "price is in bullish territory." This is a state-based operator -- it remains true on every candle where the condition holds, not just the first one.
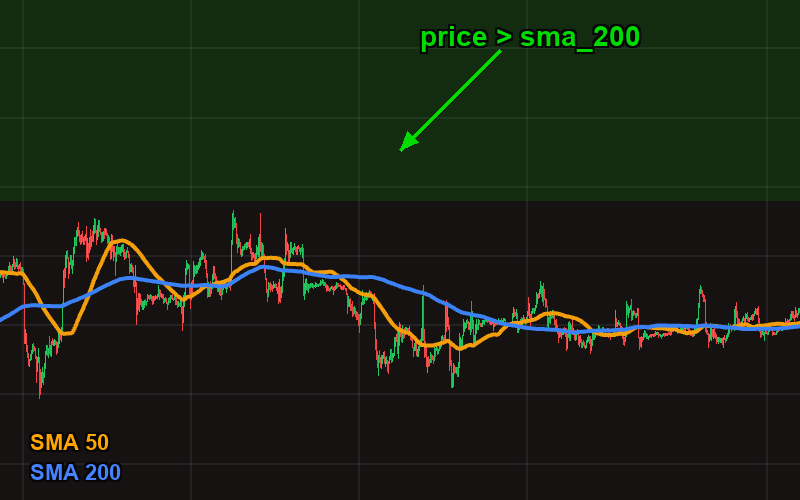
Price candles closing above the SMA(200) line. The green zone represents "bullish territory" — every candle here makes price > sma_200 true.
# True on every candle where price closes above the SMA(200)
[[actions.triggers]]
indicator = "price"
operator = ">"
target = "sma_200"
< (Less Than)
"Price is BELOW the SMA line on the chart."
The mirror image of >. When the candle closes below the SMA line, this condition is true. Think of it as "price is in bearish territory."
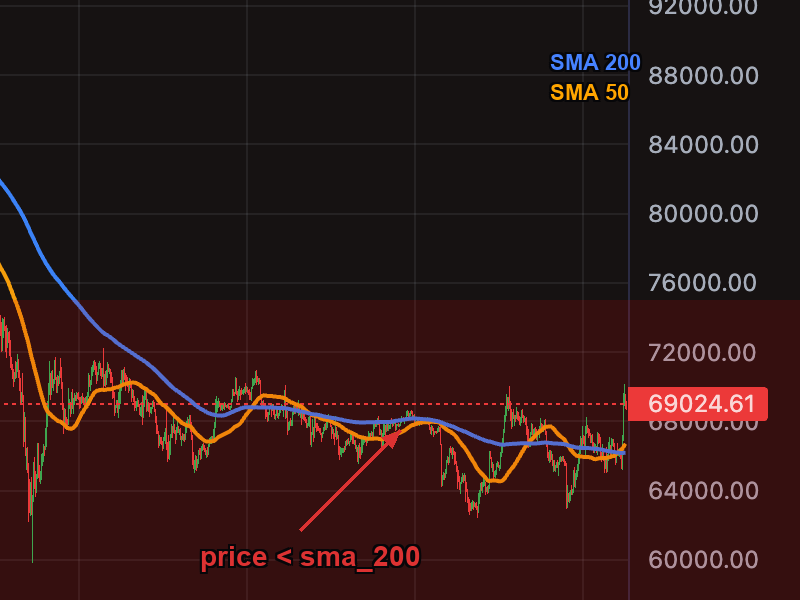
Price candles closing below the SMA(200) line. The red zone represents "bearish territory" — every candle here makes price < sma_200 true.
# True on every candle where price closes below the SMA(20)
[[actions.triggers]]
indicator = "price"
operator = "<"
target = "sma_20"
= (Equal)
Rarely useful with SMA. Since SMA values are floating-point decimals (e.g., 67,432.18), exact equality with another floating-point value almost never happens. This operator exists mainly for discrete indicators like TTM Trend. Use > or < instead when working with SMA.
cross_above
"The MOMENT the indicator line crosses from below to above the target."
On the chart, look for where two lines intersect and the indicator moves from underneath to on top. This fires once at the crossing candle, not continuously. It checks two consecutive candles: the indicator was at or below the target on the previous candle, and is above it on the current candle.
This is the famous Golden Cross when SMA(50) crosses above SMA(200) -- one of the most widely watched signals in both traditional finance and crypto.
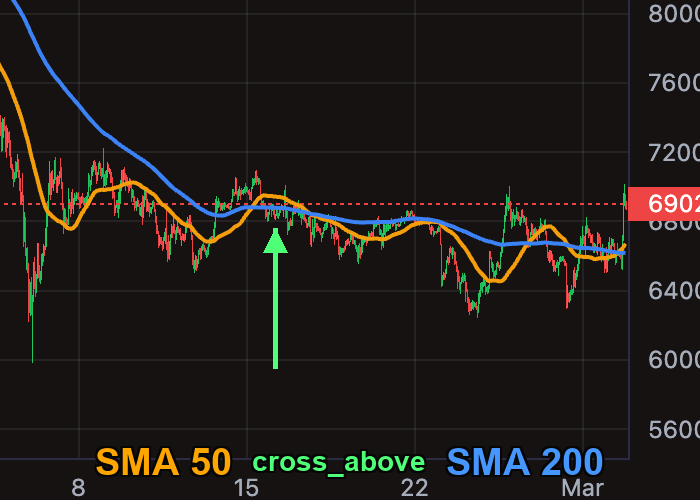
The moment SMA(50) crosses above SMA(200) — the Golden Cross. This event-based signal fires once at the crossing candle.
# Golden Cross: fires once when SMA(50) crosses above SMA(200)
[[actions.triggers]]
indicator = "sma_50"
operator = "cross_above"
target = "sma_200"
timeframe = "1d"
cross_below
"The MOMENT the indicator line crosses from above to below the target."
The opposite crossing -- from above to below. On the chart, the indicator line drops through the target line. Like cross_above, this fires once at the crossing candle.
This is the Death Cross when SMA(50) crosses below SMA(200) -- a widely watched bearish signal.
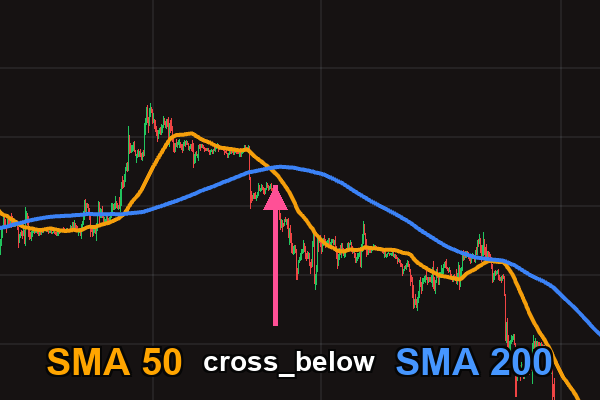
The moment SMA(50) crosses below SMA(200) — the Death Cross. The bearish mirror of the Golden Cross.
# Death Cross: fires once when SMA(50) crosses below SMA(200)
[[actions.triggers]]
indicator = "sma_50"
operator = "cross_below"
target = "sma_200"
timeframe = "1d"
cross_above and cross_below are event-based -- they fire only on the candle where the crossing happens. In contrast, > and < are state-based -- they fire on every candle where the condition holds. Choose the right operator for your strategy logic: use crossovers for entry signals, use comparisons for ongoing filters.
TOML Examples
Golden Cross Entry
Buy when the 50-period SMA crosses above the 200-period SMA on the daily chart. This is a classic long-term trend-following signal.
[[actions]]
type = "open_long"
amount = "200 USDC"

[[actions.triggers]]
indicator = "sma_50"
operator = "cross_above"
target = "sma_200"
timeframe = "1d"
Death Cross Exit
Sell the entire position when SMA(50) crosses below SMA(200). Even if your take-profit has not been reached, a death cross signals the uptrend may be over.
[[actions]]
type = "sell"
amount = "100%"

[[actions.triggers]]
indicator = "sma_50"
operator = "cross_below"
target = "sma_200"
timeframe = "1d"
Price Above SMA(200) as Trend Filter
Use the 200-period SMA as a macro trend gate. Only allow entries while price is above the long-term average. This is a state-based filter that stays active as long as the condition holds. Combined with an RSI dip on a lower timeframe, this creates the classic "trend-safe DCA" pattern.
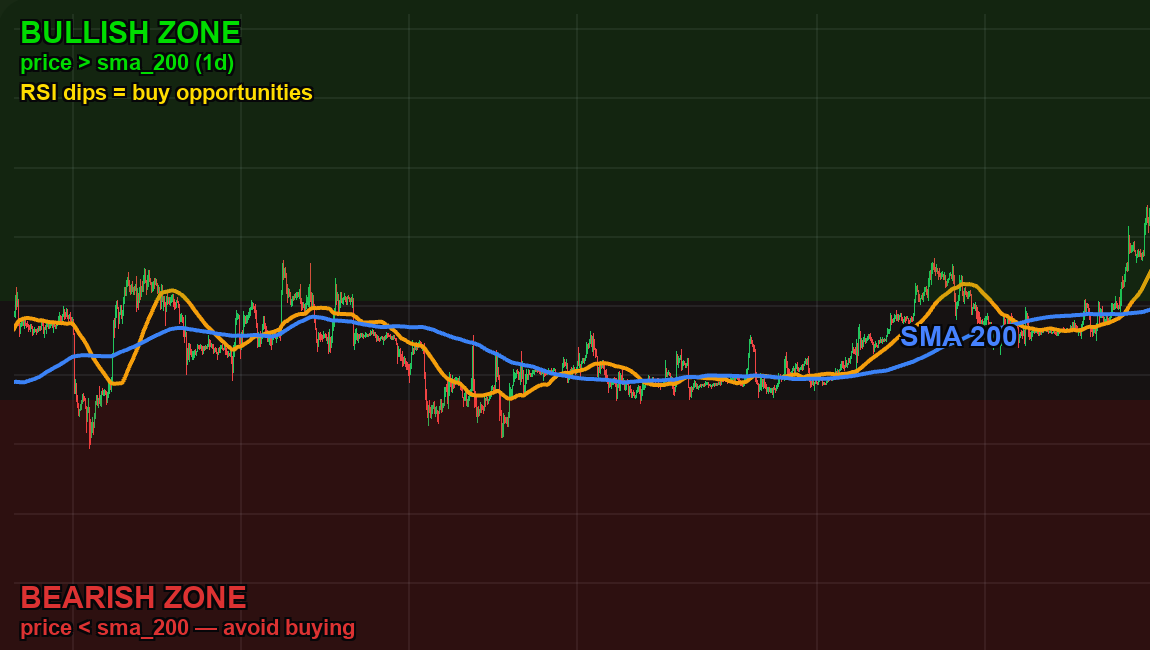
The SMA(200) divides the chart into a bullish zone (above) and a bearish zone (below). Only buy RSI dips when price is in the bullish zone. This multi-indicator, multi-timeframe pattern avoids buying into falling markets.
[[actions]]
type = "open_long"
amount = "100 USDC"

# Macro filter: only buy when price is above the 200 SMA
[[actions.triggers]]
indicator = "price"
operator = ">"
target = "sma_200"
timeframe = "1d"

# Entry signal: RSI dip on lower timeframe
[[actions.triggers]]
indicator = "rsi_14"
operator = "<"
target = "35"
timeframe = "1h"
Price Drops Below Short-Term SMA
Detect when price falls below the 50-period SMA. This can be used as an early warning or exit signal on shorter timeframes.
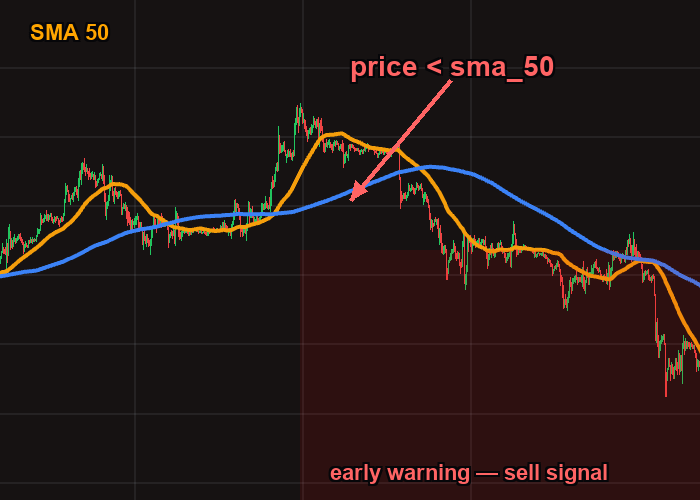
Price falling below the SMA(50) line — an early warning that the short-term trend may be weakening. This sell trigger lets you reduce exposure before a larger drop develops.
[[actions]]
type = "sell"
amount = "50%"

[[actions.triggers]]
indicator = "price"
operator = "<"
target = "sma_20"
timeframe = "4h"
Multi-SMA Trend Confirmation
Combine multiple SMA conditions. This entry requires all three SMAs to be in the correct alignment (fast above medium above slow), confirming a strong uptrend before entering.
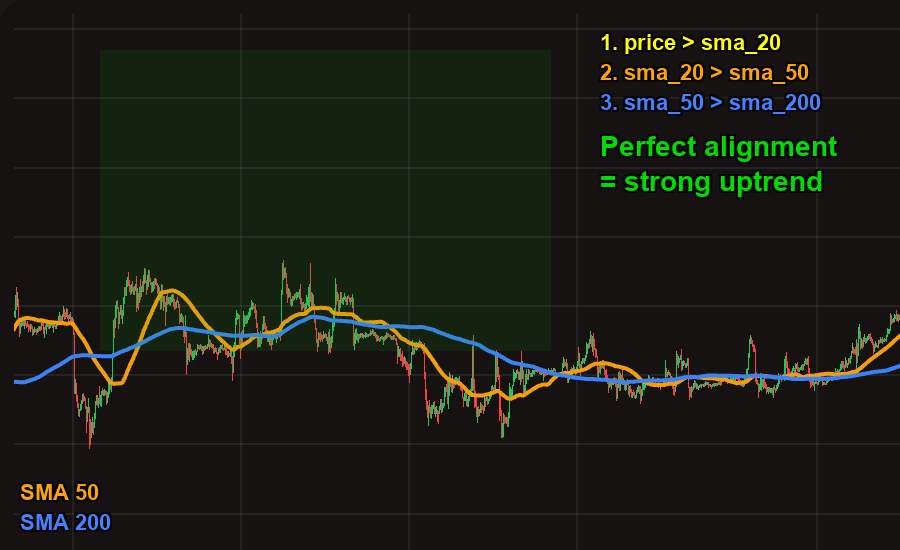
Perfect SMA alignment: price > SMA(20) > SMA(50) > SMA(200). When all three layers stack in the correct order, it confirms a strong uptrend across all timeframes.
[[actions]]
type = "open_long"
amount = "150 USDC"

# SMA(20) above SMA(50) -- short-term trend is bullish
[[actions.triggers]]
indicator = "sma_20"
operator = ">"
target = "sma_50"
timeframe = "1d"

# SMA(50) above SMA(200) -- medium-term trend is bullish
[[actions.triggers]]
indicator = "sma_50"
operator = ">"
target = "sma_200"
timeframe = "1d"

# Price above SMA(20) -- price is in the strongest zone
[[actions.triggers]]
indicator = "price"
operator = ">"
target = "sma_20"
timeframe = "1d"
Tips
SMA(20) reacts more quickly to price changes but generates more false signals. SMA(200) is very smooth and reliable but slow to respond. Match the period to your strategy's timeframe: use shorter periods for scalping on 5m/15m charts, longer periods for swing trading on 4h/1d charts.
While the Golden Cross and Death Cross are famous, relying on a single SMA crossover can produce late entries and many false signals in sideways markets. The real power of SMA is as a trend filter layered with other indicators. For example: "only buy RSI dips when price is above SMA(200)."
If you want to enter on a crossover event (one-time signal), use cross_above or cross_below. If you want to gate entries behind a trend condition that stays active as long as it holds, use > or <. Mixing them up is a common mistake -- a > trigger fires on every candle, which can cause repeated entries if you do not use max_count.
SMA gives equal weight to all candles in the window, making it smoother but slower to react. If you need faster response to price changes with less lag, consider using EMA instead. Many strategies combine both: SMA for the macro trend view and EMA for entry timing.
EMA -- Exponential Moving Average
Contents
The Exponential Moving Average is a weighted moving average that gives more weight to recent prices. Unlike SMA, which treats every candle in the window equally, EMA applies a multiplier that makes the most recent price data count more. This means EMA reacts faster to price changes, hugging the price line more closely and reducing lag.
The weighting is exponential: the most recent candle has the highest weight, the second most recent has slightly less, and so on -- with the influence of older candles decaying smoothly rather than dropping off a cliff. The formula uses a smoothing factor of 2 / (period + 1), so a 9-period EMA gives roughly 20% weight to the latest candle, while a 50-period EMA gives roughly 4%.
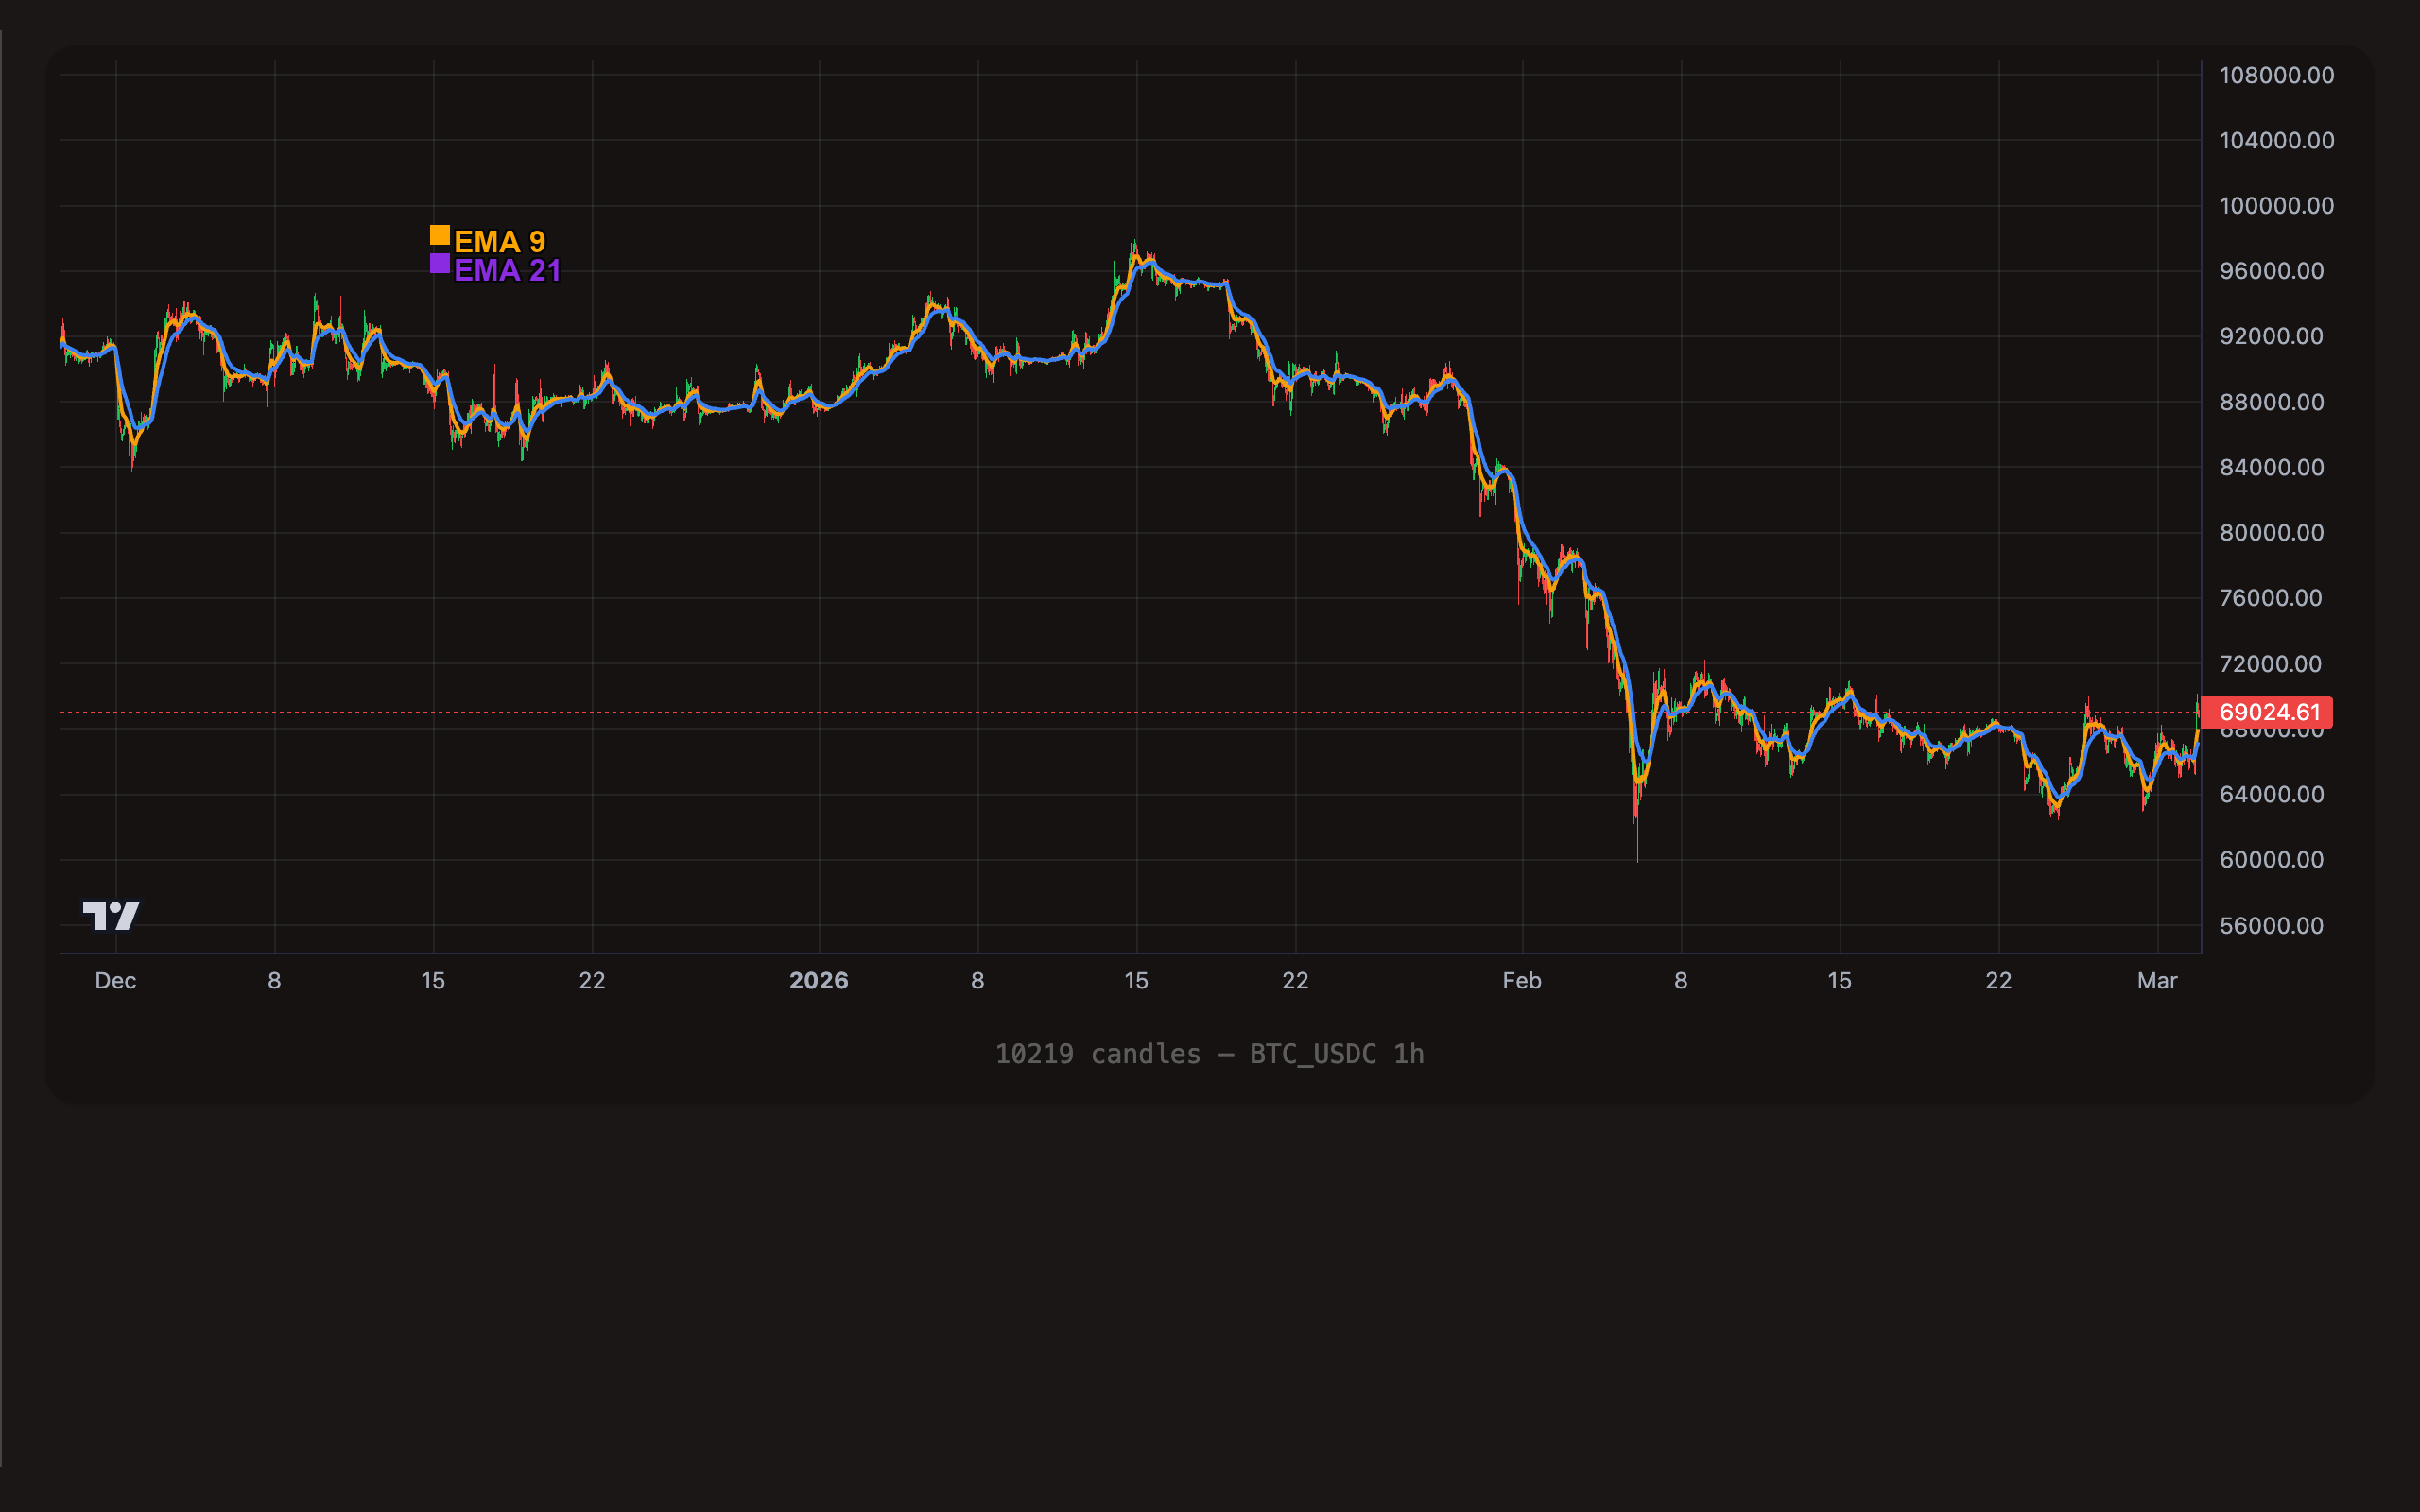
BTC/USDC 1-hour chart with EMA(9) (orange) and EMA(21) (purple). The fast EMA(9) hugs price more closely and generates more frequent crossover signals than SMA pairs.
Format
ema_{period}
The period must be an integer between 1 and 200.
Examples:
| TOML value | Meaning |
|---|---|
ema_9 | 9-period Exponential Moving Average |
ema_12 | 12-period EMA (classic MACD fast line) |
ema_21 | 21-period EMA (popular scalping pair) |
ema_26 | 26-period EMA (classic MACD slow line) |
ema_50 | 50-period EMA (medium-term trend) |
SMA vs EMA -- When to Use Each
Both SMA and EMA smooth price data to identify trends, but they behave differently in practice.
| Characteristic | SMA | EMA |
|---|---|---|
| Weighting | Equal weight to all candles | More weight to recent candles |
| Lag | Higher -- slow to react | Lower -- reacts faster to new data |
| Smoothness | Smoother, fewer whipsaws | More responsive, can be choppier |
| False signals | Fewer, but entries may be late | More frequent, but catches moves earlier |
| Best for | Macro trend filters (daily/weekly) | Entry timing, scalping, short timeframes |
| Classic pairs | SMA(50)/SMA(200) -- Golden/Death Cross | EMA(9)/EMA(21), EMA(12)/EMA(26) |
Rule of thumb: Use SMA when you want a stable, macro view of the trend (is the market bullish or bearish over weeks/months?). Use EMA when you want to time entries and exits more precisely, especially on shorter timeframes where speed matters.
Many strategies combine both: an SMA(200) as a macro trend gate with EMA crossovers for entry timing within that trend.
Understanding Operators with EMA
The operators work identically to SMA, but because EMA reacts faster, crossover signals happen earlier and more frequently than with equivalent SMA periods.
> (Greater Than)
"Price is ABOVE the EMA line on the chart."
A state-based check that remains true on every candle where the condition holds. Since EMA tracks price more closely than SMA, the line stays nearer to the candle bodies and acts as tighter dynamic support.
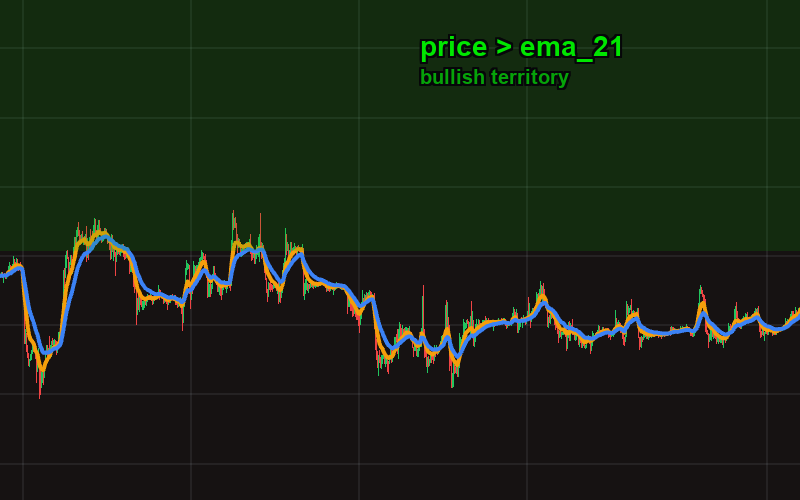
Price candles closing above the EMA(21) line. The green zone represents "bullish territory" — every candle here makes price > ema_21 true.
# True on every candle where price closes above EMA(21)
[[actions.triggers]]
indicator = "price"
operator = ">"
target = "ema_21"
< (Less Than)
"Price is BELOW the EMA line on the chart."
The bearish mirror. Because EMA is more responsive, price falling below a short-period EMA is a faster warning signal than falling below the same-period SMA.
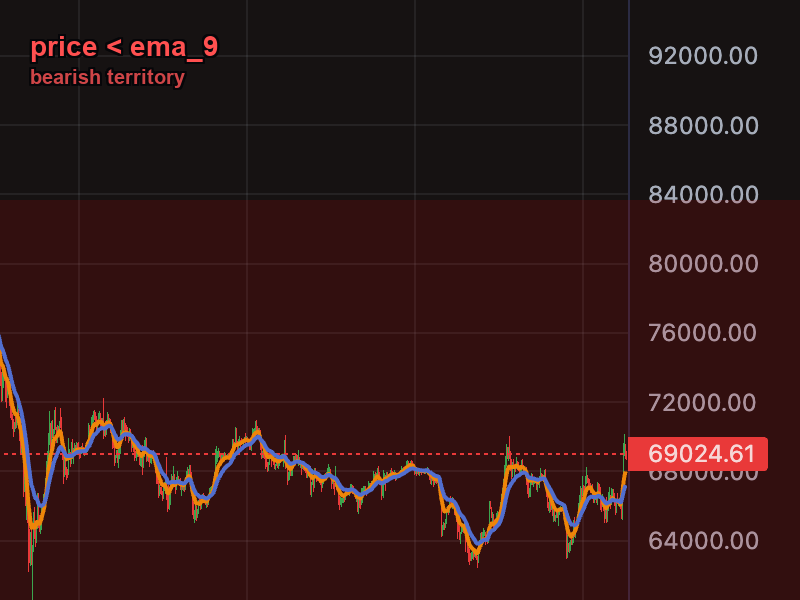
Price candles closing below the EMA(9) line. The red zone represents "bearish territory" — an early warning that momentum is fading.
# Price has dropped below the fast EMA -- early warning
[[actions.triggers]]
indicator = "price"
operator = "<"
target = "ema_9"
timeframe = "1h"
= (Equal)
Rarely useful with EMA. Like SMA, EMA values are floating-point decimals, and exact equality almost never occurs. Use > or < instead.
cross_above
"The MOMENT the fast EMA line crosses from below to above the slow EMA (or target)."
Because EMA reacts faster, crossovers happen sooner than with SMA. An EMA(9)/EMA(21) crossover catches trend shifts earlier than an SMA(50)/SMA(200) crossover -- but also produces more false signals in choppy, sideways markets.
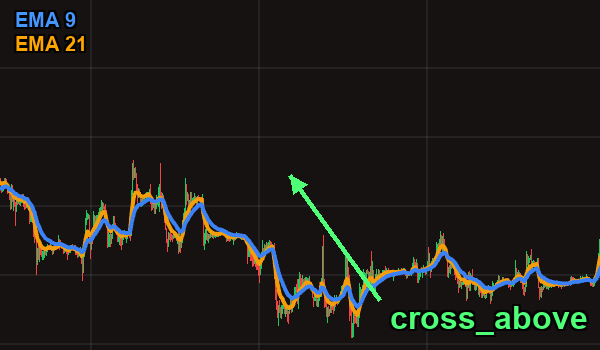
EMA(9) crosses above EMA(21) — a bullish momentum shift. Notice how EMA crossovers happen earlier and more frequently than SMA crossovers.
# Fast EMA crosses above slow EMA -- bullish momentum shift
[[actions.triggers]]
indicator = "ema_9"
operator = "cross_above"
target = "ema_21"
timeframe = "1h"
cross_below
"The MOMENT the fast EMA line crosses from above to below the target."
The bearish crossover. With short-period EMAs this can fire multiple times in a ranging market, so consider adding a trend filter or max_count to prevent repeated signals.
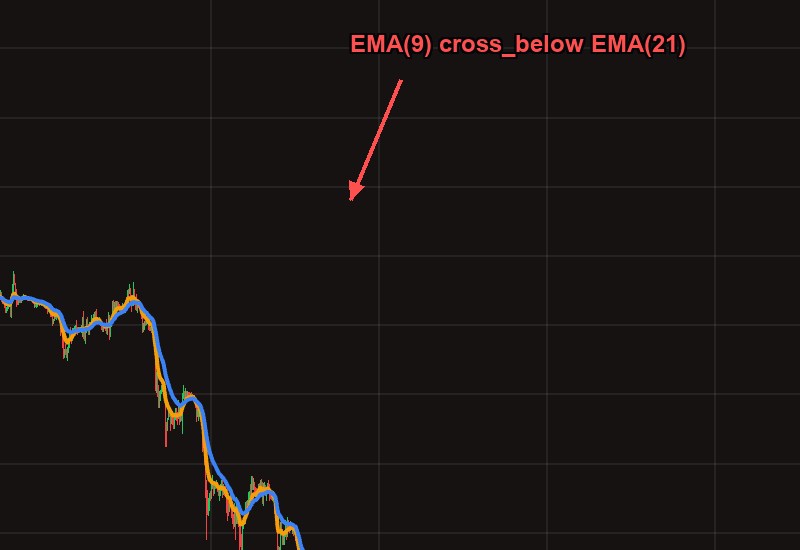
EMA(9) crosses below EMA(21) — a bearish momentum shift. The fast EMA dropping below the slow EMA signals that short-term momentum has turned negative.
# Fast EMA crosses below slow EMA -- bearish momentum shift
[[actions.triggers]]
indicator = "ema_9"
operator = "cross_below"
target = "ema_21"
timeframe = "1h"
Short-period EMA crossovers (like 9/21) are fast but noisy. In a sideways market, the two EMA lines can weave back and forth, generating multiple false crossover signals. Always consider pairing EMA crossovers with a trend filter (such as price > sma_200 or ttm_trend = 1) to avoid whipsaws.
TOML Examples
EMA Crossover Scalping
Enter when the 9-period EMA crosses above the 21-period EMA on the 5-minute chart. This is a classic short-term momentum entry for scalping strategies.
[[actions]]
type = "open_long"
amount = "50 USDC"

[[actions.triggers]]
indicator = "ema_9"
operator = "cross_above"
target = "ema_21"
timeframe = "5m"
EMA Crossover Exit
Close the position when the fast EMA crosses back below the slow EMA, signaling momentum has reversed.
[[actions]]
type = "sell"
amount = "100%"

[[actions.triggers]]
indicator = "ema_9"
operator = "cross_below"
target = "ema_21"
timeframe = "5m"
EMA as Dynamic Support
Use the 21-period EMA as a dynamic support level. If price drops below it on the 1-hour chart, reduce your position as a precaution.
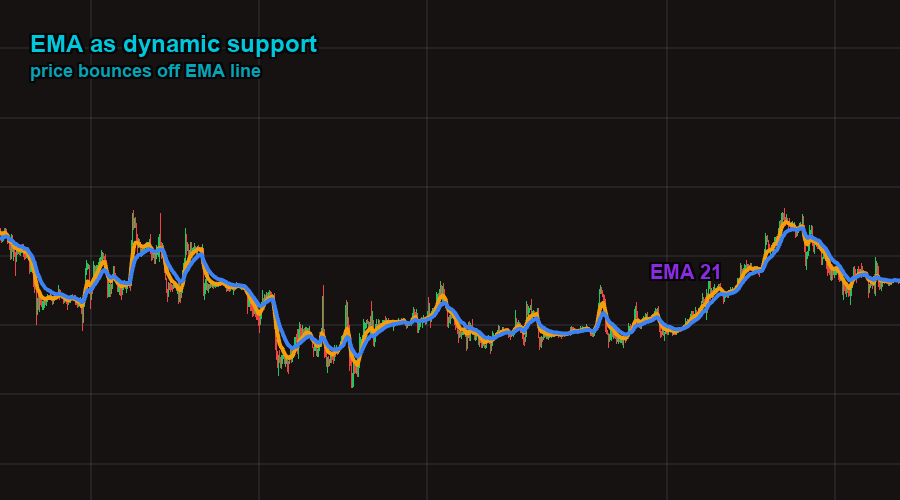
The EMA(21) acts as a dynamic support level. Price repeatedly bounces off this line during an uptrend. When it finally breaks below, it can signal a trend weakening.
[[actions]]
type = "sell"
amount = "25%"

[[actions.triggers]]
indicator = "price"
operator = "<"
target = "ema_21"
timeframe = "1h"
max_count = 1
Trend-Filtered EMA Entry
Combine a macro SMA trend filter with a fast EMA crossover for entry timing. This only buys EMA crossovers when the overall market is in an uptrend.
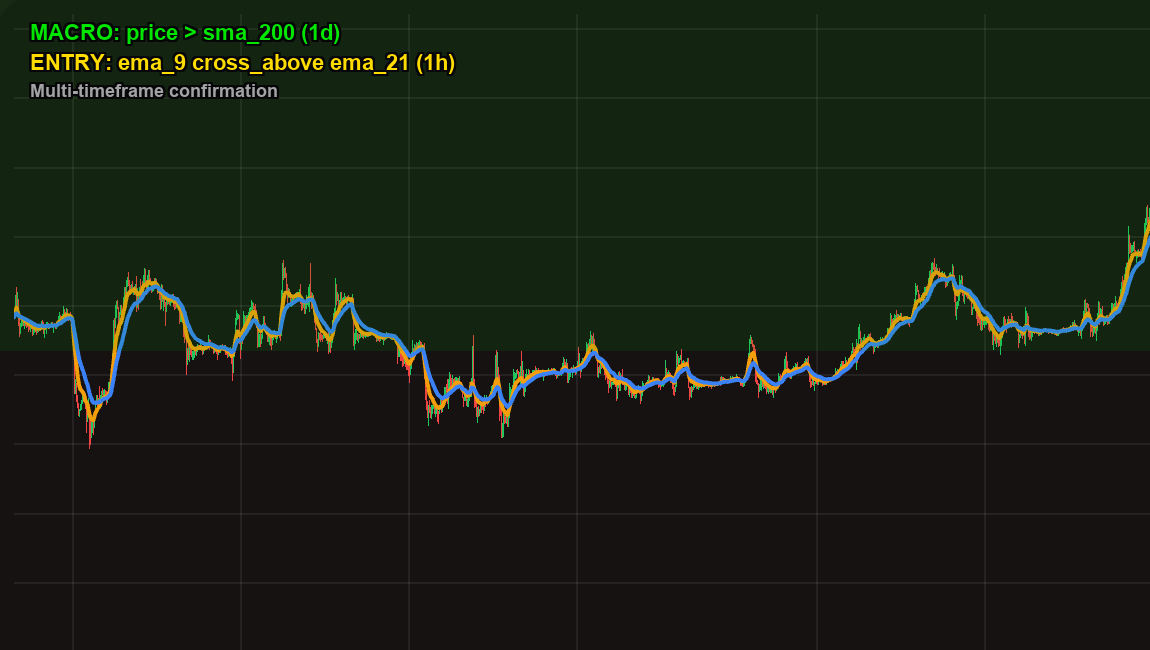
Multi-timeframe confirmation: the daily SMA(200) confirms the macro uptrend (green zone), while the hourly EMA(9)/EMA(21) crossover provides the precise entry timing. This pattern avoids buying EMA crossovers in bear markets.
[[actions]]
type = "open_long"
amount = "100 USDC"

# Macro filter: only trade in confirmed uptrend
[[actions.triggers]]
indicator = "price"
operator = ">"
target = "sma_200"
timeframe = "1d"

# Entry signal: fast EMA crossover on lower timeframe
[[actions.triggers]]
indicator = "ema_9"
operator = "cross_above"
target = "ema_21"
timeframe = "1h"
EMA + RSI Confluence Entry
Wait for the EMA crossover AND RSI to confirm oversold conditions before entering. Multiple confirmations reduce false signals.
[[actions]]
type = "open_long"
amount = "100 USDC"

# Momentum shift: EMA crossover
[[actions.triggers]]
indicator = "ema_12"
operator = "cross_above"
target = "ema_26"
timeframe = "1h"

# Confirmation: RSI was recently in oversold territory
[[actions.triggers]]
indicator = "rsi_14"
operator = "<"
target = "40"
timeframe = "1h"
Classic MACD-Style Crossover
The MACD indicator is built from EMA(12) and EMA(26). You can replicate MACD-like signals directly with EMA crossovers, giving you visual confirmation on the price chart itself rather than a separate oscillator panel.
[[actions]]
type = "open_long"
amount = "150 USDC"

# This is equivalent to watching the MACD line cross above zero
[[actions.triggers]]
indicator = "ema_12"
operator = "cross_above"
target = "ema_26"
timeframe = "4h"
Tips
The 9/21 EMA combination is one of the most widely used short-term crossover pairs. It generates signals fast enough for scalping on 5m and 15m charts while filtering out some of the candle-to-candle noise. For day trading on 1h charts, consider 12/26 instead for slightly smoother signals.
A powerful pattern is to use SMA(200) on the daily chart as a bull/bear market filter, then use EMA crossovers on lower timeframes (1h or 4h) for actual entry timing. This gives you reliable trend identification with responsive entry signals.
In choppy markets, EMA crossovers can fire repeatedly as the lines weave back and forth. Add max_count = 1 to a trigger if you only want it to fire once per position. This prevents your strategy from opening and closing positions on every minor crossover.
Short EMAs (9, 12) work best on short timeframes (5m, 15m, 1h). Medium EMAs (21, 50) suit 1h and 4h charts. Using a very short EMA on a daily chart produces too few data points per crossover, while a long EMA on a 1m chart barely moves. Match the period length to the timeframe for meaningful signals.
An EMA(50) and SMA(50) over the same data will have different values. The EMA will be closer to the current price because of its recency bias. In a strong uptrend, EMA(50) will be above SMA(50); in a strong downtrend, EMA(50) will be below SMA(50). Neither is "better" -- they serve different purposes.
RSI -- Relative Strength Index
Contents
Overview
The Relative Strength Index (RSI) is a momentum oscillator that measures the speed and magnitude of recent price changes. It answers one question: how strong is the current move compared to recent moves?
RSI is calculated by comparing the average size of recent gains to the average size of recent losses over a lookback period. The result is normalized to a scale of 0 to 100:
- RSI near 100 means almost all recent candles were bullish (strong upward momentum).
- RSI near 0 means almost all recent candles were bearish (strong downward momentum).
- RSI near 50 means gains and losses are roughly equal (no clear momentum).
The standard RSI period is 14, which looks at the last 14 candles. Shorter periods make RSI more reactive; longer periods make it smoother.

BTC/USDC 1-hour chart with RSI(14) displayed as a separate oscillator below the price chart. The horizontal lines at 70 (overbought) and 30 (oversold) mark the classic trading zones.
Format
rsi_{period}
The period defines how many candles RSI looks back to calculate average gains and losses.
| Example | Period | Use Case |
|---|---|---|
rsi_7 | 7 | Fast, reactive -- good for scalping on low timeframes |
rsi_14 | 14 | Standard -- the default for most strategies |
rsi_21 | 21 | Slower, smoother -- fewer false signals |
Period range: 1 to 200.
Value range: 0 to 100 (always).
RSI Zones
| RSI Range | Zone | Interpretation |
|---|---|---|
| Below 30 | Oversold | Price has dropped sharply relative to recent history. Selling pressure may be exhausted. Potential buy opportunity. |
| 30 -- 50 | Weak / Neutral | Below the midpoint. Momentum is bearish-leaning or undecided. |
| 50 -- 70 | Bullish | Above the midpoint. Momentum favors buyers. In a healthy uptrend, RSI typically stays in this range. |
| Above 70 | Overbought | Price has risen sharply relative to recent history. Buying pressure may be exhausted. Potential sell opportunity or caution zone. |
"Oversold" and "overbought" do not mean price must reverse. In a strong trend, RSI can stay oversold or overbought for extended periods. RSI below 30 during a crash can stay there for days. Always combine RSI with other confirmations.
Understanding Operators with RSI
Each operator behaves differently with RSI. Understanding the distinction is critical for building strategies that fire when you intend.
< (Less Than) -- State-Based
What it does: The trigger is true on every candle where RSI is below the threshold.
On the chart: Imagine the RSI line sitting below the horizontal 30 line. For as long as the line stays below 30, this trigger is active. If RSI stays below 30 for eight consecutive candles, the trigger fires on all eight.
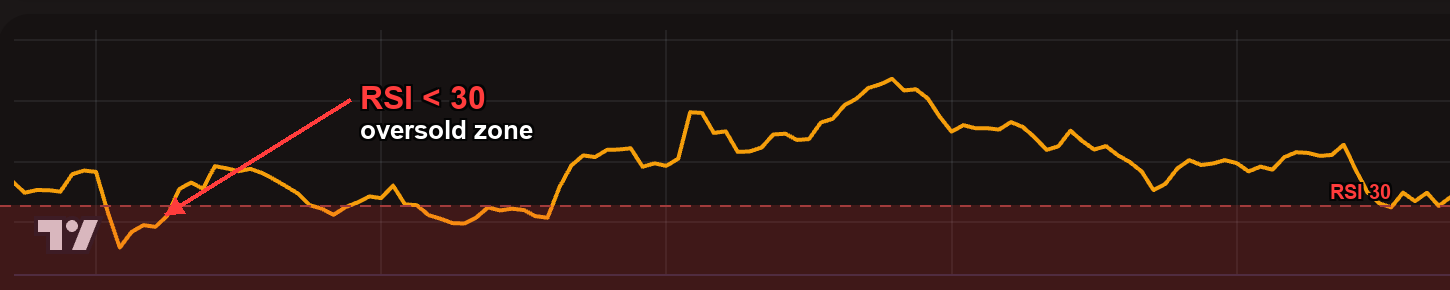
RSI(14) dipping below the 30 threshold — the oversold zone highlighted in red. While RSI remains below 30, the < operator fires on every candle.
[[actions.triggers]]
indicator = "rsi_14"
operator = "<"
target = "30"
Because < fires on every qualifying candle, an "open_long" action with rsi_14 < 30 could attempt to open a new position on each candle where RSI remains below 30. Use max_count to limit this, or use cross_below if you only want the initial dip.
> (Greater Than) -- State-Based
What it does: The trigger is true on every candle where RSI is above the threshold.
On the chart: The RSI line is above the horizontal 70 line. Every candle it stays there, this trigger fires.
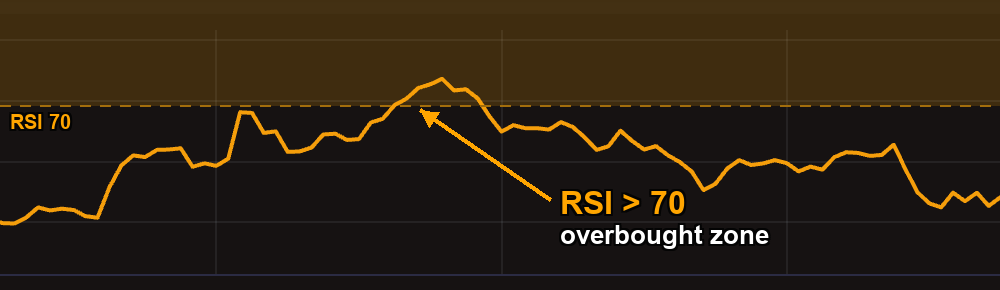
RSI(14) pushing above the 70 threshold — the overbought zone highlighted in orange. This is where selling pressure may start building.
[[actions.triggers]]
indicator = "rsi_14"
operator = ">"
target = "70"
Typical use: Sell when RSI is overbought. Combined with max_count = 1, it fires once when RSI first exceeds 70 and then stops.
cross_below -- Event-Based
What it does: Fires once, at the exact candle where RSI transitions from above the threshold to below it. The previous candle had RSI >= the target, and the current candle has RSI < the target.
On the chart: Picture the RSI line descending through the 70 line. The moment it pierces the line from above to below, this trigger fires -- and then goes silent until the next crossing.
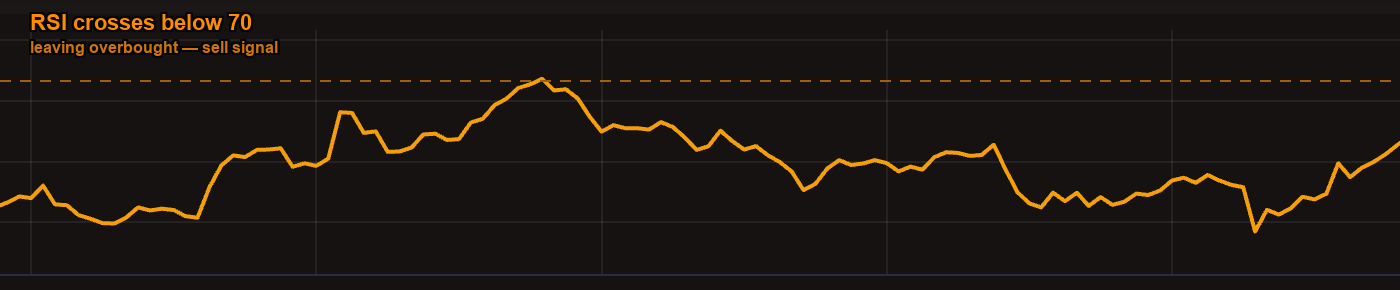
RSI(14) crossing below the 70 threshold — the moment momentum starts fading. This event-based signal fires once at the crossing candle.
[[actions.triggers]]
indicator = "rsi_14"
operator = "cross_below"
target = "70"
Typical use: Detect when RSI "leaves overbought territory." This is often a stronger sell signal than simply being above 70, because it captures the turning point -- the moment momentum starts fading.
cross_above -- Event-Based
What it does: Fires once, at the exact candle where RSI transitions from below the threshold to above it. The previous candle had RSI <= the target, and the current candle has RSI > the target.
On the chart: The RSI line climbing up through the 30 line. The moment it crosses from below to above, the trigger fires once.
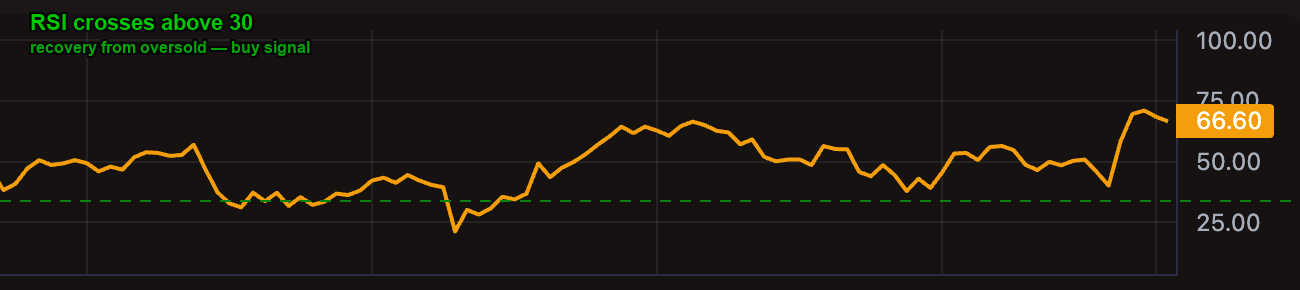
RSI(14) crossing above the 30 threshold — recovery from oversold. Rather than buying while RSI is still falling, this waits for the first sign of recovery.
[[actions.triggers]]
indicator = "rsi_14"
operator = "cross_above"
target = "30"
Typical use: Detect when RSI "recovers from oversold." Rather than buying while RSI is still falling, this waits for the first sign of recovery -- RSI turning back up through 30.
= (Equal) -- Not Recommended for RSI
Why: RSI produces floating-point values like 29.87 or 70.12. Exact equality (rsi_14 = 30) will almost never be true. Use < or > instead.
- Use
</>when you want to act while RSI is in a zone (state-based). Addmax_countto limit repeated firing. - Use
cross_above/cross_belowwhen you want to act at the moment RSI enters or leaves a zone (event-based). Nomax_countneeded -- crossovers fire once by nature.
TOML Examples
Buy on Oversold RSI
The simplest RSI strategy. Enter when RSI drops below 30 on the 1-hour chart.
[[actions]]
type = "open_long"
amount = "100 USDC"

  [[actions.triggers]]
  indicator = "rsi_14"
  operator = "<"
  target = "30"
  timeframe = "1h"
Sell on Overbought RSI
Exit when RSI exceeds 70. The max_count = 1 ensures this only fires once per position.
[[actions]]
type = "sell"
amount = "100%"

  [[actions.triggers]]
  indicator = "rsi_14"
  operator = ">"
  target = "70"
  max_count = 1
Buy on RSI Recovery (Cross Above 30)
Instead of buying while RSI is still falling, wait for the first sign of recovery.
[[actions]]
type = "open_long"
amount = "100 USDC"

  [[actions.triggers]]
  indicator = "rsi_14"
  operator = "cross_above"
  target = "30"
  timeframe = "1h"
Sell on Leaving Overbought (Cross Below 70)
Sell at the moment RSI drops back below 70 -- the overbought momentum is fading.
[[actions]]
type = "sell"
amount = "100%"

  [[actions.triggers]]
  indicator = "rsi_14"
  operator = "cross_below"
  target = "70"
  timeframe = "1h"
StochRSI Extreme Dip
StochRSI is more sensitive than regular RSI and reaches extremes more often. This catches deep short-term dips.
[[actions]]
type = "open_long"
amount = "50 USDC"

  [[actions.triggers]]
  indicator = "stoch_rsi_14"
  operator = "<"
  target = "10"
  timeframe = "5m"
  max_count = 1
RSI with Trend Filter
Only buy RSI dips when the macro trend is bullish (daily SMA 50 above SMA 200).
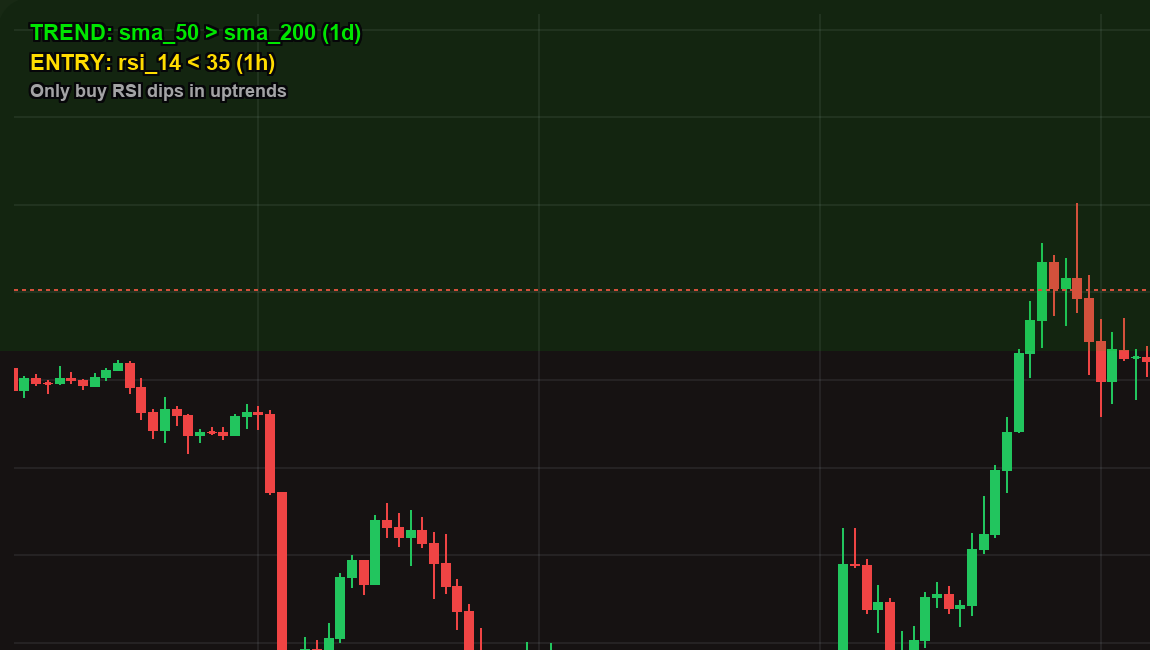
Multi-timeframe confirmation: the daily SMA crossover confirms the macro uptrend, while the hourly RSI catches dip entries within that trend. This "trend-safe DCA" pattern avoids buying into falling markets.
[[actions]]
type = "open_long"
amount = "100 USDC"

  [[actions.triggers]]
  indicator = "rsi_14"
  operator = "<"
  target = "35"
  timeframe = "1h"

  [[actions.triggers]]
  indicator = "sma_50"
  operator = ">"
  target = "sma_200"
  timeframe = "1d"
Tips
Shorter periods (7, 9) make RSI oscillate faster between extremes. You get more signals, but more of them are false. Best suited for scalping on lower timeframes (1m, 5m).
Longer periods (21, 28) smooth out RSI and produce fewer, more reliable signals. Better for swing trading on higher timeframes (4h, 1d).
RSI(14) is the standard middle ground. Start here and adjust based on backtest results.
RSI works best as a timing tool within a confirmed trend, not as a standalone signal. RSI < 30 in a strong downtrend is often a trap -- price can stay oversold for days. Pair RSI entries with a trend filter like sma_50 > sma_200 on the daily chart to avoid buying into falling markets.
A powerful pattern is to sell in stages: sell 50% at RSI > 50 (partial profit) and sell the remaining 100% at RSI > 70 (full exit). This captures more upside on strong bounces while locking in some profit early.
If you find RSI(14) too slow to reach extremes, try stoch_rsi_14. StochRSI applies the stochastic formula to RSI values, making it far more volatile -- it frequently hits 0 and 100. Use StochRSI for catching short-term dips on low timeframes; use RSI for broader momentum reads.
MACD -- Moving Average Convergence Divergence
Contents
Overview
MACD is a trend-following momentum indicator that reveals the relationship between two exponential moving averages of price. It answers the question: is short-term momentum accelerating or decelerating relative to the longer-term trend?
MACD produces three components that work together:
- MACD Line -- the difference between the 12-period EMA and the 26-period EMA. When the fast EMA pulls away from the slow EMA, the MACD line moves further from zero. When they converge, it moves toward zero.
- Signal Line -- a 9-period EMA of the MACD line itself. It acts as a smoothed version of the MACD line and is used for crossover signals.
- Histogram -- the difference between the MACD line and the signal line, displayed as bars. It visualizes how far apart the two lines are and how quickly they are converging or diverging.
The interplay between these three components gives traders a rich view of momentum, trend direction, and potential turning points.
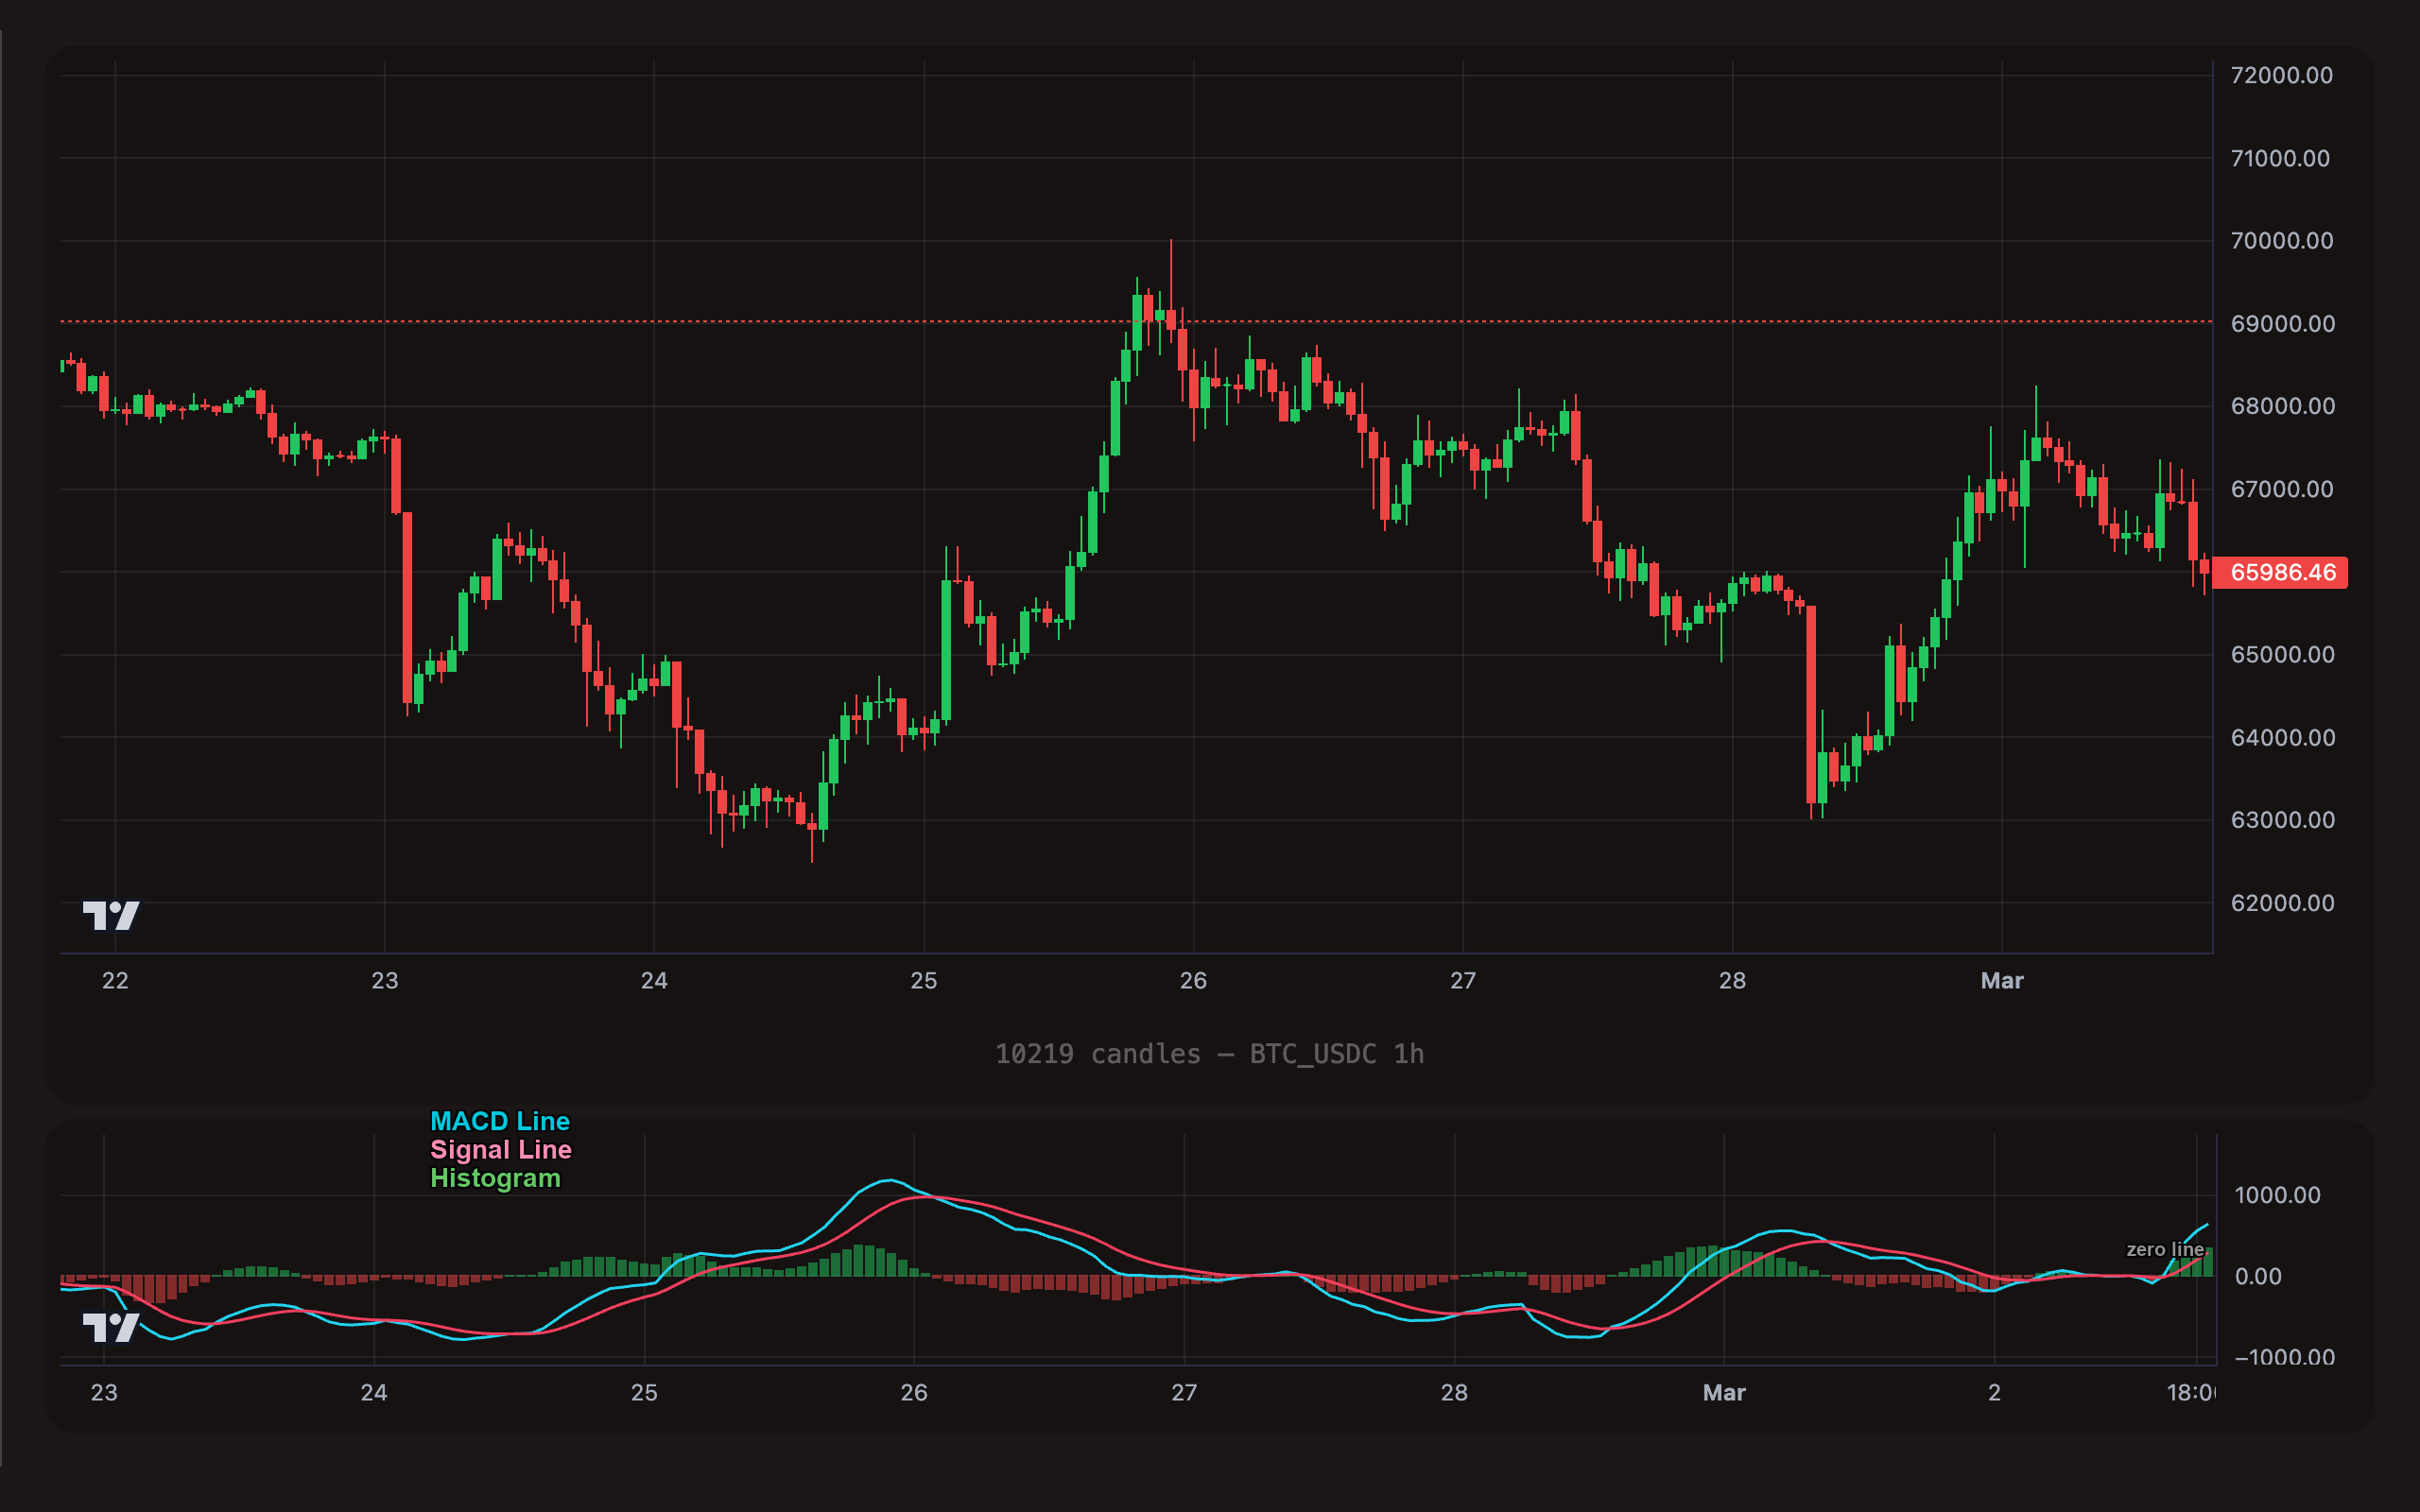
BTC/USDC 1-hour chart with MACD displayed below. The MACD line (cyan), signal line (pink), and histogram (green bars) show momentum and trend direction. The zero line separates bullish (above) from bearish (below) territory.
Components
| Component | TOML Format | Calculation | What It Shows |
|---|---|---|---|
| MACD Line | macd_line | EMA(12) minus EMA(26) | Direction and strength of short-term momentum relative to the longer-term trend. Positive = bullish, negative = bearish. |
| Signal Line | macd_signal | 9-period EMA of macd_line | A smoothed lagging reference for the MACD line. Crossovers between these two lines generate buy/sell signals. |
| Histogram | macd_histogram | macd_line minus macd_signal | The gap between the MACD and signal lines. Growing histogram = momentum increasing. Shrinking histogram = momentum fading. |
MACD uses fixed parameters (12/26/9). You cannot customize the EMA periods. The format is always macd_line, macd_signal, or macd_histogram -- there is no period suffix.
Value range: MACD values are unbounded. They can be positive or negative, and the magnitude depends on the asset's price. For BTC, MACD values might range from -500 to +500 on hourly candles. The zero line is the critical reference point: MACD above zero means the 12-period EMA is above the 26-period EMA (bullish); below zero means bearish.
Reading the MACD Chart
Understanding how the three components relate visually is key to using MACD effectively.
MACD Line above Signal Line:
- The histogram bars are positive (above the zero line).
- Momentum is bullish -- short-term price action is outpacing the smoothed average.
MACD Line below Signal Line:
- The histogram bars are negative (below the zero line).
- Momentum is bearish -- short-term price action is lagging behind the smoothed average.
MACD Line above Zero:
- The 12-period EMA is above the 26-period EMA.
- The overall short-to-medium-term trend is bullish.
MACD Line below Zero:
- The 12-period EMA is below the 26-period EMA.
- The overall short-to-medium-term trend is bearish.
Histogram growing (bars getting taller):
- The MACD line is pulling away from the signal line.
- Momentum is accelerating in the current direction.
Histogram shrinking (bars getting shorter):
- The MACD line is moving toward the signal line.
- Momentum is decelerating. A crossover may be approaching.
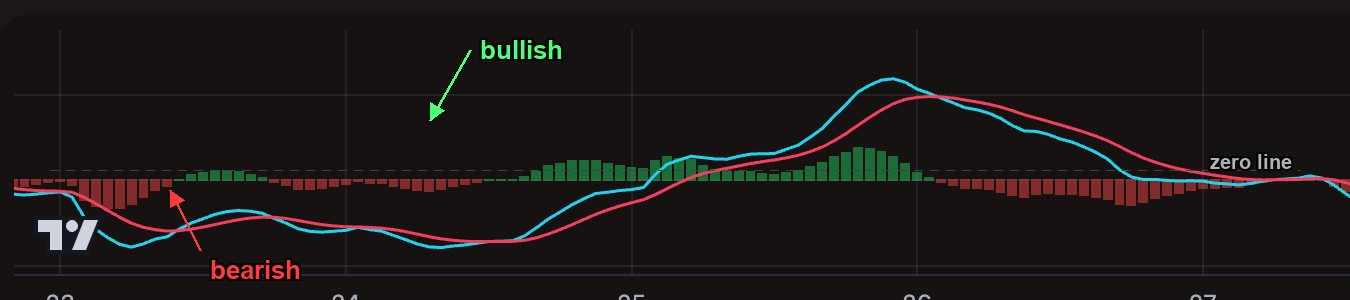
The MACD histogram visualizes momentum direction. Green bars above zero = bullish momentum. Red bars below zero = bearish momentum. Watch for bars shrinking as an early warning of a crossover.
Understanding Operators with MACD
cross_above -- Event-Based
This is the most important MACD operator. It fires at the exact candle where one component crosses above another.
MACD Line crosses above Signal Line (Bullish Crossover):
On the chart, look for where the blue MACD line crosses above the orange signal line. At that moment, the histogram flips from negative to positive. This is the classic MACD buy signal -- short-term momentum has turned bullish.
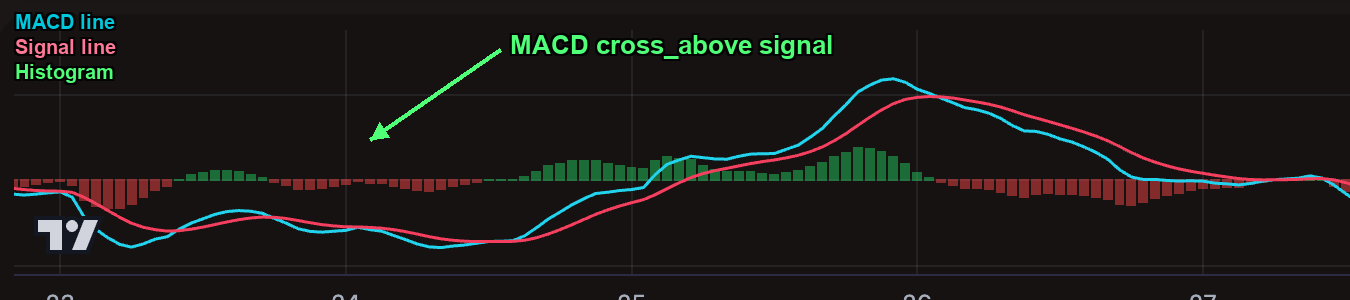
The MACD line (cyan) crosses above the signal line (pink) — a bullish crossover. The histogram flips from negative to positive at this moment.
[[actions.triggers]]
indicator = "macd_line"
operator = "cross_above"
target = "macd_signal"
timeframe = "1h"
MACD Line crosses above the Zero Line:
On the chart, the MACD line moves from below zero to above zero. This is a stronger confirmation than the signal crossover -- it means the 12-period EMA has actually crossed above the 26-period EMA. The trend itself has shifted bullish, not just the momentum.
[[actions.triggers]]
indicator = "macd_line"
operator = "cross_above"
target = "0"
timeframe = "4h"
cross_below -- Event-Based
The mirror of cross_above. Fires at the moment of a downward crossing.
MACD Line crosses below Signal Line (Bearish Crossover):
The MACD line dips below the signal line. The histogram flips negative. Momentum has turned bearish.
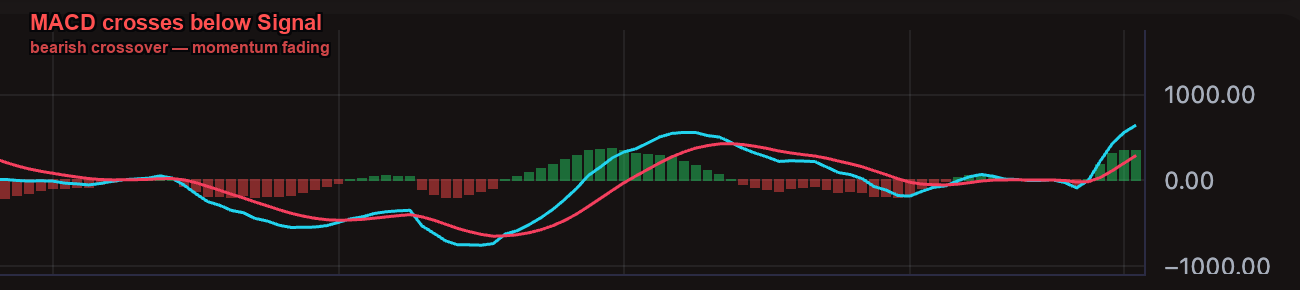
The MACD line crosses below the signal line — a bearish crossover. Momentum has turned negative and the histogram bars flip to the downside.
[[actions.triggers]]
indicator = "macd_line"
operator = "cross_below"
target = "macd_signal"
timeframe = "1h"
MACD Line crosses below Zero:
The trend itself has shifted bearish. The 12-period EMA has dropped below the 26-period EMA.
[[actions.triggers]]
indicator = "macd_line"
operator = "cross_below"
target = "0"
timeframe = "4h"
> (Greater Than) -- State-Based
True on every candle where the condition holds. Useful for trend filters rather than entry signals.
MACD Line above Zero = Bullish bias:
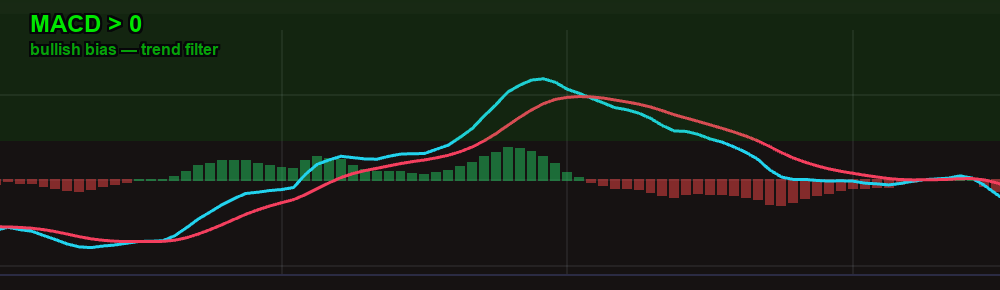
MACD line above the zero line — the 12-period EMA is above the 26-period EMA, confirming a bullish bias. Use this as a trend filter for other entry triggers.
[[actions.triggers]]
indicator = "macd_line"
operator = ">"
target = "0"
This fires on every candle where MACD is positive. Use it as a filter alongside other entry triggers -- "only buy when the overall MACD trend is bullish."
Histogram above Zero = Bullish momentum:
[[actions.triggers]]
indicator = "macd_histogram"
operator = ">"
target = "0"
The histogram is positive whenever the MACD line is above the signal line. Using > with the histogram is equivalent to saying "MACD momentum is currently bullish."
< (Less Than) -- State-Based
True on every candle where the condition holds.
MACD Line below Zero = Bearish bias:
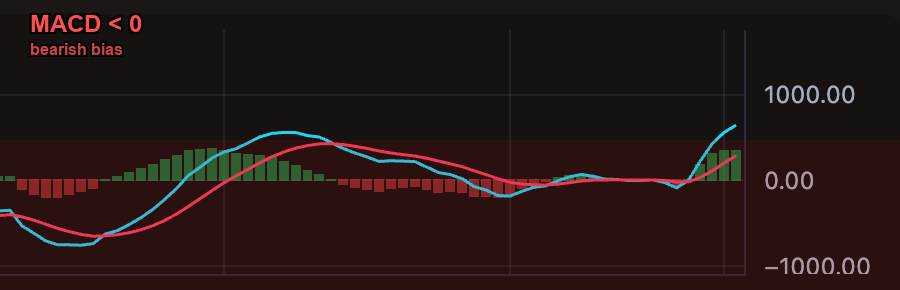
MACD line below the zero line — bearish bias. The 12-period EMA is below the 26-period EMA, confirming a downtrend.
[[actions.triggers]]
indicator = "macd_line"
operator = "<"
target = "0"
Histogram below Zero = Bearish momentum:
[[actions.triggers]]
indicator = "macd_histogram"
operator = "<"
target = "0"
Use cross_above / cross_below for entry and exit signals -- they fire once at the turning point. Use > / < as filters that confirm the current trend direction for another trigger. For example: "buy when RSI < 30 AND macd_line > 0" uses MACD as a bullish trend gate.
TOML Examples
Bullish Crossover Entry
Enter when the MACD line crosses above the signal line on the 1-hour chart. This is the most common MACD strategy.
[[actions]]
type = "open_long"
amount = "100 USDC"

  [[actions.triggers]]
  indicator = "macd_line"
  operator = "cross_above"
  target = "macd_signal"
  timeframe = "1h"
Bearish Crossover Exit
Exit the position when MACD momentum reverses. This acts as a dynamic stop-loss -- instead of a fixed percentage, you exit when the momentum signal that justified your entry flips bearish.
[[actions]]
type = "sell"
amount = "100%"

  [[actions.triggers]]
  indicator = "macd_line"
  operator = "cross_below"
  target = "macd_signal"
  timeframe = "1h"
Zero-Line Cross Entry
A more conservative entry than the signal crossover. Waits for the MACD line to cross above zero, confirming that the 12-period EMA is above the 26-period EMA.
[[actions]]
type = "open_long"
amount = "100 USDC"

  [[actions.triggers]]
  indicator = "macd_line"
  operator = "cross_above"
  target = "0"
  timeframe = "4h"
Histogram Turns Positive
Buy when the MACD histogram crosses above zero. This is equivalent to the MACD line crossing above the signal line but expressed through the histogram component.
[[actions]]
type = "open_long"
amount = "100 USDC"

  [[actions.triggers]]
  indicator = "macd_histogram"
  operator = "cross_above"
  target = "0"
  timeframe = "1h"
MACD as Trend Filter with RSI Entry
Use MACD above zero as a bullish trend gate, and RSI for timing the entry. This avoids buying RSI dips in a bearish trend.
[[actions]]
type = "open_long"
amount = "100 USDC"

  [[actions.triggers]]
  indicator = "macd_line"
  operator = ">"
  target = "0"
  timeframe = "1h"

  [[actions.triggers]]
  indicator = "rsi_14"
  operator = "<"
  target = "35"
  timeframe = "1h"
Full MACD Strategy (Entry + Exit)
Enter on bullish crossover, exit on bearish crossover or fixed profit target -- whichever comes first.
[meta]
name = "MACD_Momentum"
description = "Enter on MACD bullish cross, exit on bearish cross or +3%"

# ENTRY
[[actions]]
type = "open_long"
amount = "100 USDC"

  [[actions.triggers]]
  indicator = "macd_line"
  operator = "cross_above"
  target = "macd_signal"
  timeframe = "1h"

# TAKE PROFIT
[[actions]]
type = "sell"
amount = "100%"

  [[actions.triggers]]
  type = "pos_price_change"
  value = "3%"

# MOMENTUM EXIT
[[actions]]
type = "sell"
amount = "100%"

  [[actions.triggers]]
  indicator = "macd_line"
  operator = "cross_below"
  target = "macd_signal"
  timeframe = "1h"
Tips
MACD was designed for daily charts but works well on hourly and 4-hour candles in crypto. On very short timeframes (1m, 5m), MACD crossovers happen frequently and most are noise. Stick to 1h or higher for reliable MACD signals.
The signal crossover (macd_line cross_above macd_signal) is the earlier, more aggressive signal. The zero-line crossover (macd_line cross_above 0) is later but confirms the actual trend shift. Use signal crossovers for faster entries and zero-line crossovers for higher-confidence entries.
The histogram starts shrinking before a crossover happens. If you see the histogram bars getting shorter, momentum is fading -- a crossover (and potential exit signal) may be approaching. This gives you a visual heads-up before the signal fires.
MACD performs poorly in sideways, choppy markets. The MACD line oscillates around zero, generating frequent false crossovers. If you see the MACD line hugging the zero line with tiny crossovers, the market is likely ranging -- consider pausing the strategy or adding a volatility filter (e.g., ATR above a threshold).
Because MACD is built from EMAs, it inherently lags price. A MACD bullish crossover confirms that a move has already started -- it does not predict the future. By the time MACD signals "buy," price may have already moved 2-5% off the bottom. Accept this lag as the cost of confirmation, or combine MACD with a leading indicator like RSI for earlier entries.
Bollinger Bands
Contents
Overview
Bollinger Bands are a volatility-based indicator that creates a dynamic envelope around price. The indicator consists of three lines:
- Middle band -- a 20-period Simple Moving Average (SMA) of the closing price.
- Upper band -- the middle band plus 2 standard deviations.
- Lower band -- the middle band minus 2 standard deviations.
Because the bands are derived from standard deviation, they automatically widen when the market is volatile and narrow (squeeze) when the market is calm. Roughly 95% of price action stays within the bands under normal conditions, so a move outside them is statistically significant.
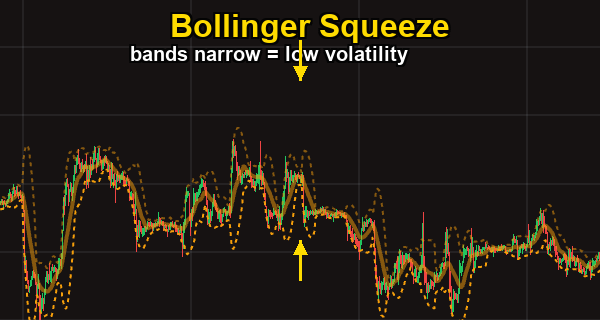
A Bollinger Squeeze — the bands narrow when volatility drops. This compression often precedes a strong breakout move in either direction.
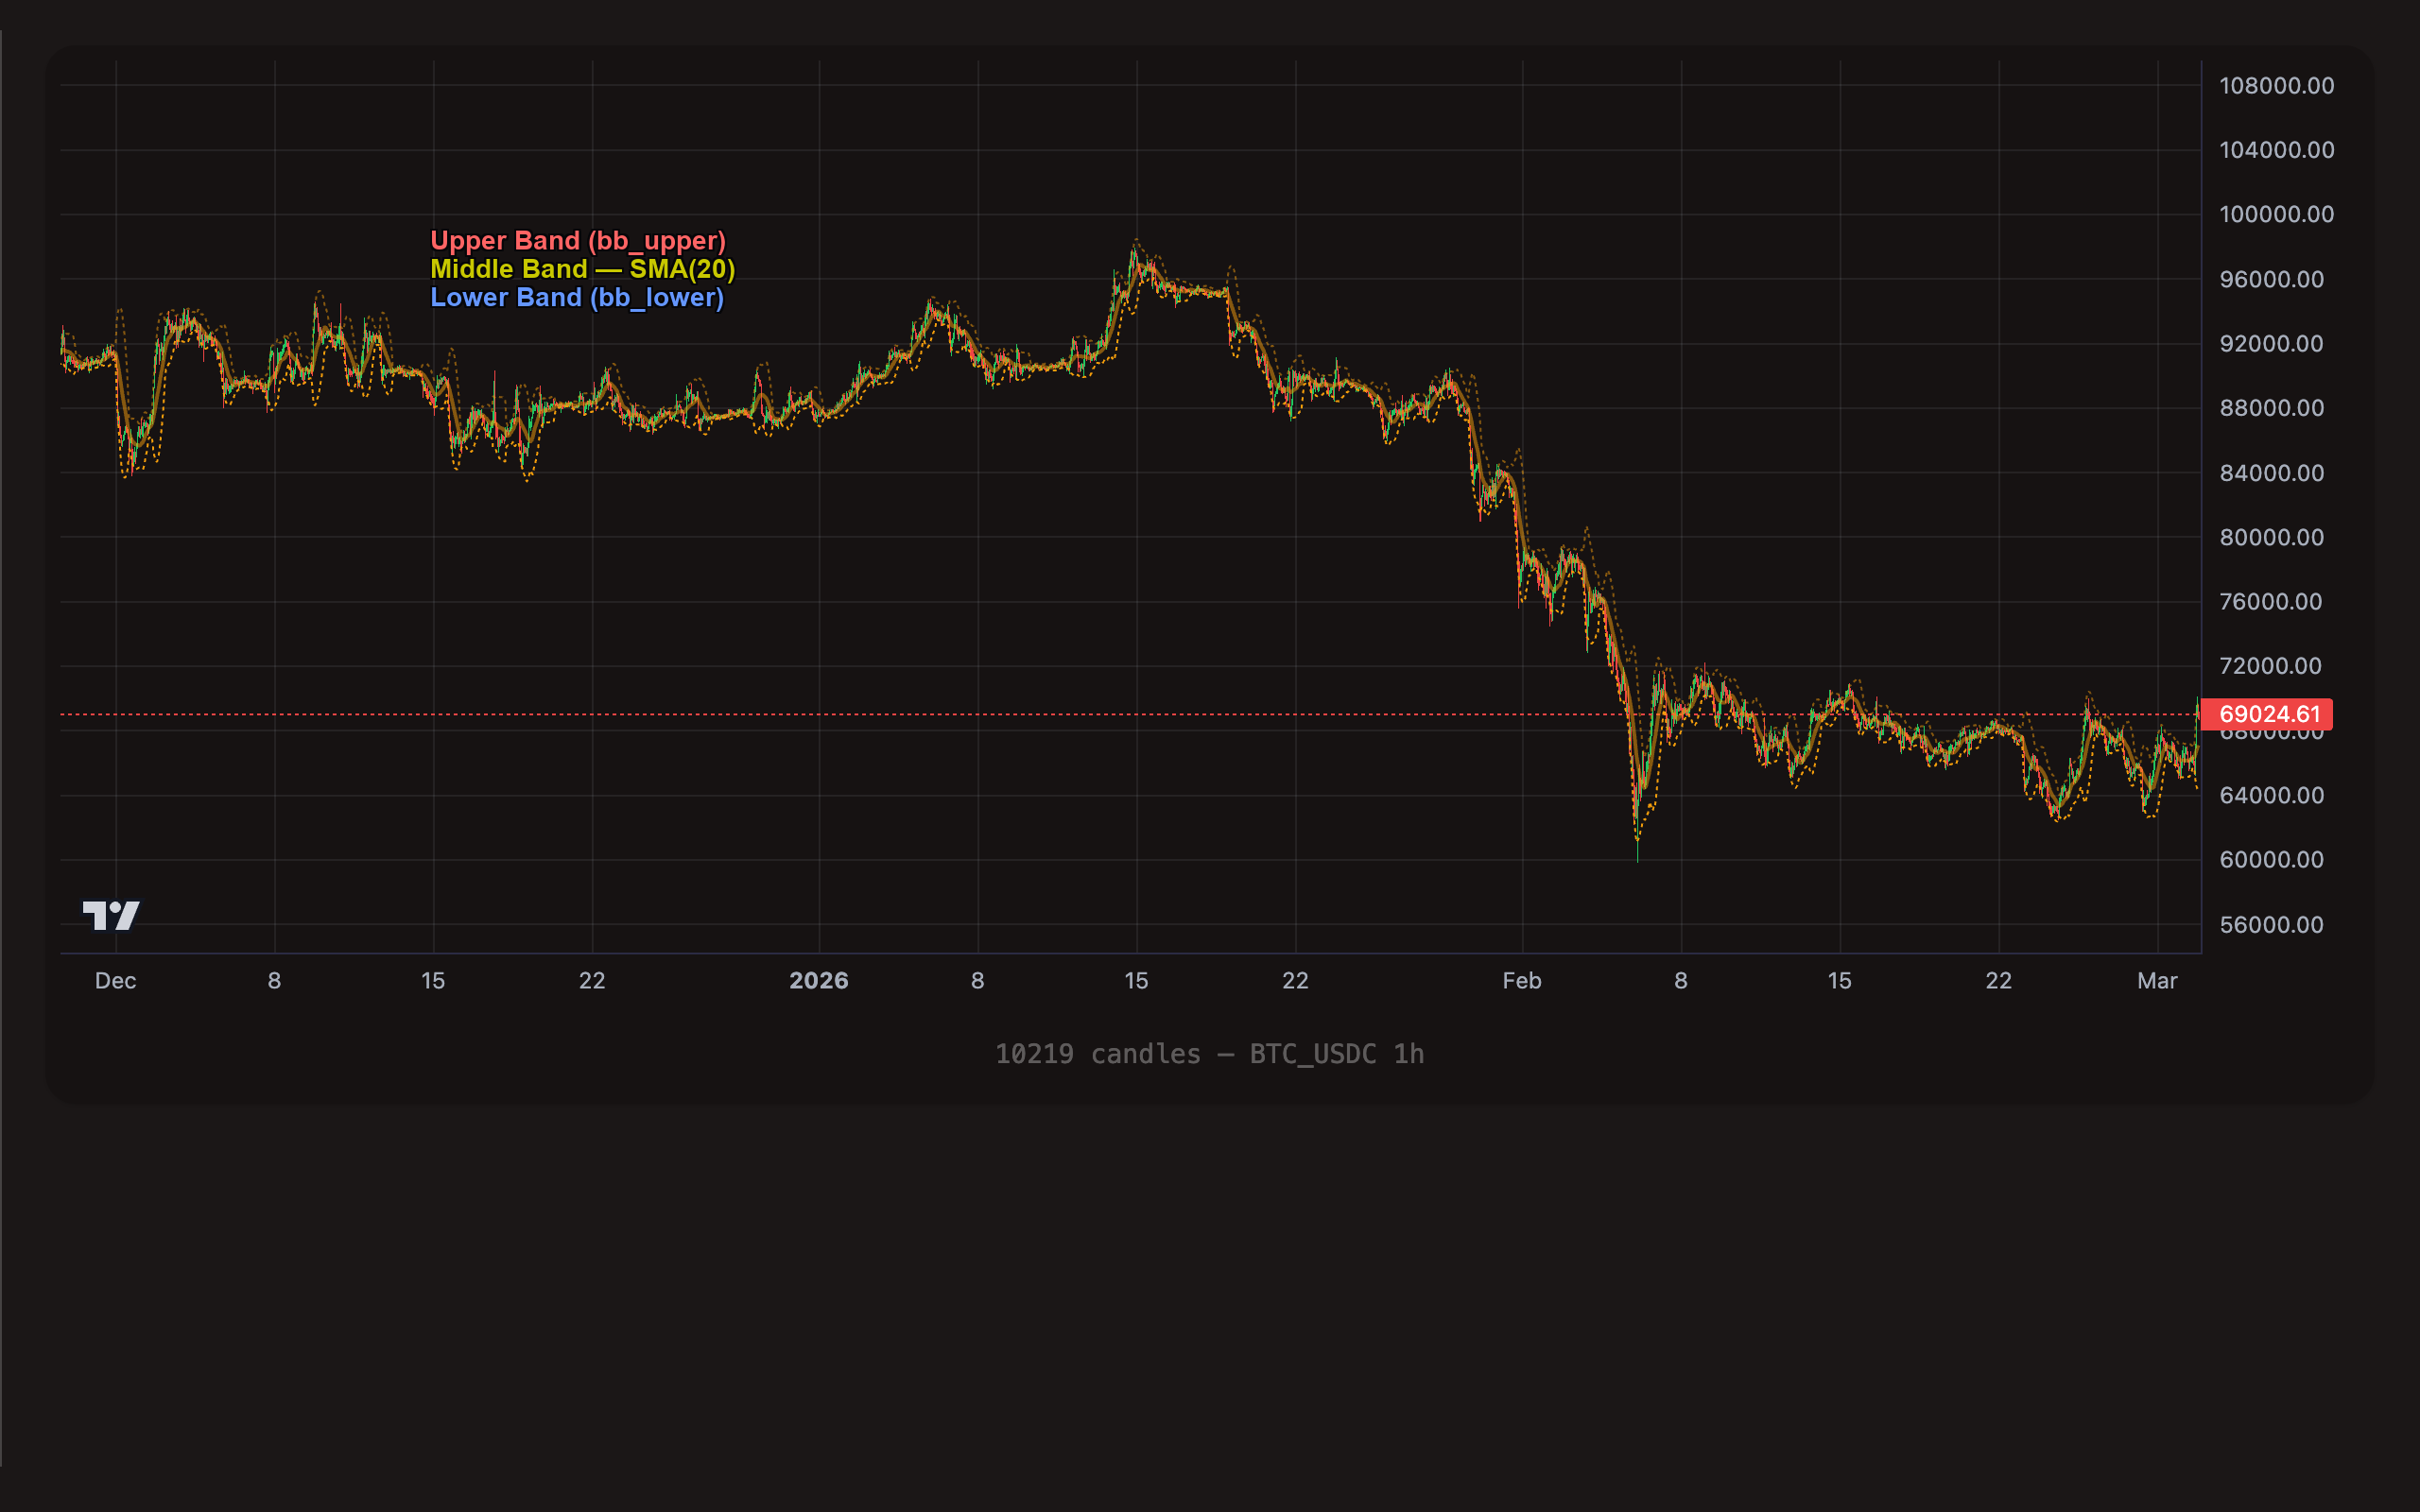
BTC/USDC 1-hour chart with Bollinger Bands. The upper band (bb_upper), middle band (SMA 20), and lower band (bb_lower) create a dynamic envelope around price. Notice how the bands widen during volatile periods and squeeze during consolidation.
Components
| Component | TOML Format | Description |
|---|---|---|
| Upper Band | bb_upper | Middle band + 2 standard deviations. Acts as dynamic resistance. |
| Middle Band | bb_middle | 20-period SMA. The "fair value" center line. |
| Lower Band | bb_lower | Middle band - 2 standard deviations. Acts as dynamic support. |
All three components can be used as either the indicator or the target in a trigger.
Bollinger Bands use fixed parameters: 20-period lookback and 2 standard deviations. You cannot change these values -- the format is always bb_upper, bb_middle, or bb_lower.
Understanding Operators with Bollinger Bands
Bollinger Bands are price-level indicators, so they pair naturally with comparison and crossover operators. Here is how each operator behaves in context:
< -- Price Below a Band
price < bb_lower
Price drops below the lower band. On the chart, the candle closes below the bottom line of the envelope. This is the classic Bollinger Bounce buy signal -- price has moved more than 2 standard deviations below the mean and is statistically likely to revert.
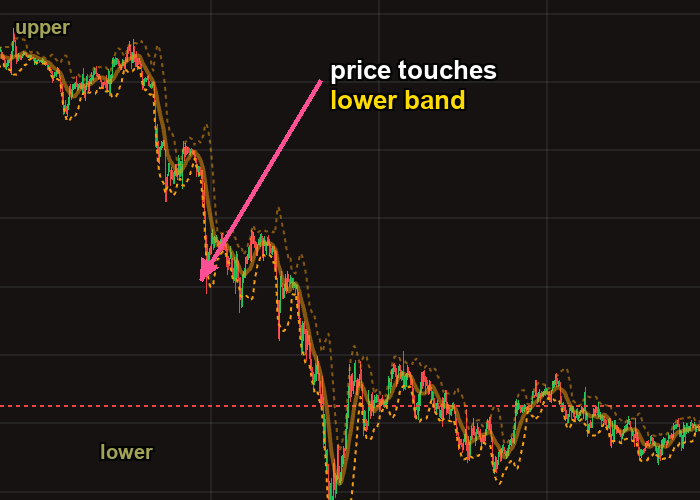
Price dropping to touch the lower Bollinger Band — a potential mean-reversion buy signal. The upper and lower bands define the 2-standard-deviation envelope.
This is a state-based operator. It fires on every candle where price remains below the band. Use max_count if you only want it to fire once per position.
> -- Price Above a Band
price > bb_upper
Price breaks above the upper band. This can signal either a breakout (strong momentum continuing upward) or an overbought condition (price extended too far and likely to pull back). Context matters -- in a strong uptrend, price can ride the upper band for extended periods.
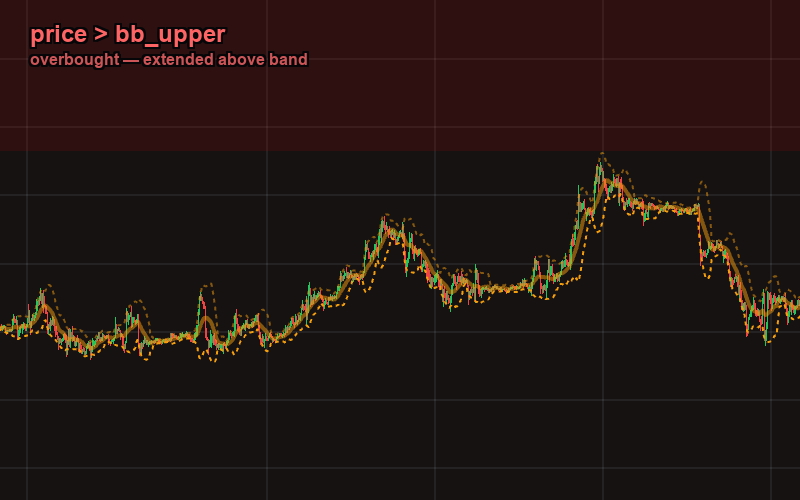
Price extending above the upper Bollinger Band — overbought territory. The red zone highlights where price has moved more than 2 standard deviations above the mean.
cross_below -- Crossing Below a Band
price cross_below bb_lower
Price crosses from above to below the lower band. This is an event-based operator -- it fires exactly once at the moment the crossing happens. On the previous candle, price was at or above bb_lower; on the current candle, price is below it.
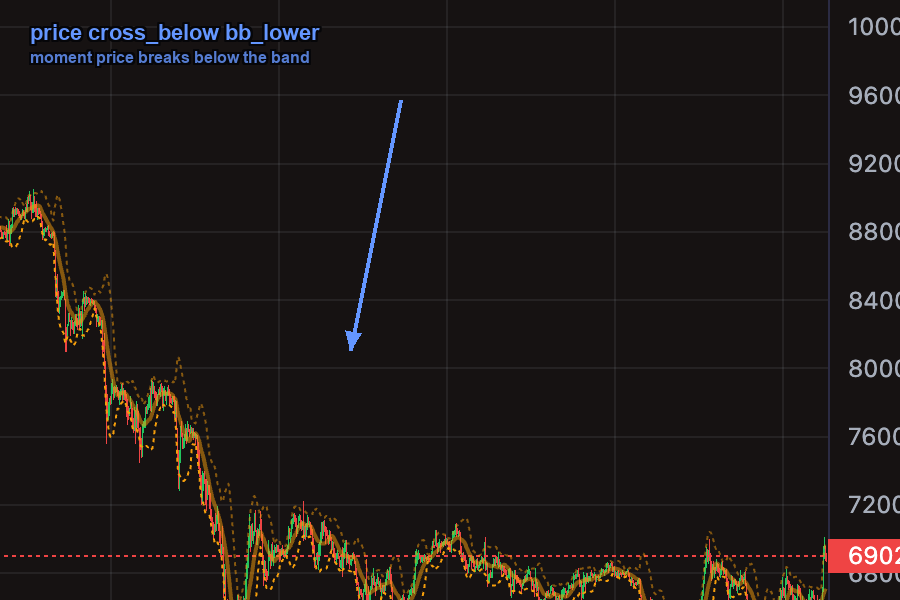
The moment price breaks below the lower Bollinger Band — an event-based signal that fires once at the crossing candle. Use this instead of < when you want the precise breakout moment.
Use this instead of < when you want to catch the precise moment price breaks below the band rather than the sustained condition of being below it.
cross_above -- Crossing Above a Band
price cross_above bb_middle
Price crosses from below to above the middle band. This is a mean reversion confirmation signal -- after a dip below the lower band, price crossing back above the middle band confirms that the reversion is underway. This is an event-based operator and fires once at the crossing.
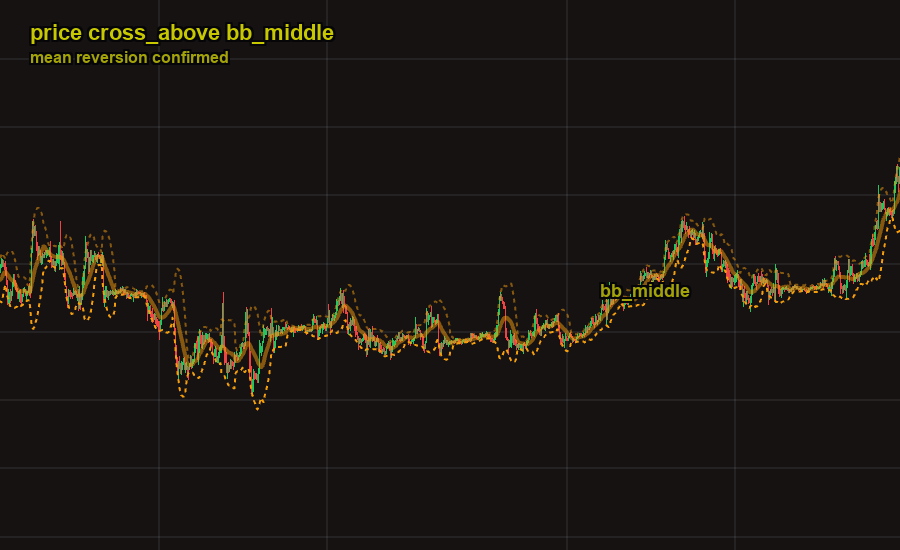
Price crossing back above the middle Bollinger Band (SMA 20) — mean reversion confirmed. After touching the lower band, this crossing signals the recovery is underway.
The direction you read a trigger matters. bb_lower > price is equivalent to price < bb_lower -- both mean "price is below the lower Bollinger Band." Botmarley reads left-to-right: indicator operator target.
TOML Examples
Buy When Price Drops Below Lower Band
The classic Bollinger Bounce entry. Price below the lower band means it is extended more than 2 standard deviations from the mean.
[[actions]]
type = "open_long"
amount = "100 USDC"

[[actions.triggers]]
indicator = "price"
operator = "<"
target = "bb_lower"
timeframe = "1h"
Alternative Form -- Lower Band Above Price
This is identical in meaning to the example above but written with the indicator and target swapped:
[[actions.triggers]]
indicator = "bb_lower"
operator = ">"
target = "price"
timeframe = "1h"
Sell When Price Breaks Above Upper Band
Price above the upper band may indicate an overbought condition -- a good time to take profit.
[[actions]]
type = "sell"
amount = "50%"

[[actions.triggers]]
indicator = "price"
operator = ">"
target = "bb_upper"
timeframe = "1h"
Mean Reversion -- Price Crosses Back Above Middle Band
After a dip below the lower band, wait for price to cross back above the middle band before entering. This confirms the reversion is in progress rather than catching a still-falling knife.
[[actions]]
type = "open_long"
amount = "100 USDC"

[[actions.triggers]]
indicator = "price"
operator = "cross_above"
target = "bb_middle"
timeframe = "1h"
Bollinger Bounce with RSI Confirmation
Combine Bollinger Bands with RSI to filter out false signals. Only buy when price is below the lower band AND RSI confirms oversold conditions.
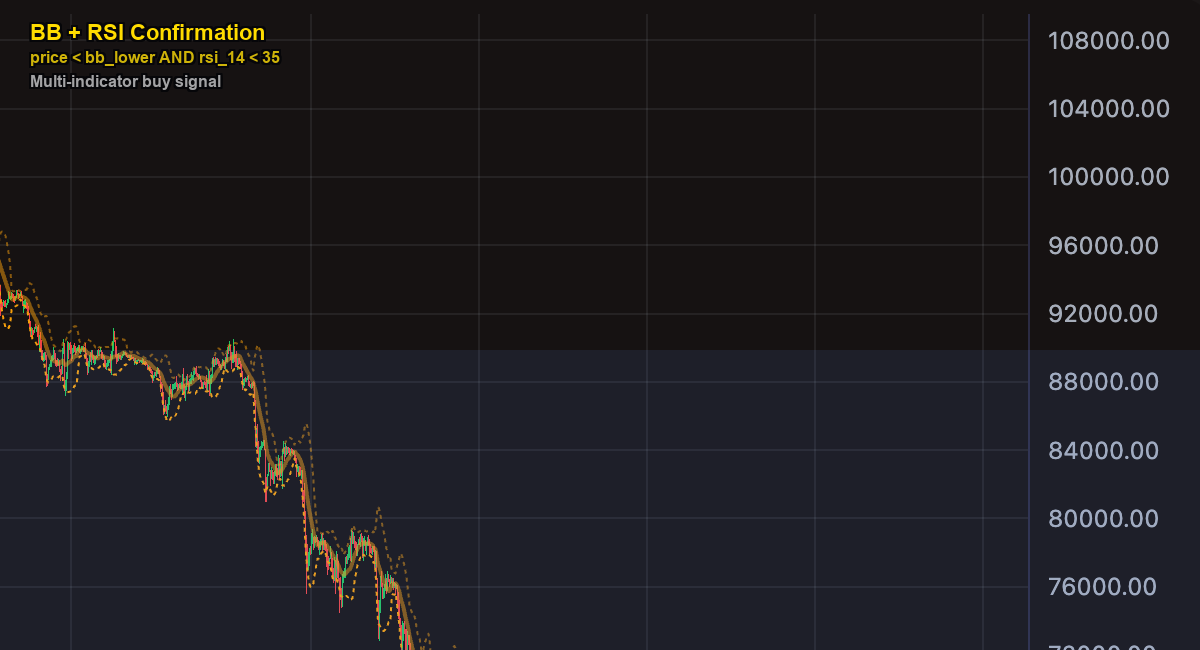
Multi-indicator confirmation: price below the lower Bollinger Band AND RSI below 35. Combining two independent signals filters out false positives and increases the reliability of the entry.
[[actions]]
type = "open_long"
amount = "100 USDC"

[[actions.triggers]]
indicator = "price"
operator = "<"
target = "bb_lower"
timeframe = "1h"

[[actions.triggers]]
indicator = "rsi_14"
operator = "<"
target = "35"
timeframe = "1h"
Tips
There are two opposing strategies with Bollinger Bands:
- Bollinger Bounce -- buy when price touches the lower band, expecting a reversion to the middle. Works best in ranging, sideways markets.
- Bollinger Breakout -- buy when price breaks above the upper band, expecting momentum to continue. Works best in trending markets.
Backtest both approaches on your target pair to see which fits the market regime.
A Bollinger Band breakout is more meaningful when accompanied by a volume spike. Add a volume confirmation trigger (e.g., vol_sma_20) to filter out low-conviction breakouts.
In strong trends, price can "walk the band" -- staying near the upper band in an uptrend or the lower band in a downtrend for many candles. A state-based trigger like price < bb_lower will fire on every one of those candles. Use max_count to limit firing, or switch to cross_below for a one-time signal.
StochRSI -- Stochastic RSI
Contents
Overview
Stochastic RSI (StochRSI) applies the Stochastic oscillator formula to RSI values instead of raw price. The result is an indicator that is significantly more sensitive than standard RSI -- it reaches extreme values (0 and 100) far more frequently.
Where RSI might hover around 40--60 for extended periods, StochRSI will swing aggressively between 0 and 100 within the same timeframe. This makes it ideal for catching short-term reversals, but it also means more false signals.
Think of it this way:
- RSI answers: "How strong is the current momentum compared to recent history?"
- StochRSI answers: "Where is RSI right now relative to its own recent range?"
If RSI has ranged between 35 and 65 over the last 14 candles and currently sits at 35, StochRSI would be near 0 -- even though RSI itself is not at a traditional "oversold" level. This relative measurement is what makes StochRSI more reactive.
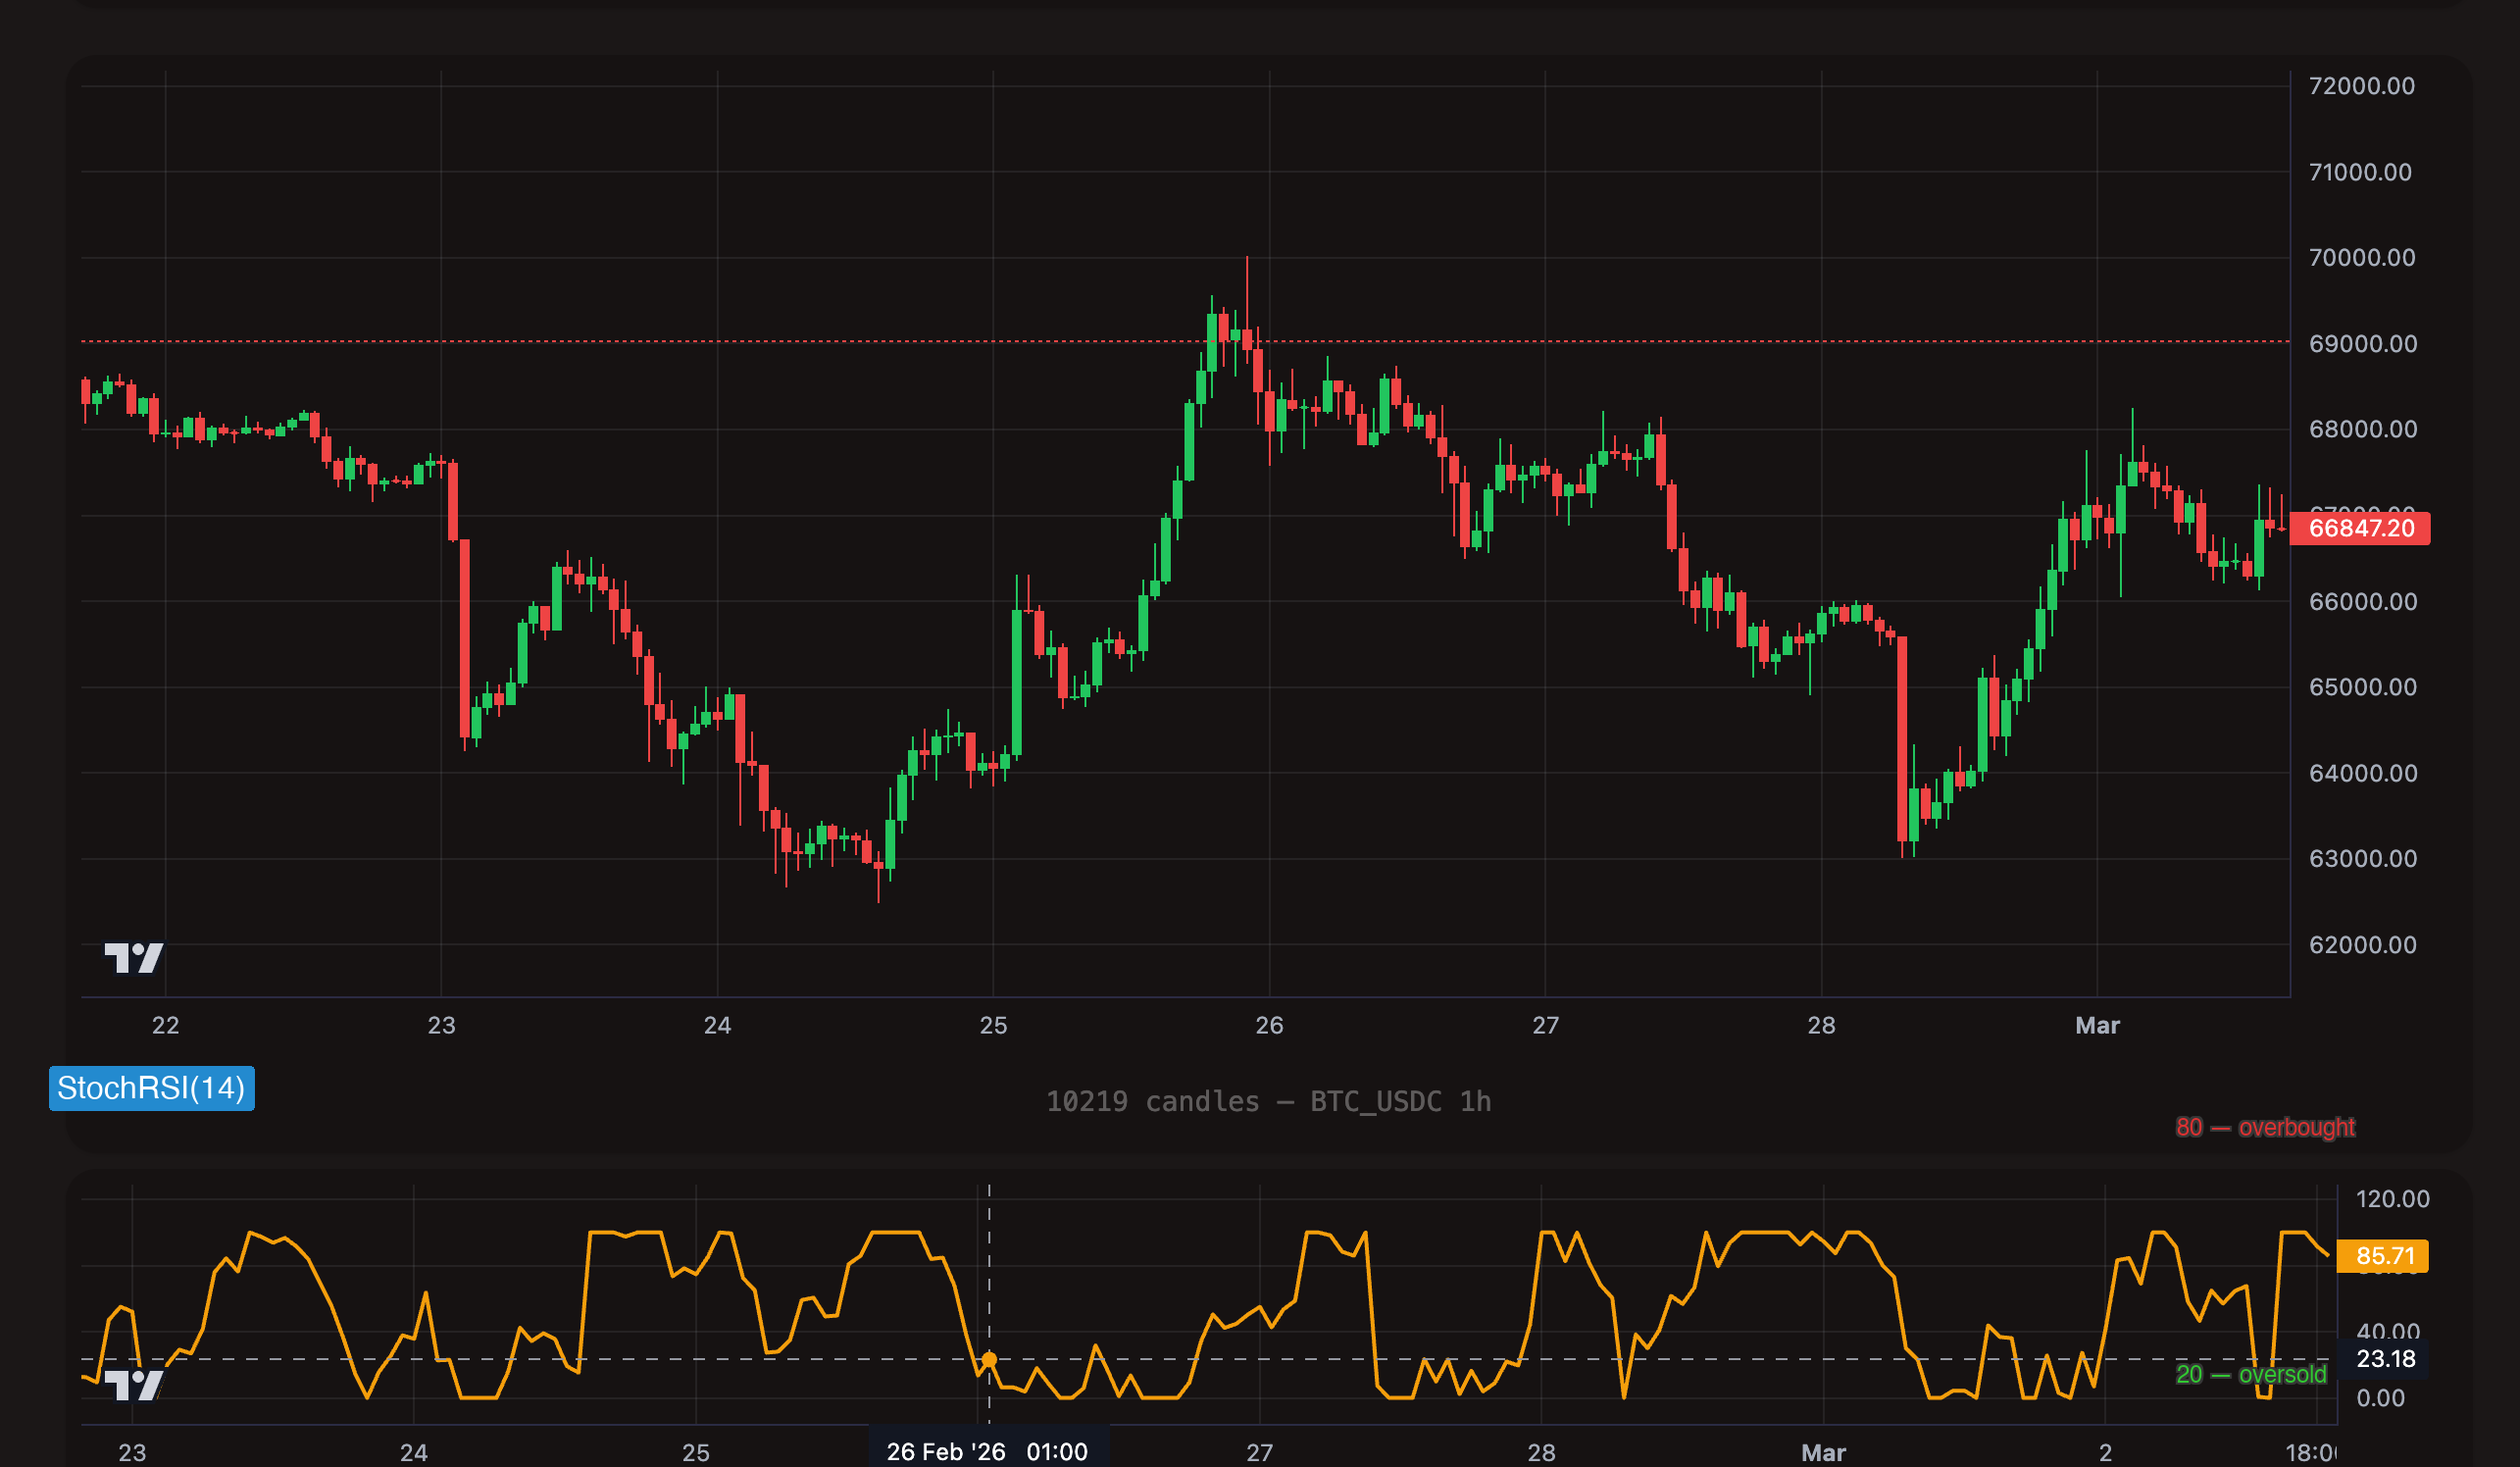
Format
stoch_rsi_{period}
The period defines the lookback window for both the underlying RSI calculation and the stochastic normalization applied on top.
| Example | Period | Use Case |
|---|---|---|
stoch_rsi_7 | 7 | Very fast, extremely reactive -- ideal for scalping on 1m/5m charts |
stoch_rsi_14 | 14 | Standard -- the most common period, balances sensitivity and reliability |
stoch_rsi_21 | 21 | Smoother, fewer whipsaws -- better for 15m/1h swing entries |
Period range: 1 to 200.
Value range: 0 to 100 (always).
StochRSI Zones
| StochRSI Range | Zone | Interpretation |
|---|---|---|
| Below 10 | Deeply Oversold | RSI is at the very bottom of its recent range. Strong short-term reversal candidate. |
| 10 -- 20 | Oversold | RSI is near the low end of its recent range. Selling pressure may be exhausting. |
| 20 -- 80 | Neutral | StochRSI is mid-range. No strong directional signal from this indicator alone. |
| 80 -- 90 | Overbought | RSI is near the high end of its recent range. Buying pressure may be peaking. |
| Above 90 | Deeply Overbought | RSI is at the very top of its recent range. Strong short-term reversal candidate. |
StochRSI reaches 0 and 100 much more frequently than RSI reaches 30 and 70. A StochRSI value of 0 does not carry the same weight as an RSI of 0 (which would be extraordinary). Treat StochRSI extremes as short-term timing signals, not as strong standalone conviction signals.
Understanding Operators with StochRSI
Each operator behaves differently with StochRSI. Because StochRSI oscillates rapidly, operator choice has a major impact on signal frequency.
< (Less Than) -- State-Based
What it does: The trigger is true on every candle where StochRSI is below the threshold.
On the chart: StochRSI drops below the 10 line. For every candle it remains below 10, this trigger fires. Because StochRSI moves fast, these episodes tend to be short-lived (2--5 candles), but they can still fire multiple times.
[[actions.triggers]]
indicator = "stoch_rsi_14"
operator = "<"
target = "10"
timeframe = "5m"
StochRSI spends more time at extremes than RSI does. Even with a tight threshold like 10, you may get repeated triggers in quick succession. Always use max_count to limit entries, or switch to cross_below for a single-fire signal.
> (Greater Than) -- State-Based
What it does: The trigger is true on every candle where StochRSI is above the threshold.
On the chart: StochRSI climbs above the 80 or 90 line. Every candle it stays there, this trigger fires.
[[actions.triggers]]
indicator = "stoch_rsi_14"
operator = ">"
target = "85"
timeframe = "5m"
Typical use: Exit or take profit when StochRSI signals short-term overbought conditions. Combine with max_count = 1 to fire once.
cross_below -- Event-Based
What it does: Fires once, at the exact candle where StochRSI transitions from above the threshold to below it. The previous candle had StochRSI >= the target, and the current candle has StochRSI < the target.
On the chart: StochRSI pierces the 20 line from above to below. This single moment is the trigger -- it then goes silent until the next crossing.
[[actions.triggers]]
indicator = "stoch_rsi_14"
operator = "cross_below"
target = "20"
timeframe = "5m"
Typical use: Detect the moment StochRSI enters oversold territory. More precise than < because it fires exactly once per entry into the zone, making it useful for timing dip-buy entries without repeated signals.
cross_above -- Event-Based
What it does: Fires once, at the exact candle where StochRSI transitions from below the threshold to above it. The previous candle had StochRSI <= the target, and the current candle has StochRSI > the target.
On the chart: StochRSI climbing up through the 20 line from below. The moment it crosses, the trigger fires once.
[[actions.triggers]]
indicator = "stoch_rsi_14"
operator = "cross_above"
target = "20"
timeframe = "5m"
Typical use: Detect when StochRSI recovers from oversold. Instead of buying while the indicator is still falling, this waits for the first sign of reversal -- StochRSI turning back up through the oversold boundary. This is often a safer entry than raw < 10.
= (Equal) -- Not Recommended for StochRSI
Why: StochRSI produces floating-point values. Exact equality (e.g., stoch_rsi_14 = 50) will almost never match. Use < or > instead.
- Use
</>when you want to act while StochRSI is in an extreme zone (state-based). Always addmax_countto limit repeated firing. - Use
cross_above/cross_belowwhen you want to act at the moment StochRSI enters or leaves a zone (event-based). This is often the better choice for StochRSI because it naturally fires once per event.
TOML Examples
Buy on Deeply Oversold StochRSI
Catch short-term dips when StochRSI drops below 10 on the 5-minute chart. The max_count = 1 prevents repeated entries while StochRSI remains pinned near zero.
[[actions]]
type = "open_long"
amount = "50 USDC"

  [[actions.triggers]]
  indicator = "stoch_rsi_14"
  operator = "<"
  target = "10"
  timeframe = "5m"
  max_count = 1
Sell on Overbought StochRSI
Take profit when short-term momentum peaks. StochRSI above 85 on the 5-minute chart signals the move may be overextended.
[[actions]]
type = "sell"
amount = "100%"

  [[actions.triggers]]
  indicator = "stoch_rsi_14"
  operator = ">"
  target = "85"
  timeframe = "5m"
  max_count = 1
Buy on StochRSI Recovery (Cross Above 20)
Instead of buying while StochRSI is still falling, wait for the first sign of recovery. This catches the reversal rather than the bottom.
[[actions]]
type = "open_long"
amount = "75 USDC"

  [[actions.triggers]]
  indicator = "stoch_rsi_14"
  operator = "cross_above"
  target = "20"
  timeframe = "5m"
StochRSI with RSI Filter
Combine the sensitivity of StochRSI with the broader context of RSI. Only enter when StochRSI is deeply oversold and RSI confirms the broader momentum is also depressed. This filters out the many false signals StochRSI generates in trending markets.
[[actions]]
type = "open_long"
amount = "100 USDC"

  [[actions.triggers]]
  indicator = "stoch_rsi_14"
  operator = "<"
  target = "10"
  timeframe = "5m"
  max_count = 1

  [[actions.triggers]]
  indicator = "rsi_14"
  operator = "<"
  target = "40"
  timeframe = "1h"
Tips
StochRSI reaches 0 and 100 routinely -- sometimes multiple times per hour on low timeframes. By itself, a StochRSI extreme is a weak signal. Always combine it with at least one confirmation layer: a trend filter (sma_50 > sma_200), an RSI range check, or a higher-timeframe directional bias.
stoch_rsi_7 is extremely reactive and suitable for ultra-short scalping on 1m charts. Expect many signals, most of them marginal.
stoch_rsi_14 is the standard and the best starting point for most strategies. It balances sensitivity with signal quality.
stoch_rsi_21 smooths out the noise and produces fewer, more reliable signals. Good for 15m or 1h timeframes where you want fewer entries with higher conviction.
StochRSI shines on low timeframes (1m, 5m, 15m) where its sensitivity catches quick reversals. On higher timeframes like 4h or 1d, regular RSI is usually sufficient because momentum shifts play out over more candles. A powerful combination is StochRSI on 5m for entry timing with RSI on 1h for directional confirmation.
In a strong uptrend, StochRSI will repeatedly hit 0 and bounce -- producing oversold signals that look like dip-buy opportunities. But in a sustained downtrend, those dips keep getting deeper. Always gate StochRSI entries with a trend filter to avoid catching falling knives.
ROC -- Rate of Change
Contents
Overview
Rate of Change (ROC) measures the percentage change in price over the last N candles. It answers a simple question: how much has the price moved, in percentage terms, over a fixed lookback period?
The calculation is straightforward:
ROC = ((current_price - price_N_candles_ago) / price_N_candles_ago) * 100
- ROC of -5 means price has dropped 5% over the lookback period.
- ROC of 3 means price has risen 3% over the lookback period.
- ROC of 0 means price is unchanged.
Unlike bounded oscillators (RSI, StochRSI), ROC has no fixed range. It can be any positive or negative value. A flash crash could produce ROC of -20 or worse. This makes ROC uniquely suited for detecting the magnitude of price moves -- you set the threshold based on what you consider a significant move for the asset and timeframe you are trading.
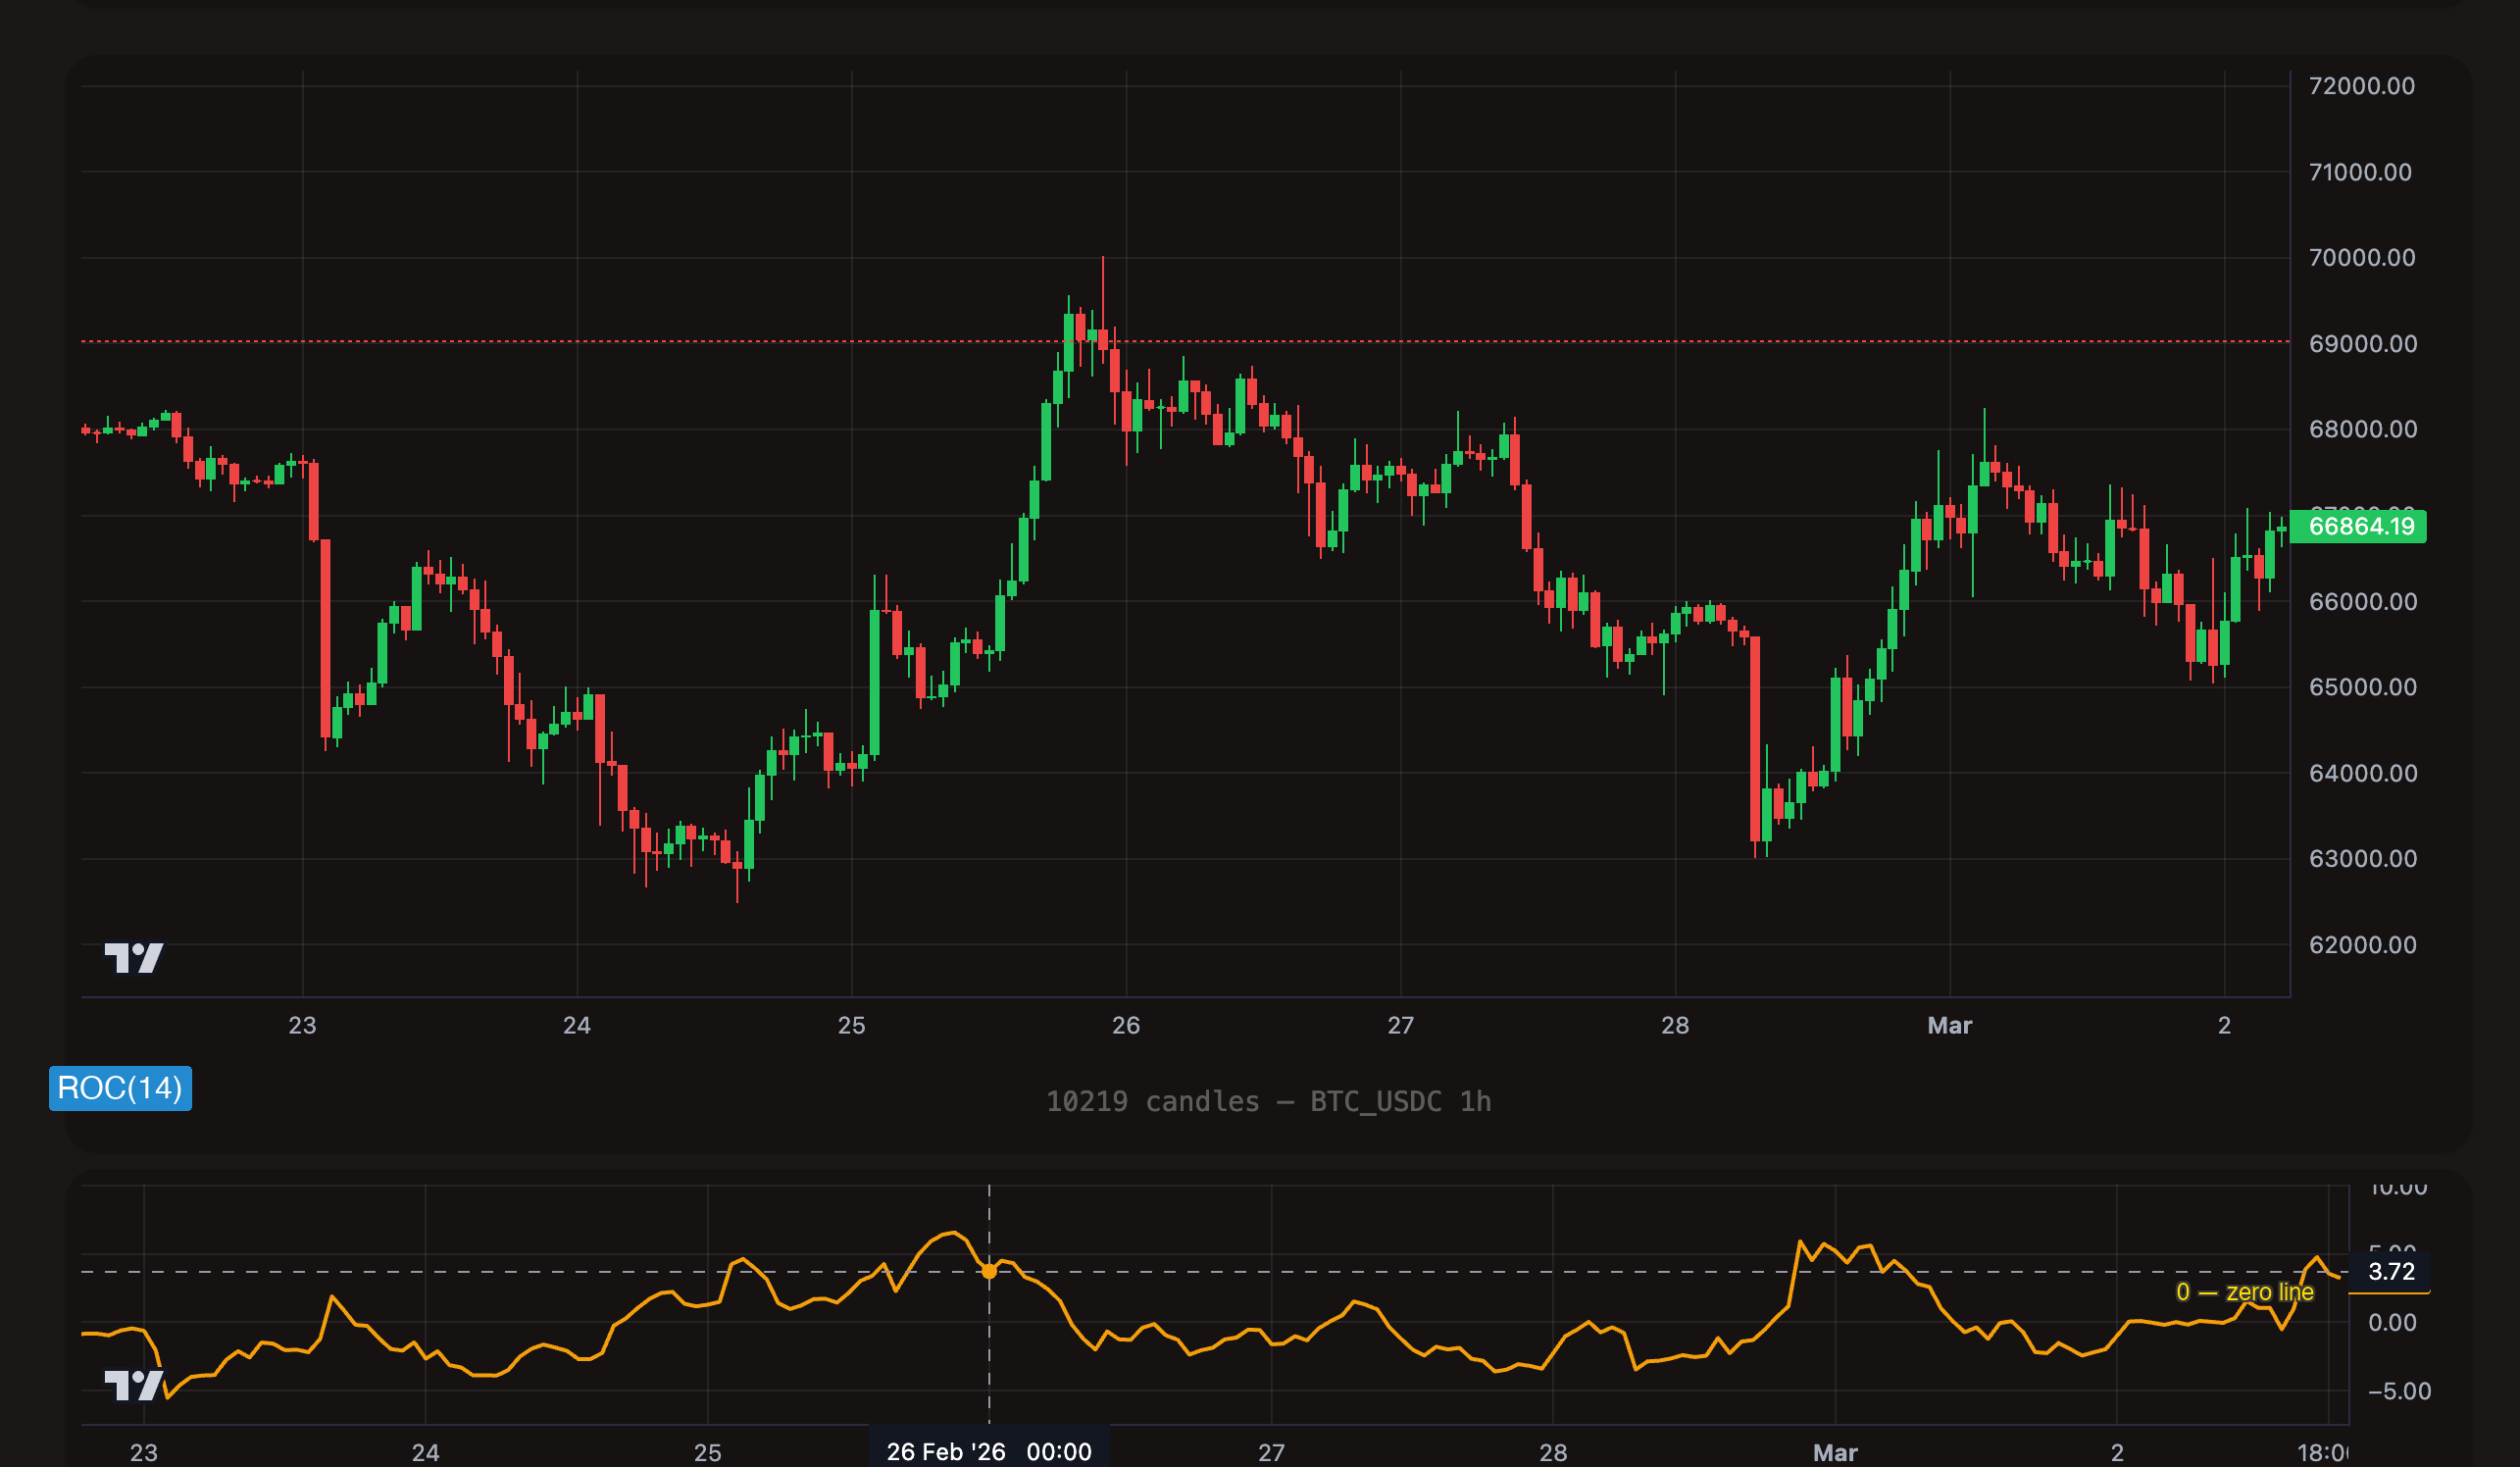
Format
roc_{period}
The period defines how many candles back ROC compares the current price to.
| Example | Period | Use Case |
|---|---|---|
roc_5 | 5 | Very short lookback -- captures sudden spikes and drops within minutes |
roc_10 | 10 | Standard short-term -- good balance of sensitivity and reliability |
roc_14 | 14 | Medium lookback -- smooths out noise, shows broader momentum |
roc_20 | 20 | Longer lookback -- measures sustained moves, fewer false signals |
Period range: 1 to 200.
Value range: Unbounded (any positive or negative number, expressed as a percentage).
ROC Interpretation
| ROC Range | Interpretation |
|---|---|
| Below -5 | Sharp drop -- crash-level dip. Price has fallen more than 5% over the lookback period. Strong potential buy-the-dip signal. |
| -5 to -3 | Significant dip -- meaningful downward momentum. Worth monitoring or entering with confirmation. |
| -3 to 0 | Mild bearish -- price is drifting lower but not at an unusual rate. |
| 0 | Unchanged -- price is exactly where it was N candles ago. |
| 0 to 3 | Mild bullish -- price is drifting higher but not at an unusual rate. |
| 3 to 5 | Significant pump -- meaningful upward momentum. May signal strength or overextension. |
| Above 5 | Sharp rally -- price has risen more than 5% over the lookback period. Potential overbought or breakout confirmation. |
The thresholds above are general guidelines. What constitutes a "significant" move depends entirely on the asset and timeframe. A 3% ROC on a 15-minute chart for BTC is a major move. A 3% ROC on a daily chart for a small-cap altcoin may be routine. Calibrate your thresholds through backtesting on the specific pair and timeframe you trade.
Understanding Operators with ROC
Each operator behaves differently with ROC. Because ROC is unbounded, careful threshold selection is critical.
< (Less Than) -- State-Based
What it does: The trigger is true on every candle where ROC is below the threshold.
On the chart: Price has been dropping. ROC dips below your threshold (say, -5). For every candle that ROC remains below -5, this trigger fires. This captures the entire duration of the dip, not just the initial plunge.
[[actions.triggers]]
indicator = "roc_10"
operator = "<"
target = "-5"
timeframe = "15m"
During a sustained crash, ROC can stay deeply negative for many candles. Using < without max_count will fire on every single one, potentially opening many positions into a falling market. Always use max_count or combine with a recovery signal.
> (Greater Than) -- State-Based
What it does: The trigger is true on every candle where ROC is above the threshold.
On the chart: Price has been rising. ROC exceeds your threshold (say, 3). Every candle it stays above 3, this trigger fires.
[[actions.triggers]]
indicator = "roc_10"
operator = ">"
target = "3"
timeframe = "15m"
Typical use: Momentum confirmation for exits -- sell when upward momentum is strong. Or as a breakout filter -- only enter when price is moving decisively upward.
cross_below -- Event-Based
What it does: Fires once, at the exact candle where ROC transitions from above the threshold to below it. The previous candle had ROC >= the target, and the current candle has ROC < the target.
On the chart: ROC was hovering above zero and suddenly drops below zero. The moment it crosses the line, the trigger fires once.
[[actions.triggers]]
indicator = "roc_10"
operator = "cross_below"
target = "0"
timeframe = "1h"
Typical use: Detect the zero-line crossing. ROC crossing below 0 means price is now lower than it was N candles ago -- momentum has turned negative. This is a clean trend-change signal without the noise of staying in a zone.
cross_above -- Event-Based
What it does: Fires once, at the exact candle where ROC transitions from below the threshold to above it. The previous candle had ROC <= the target, and the current candle has ROC > the target.
On the chart: ROC was negative and climbs back above zero. The crossing moment is the trigger.
[[actions.triggers]]
indicator = "roc_10"
operator = "cross_above"
target = "0"
timeframe = "1h"
Typical use: Detect momentum recovery. ROC crossing above 0 means price is now higher than it was N candles ago -- momentum has turned positive. This signals the beginning of a potential upward move.
= (Equal) -- Not Recommended for ROC
Why: ROC produces floating-point values. Exact equality (e.g., roc_10 = 0) will almost never be true because ROC values are calculated to many decimal places. Use cross_above or cross_below with a target of 0 to detect zero-line crossings instead.
- Use
<for dip buying -- "price has dropped X%." Addmax_countto avoid stacking entries during prolonged drops. - Use
>for momentum confirmation or overbought exits. - Use
cross_above/cross_belowwith target0for clean trend-change signals at the zero line.
TOML Examples
Buy After a Sharp Dip
Enter when price has dropped 5% over the last 10 candles on the 15-minute chart. This targets sharp, rapid dips that often precede bounces.
[[actions]]
type = "open_long"
amount = "100 USDC"

  [[actions.triggers]]
  indicator = "roc_10"
  operator = "<"
  target = "-5"
  timeframe = "15m"
  max_count = 1
Sell When Momentum Weakens
Exit the position when upward momentum fades. ROC crossing below 0 means the recent rally has stalled and price is now below where it was 10 candles ago.
[[actions]]
type = "sell"
amount = "100%"

  [[actions.triggers]]
  indicator = "roc_10"
  operator = "cross_below"
  target = "0"
  timeframe = "1h"
Buy on Zero-Line Recovery
Wait for ROC to cross back above zero after a dip. This confirms that the price drop is over and momentum is turning positive, rather than trying to catch a still-falling knife.
[[actions]]
type = "open_long"
amount = "75 USDC"

  [[actions.triggers]]
  indicator = "roc_10"
  operator = "cross_above"
  target = "0"
  timeframe = "15m"
Sharp Dip with Consecutive Candle Confirmation
Combine ROC with a consecutive red candles trigger for higher-conviction dip entries. This fires only when price has dropped 3% and there have been 5 consecutive bearish candles -- confirming a real sell-off rather than a single volatile candle.
[[actions]]
type = "open_long"
amount = "100 USDC"

  [[actions.triggers]]
  indicator = "roc_10"
  operator = "<"
  target = "-3"
  timeframe = "15m"
  max_count = 1

  [[actions.triggers]]
  type = "consecutive_candles"
  direction = "bearish"
  count = 5
  timeframe = "15m"
Tips
A 5% drop in BTC over 10 candles on the 15-minute chart is a significant event. The same 5% drop for a small-cap altcoin might happen daily. Backtest your ROC thresholds on the specific trading pair to understand what constitutes a "significant" move for that asset and timeframe.
ROC works best on shorter periods (5--10) for dip-buying strategies because it captures rapid price changes. Longer periods (20+) smooth out the signal and are better suited for identifying broader trend shifts via zero-line crossovers.
ROC crossing above zero means the asset is now trading higher than it was N candles ago. ROC crossing below zero means the opposite. These zero-line crossovers are clean, event-based trend signals that pair well with other entry conditions. Use cross_above with target 0 for bullish confirmation, cross_below with target 0 for bearish confirmation.
During sudden market crashes, ROC can reach extreme negative values (-10, -15, or worse). While these can be excellent dip-buy opportunities, they can also be the beginning of a much larger move. Never rely solely on ROC magnitude for entries during high-volatility events. Combine with a trend filter or wait for a cross_above 0 recovery signal before entering.
ATR -- Average True Range
Contents
Overview
Average True Range (ATR) measures the average range of price movement over the last N candles. It tells you how much the price typically moves per candle -- it measures volatility, not direction.
ATR uses "True Range" rather than simple high-low range. True Range accounts for gaps between candles by taking the maximum of:
- Current high minus current low
- Absolute value of current high minus previous close
- Absolute value of current low minus previous close
This ensures that a gap-up or gap-down is reflected as volatility even if the current candle's body is small.
The key insight about ATR:
- High ATR means the market is making large moves per candle -- high volatility. More risk and more reward per trade.
- Low ATR means the market is quiet -- low volatility. Prices are moving in small increments. Breakouts from low-ATR environments can be explosive.
- ATR says nothing about direction. A high ATR during a crash is the same as a high ATR during a rally. It only measures the size of moves, not whether they are up or down.
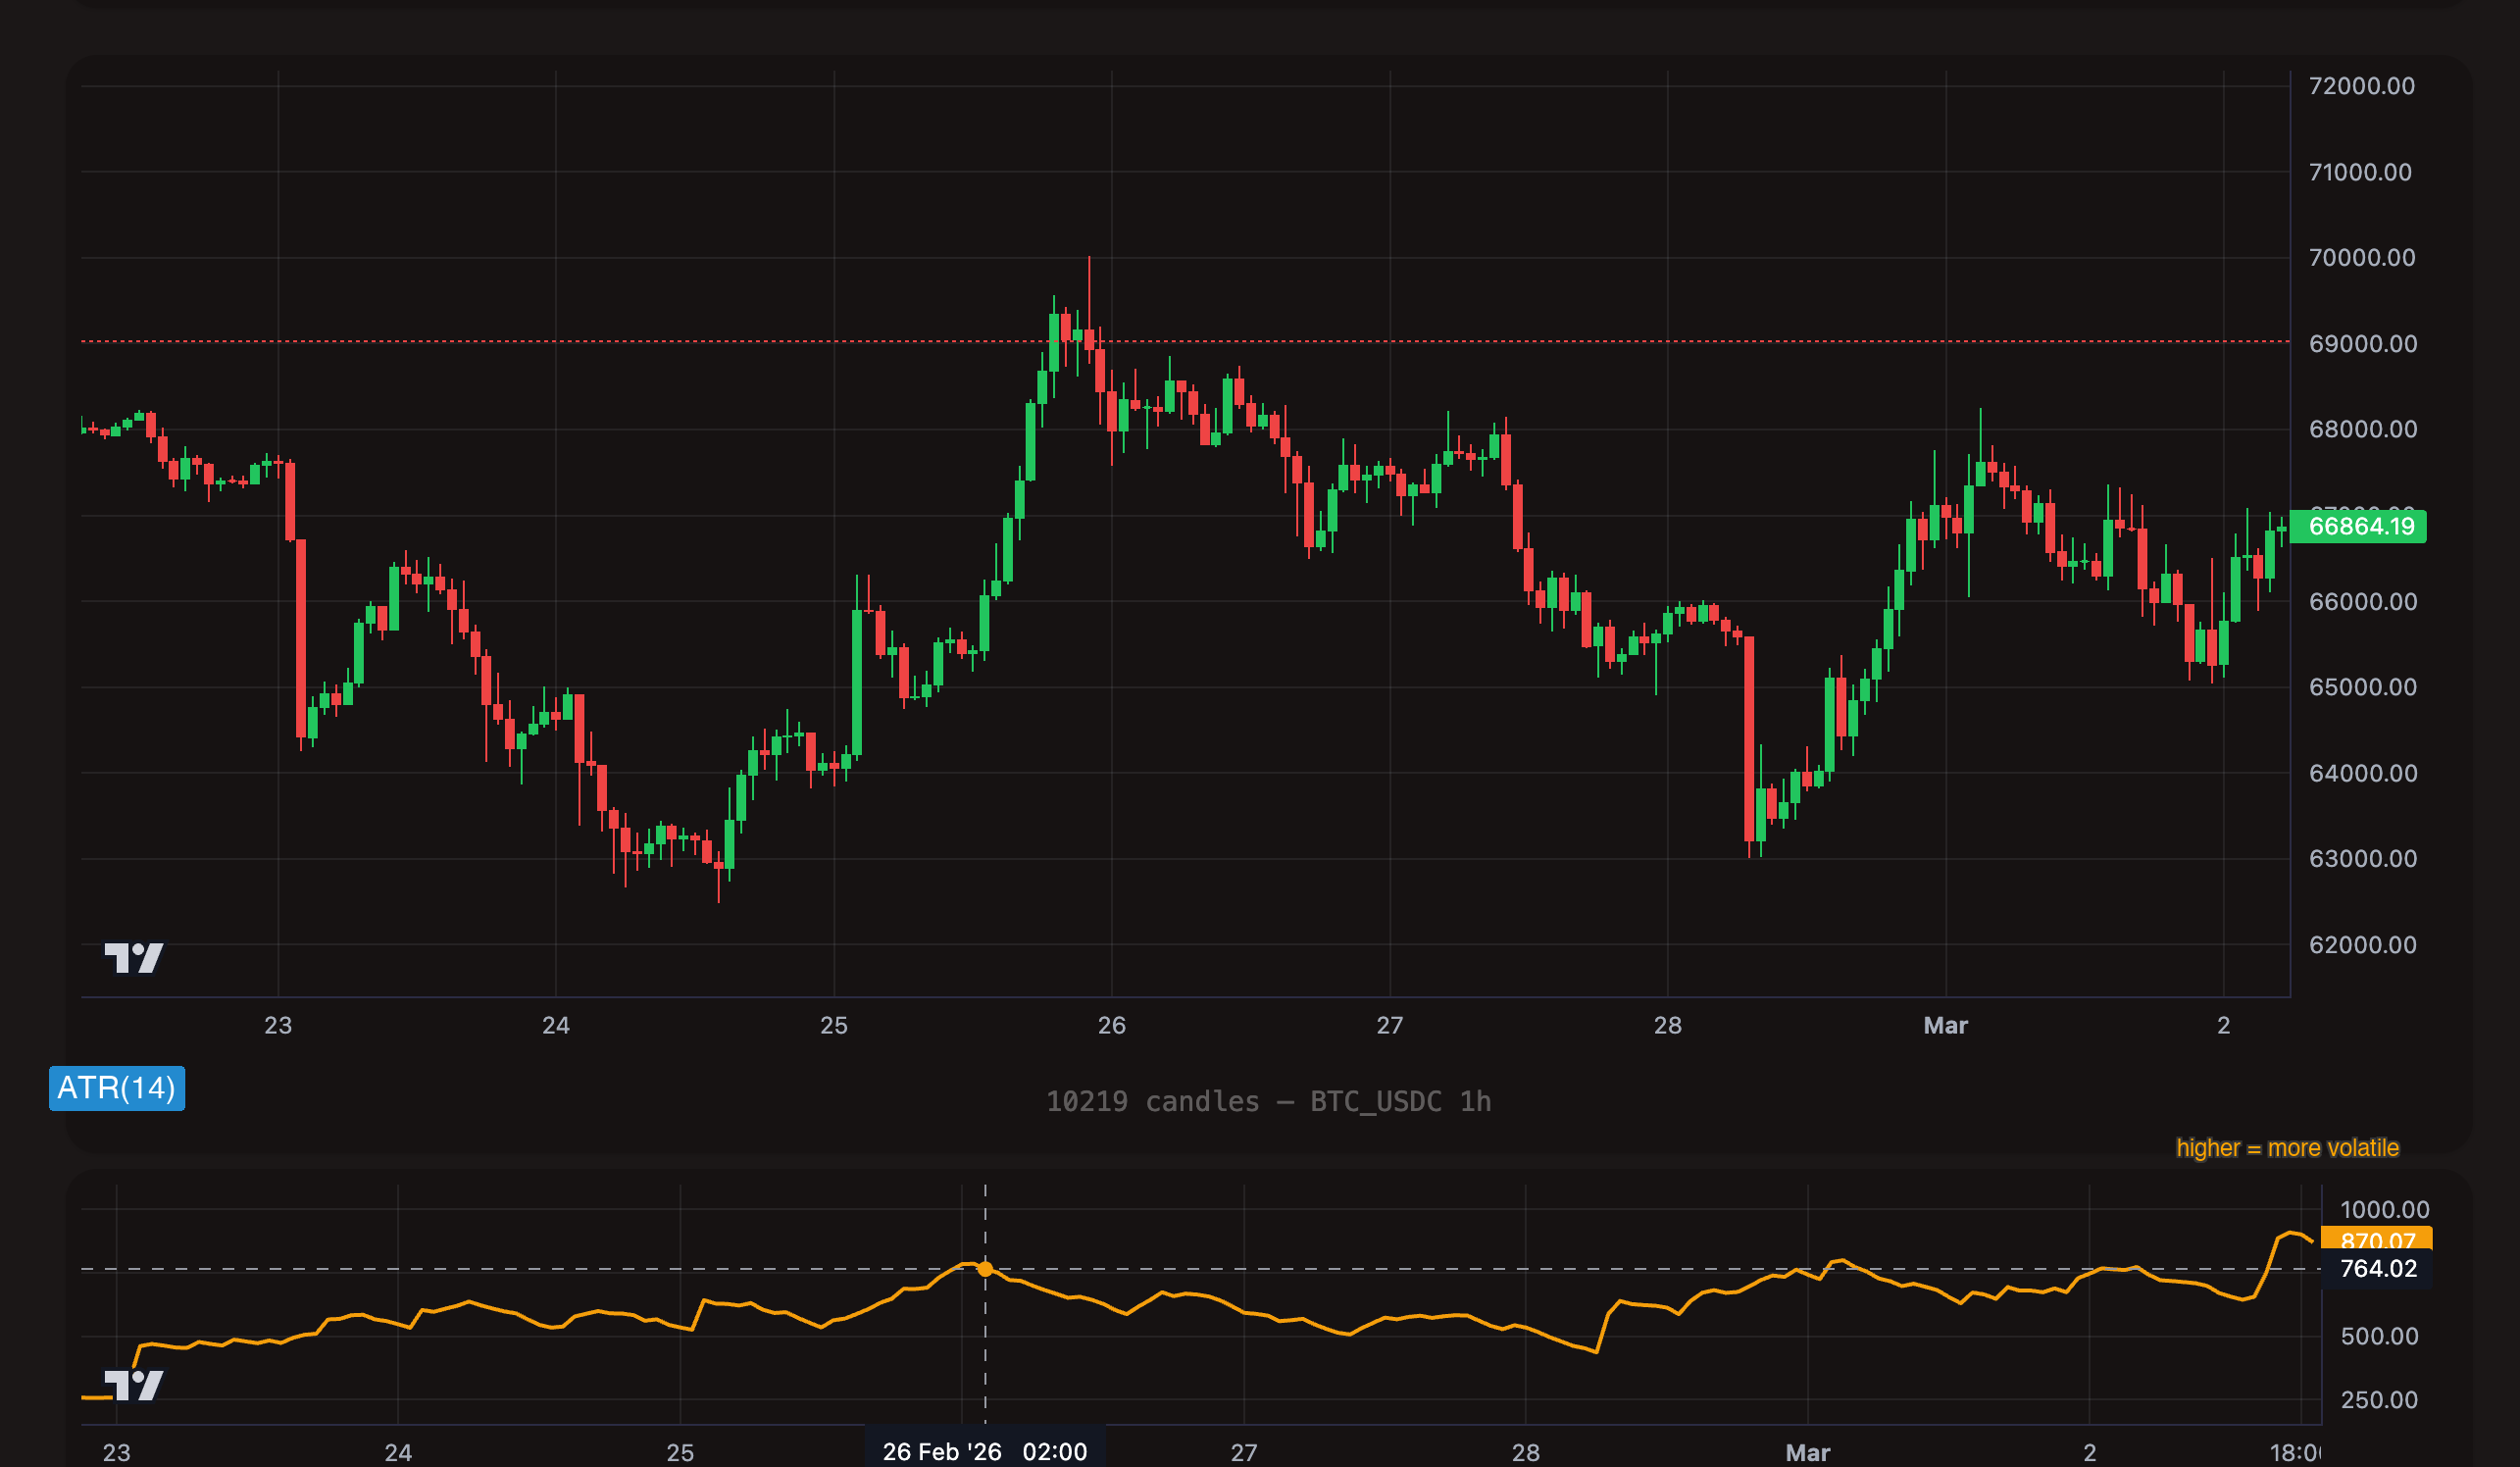
Format
atr_{period}
The period defines how many candles ATR averages the True Range over.
| Example | Period | Use Case |
|---|---|---|
atr_7 | 7 | Fast, reactive -- tracks recent volatility shifts quickly |
atr_14 | 14 | Standard -- the most common period, smooth and reliable |
atr_20 | 20 | Slower -- better for filtering out short-term volatility spikes |
Period range: 1 to 200.
Value range: 0 to infinity (always positive, denominated in the asset's price currency).
Understanding ATR Values
Unlike RSI or StochRSI, ATR values are not normalized to a fixed scale. They are expressed in the same units as the asset's price. This has a critical implication: ATR thresholds must be set relative to the asset and timeframe you are trading.
| Asset | Timeframe | Typical ATR(14) Range | What It Means |
|---|---|---|---|
| BTC/USDC | 1h | 200 -- 800 | BTC typically moves $200--$800 per hour |
| BTC/USDC | 1d | 1,000 -- 3,000 | BTC typically moves $1,000--$3,000 per day |
| ETH/USDC | 1h | 15 -- 60 | ETH typically moves $15--$60 per hour |
| SOL/USDC | 1h | 0.50 -- 3.00 | SOL typically moves $0.50--$3.00 per hour |
The values in the table above are illustrative and will vary with market conditions. During bull runs or crisis events, ATR can be 3--5x its typical range. Always check recent ATR values for your specific trading pair before setting thresholds. Use backtesting to calibrate.
Understanding Operators with ATR
Each operator behaves differently with ATR. Because ATR is a filter indicator (it describes market conditions, not trading signals), it is almost always used in combination with other triggers.
> (Greater Than) -- State-Based
What it does: The trigger is true on every candle where ATR is above the threshold.
On the chart: Volatility is elevated. The market is making large moves per candle. This trigger stays active for as long as ATR remains above the threshold.
[[actions.triggers]]
indicator = "atr_14"
operator = ">"
target = "500"
timeframe = "1h"
Typical use: "Only trade when the market is volatile enough." High ATR means there is enough price movement to make a trade worthwhile. If ATR is too low, the profit potential may not justify the spread and fees.
< (Less Than) -- State-Based
What it does: The trigger is true on every candle where ATR is below the threshold.
On the chart: Volatility is compressed. The market is quiet, moving in small increments. This is often called a "volatility squeeze."
[[actions.triggers]]
indicator = "atr_14"
operator = "<"
target = "200"
timeframe = "1h"
Typical use: Detect low-volatility environments. Extended periods of low ATR often precede explosive breakouts. Some strategies wait for a squeeze (low ATR) and then enter on a directional signal, expecting the breakout to produce outsized moves.
cross_above -- Event-Based
What it does: Fires once, at the exact candle where ATR transitions from below the threshold to above it. The previous candle had ATR <= the target, and the current candle has ATR > the target.
[[actions.triggers]]
indicator = "atr_14"
operator = "cross_above"
target = "400"
timeframe = "1h"
Typical use: Detect the moment volatility expands. This captures the transition from a quiet market to an active one -- a potential breakout is underway. Combine with a directional indicator to determine whether to go long or short.
cross_below -- Event-Based
What it does: Fires once, at the exact candle where ATR transitions from above the threshold to below it. The previous candle had ATR >= the target, and the current candle has ATR < the target.
[[actions.triggers]]
indicator = "atr_14"
operator = "cross_below"
target = "300"
timeframe = "1h"
Typical use: Detect the moment volatility contracts. This captures the transition from an active market to a quiet one. Can be used to exit positions if you only want to be in trades during volatile periods, or to start watching for squeeze-breakout setups.
= (Equal) -- Not Recommended for ATR
Why: ATR produces floating-point values that are rarely exactly equal to any specific number. Use > or < instead.
- Use
>to ensure volatility is high enough for profitable trading. This is the most common ATR operator. - Use
<to detect low-volatility squeezes that often precede breakouts. - Use
cross_above/cross_belowto detect the exact moment a volatility regime changes.
TOML Examples
Only Trade When Volatility Is Elevated
Use ATR as a gate on an RSI dip-buy strategy. Only enter when ATR confirms the market is moving enough to make the trade worthwhile.
[[actions]]
type = "open_long"
amount = "100 USDC"

  [[actions.triggers]]
  indicator = "rsi_14"
  operator = "<"
  target = "30"
  timeframe = "1h"

  [[actions.triggers]]
  indicator = "atr_14"
  operator = ">"
  target = "500"
  timeframe = "1h"
Low Volatility Squeeze Detection
Identify compression periods where the market is unusually quiet. When ATR drops below the threshold and then a directional breakout occurs (price breaks above the upper Bollinger Band), enter the trade.
[[actions]]
type = "open_long"
amount = "100 USDC"

  [[actions.triggers]]
  indicator = "atr_14"
  operator = "<"
  target = "200"
  timeframe = "1h"

  [[actions.triggers]]
  indicator = "price"
  operator = ">"
  target = "bb_upper"
  timeframe = "1h"
ATR Filter Combined with RSI Entry
A comprehensive dip-buying strategy: only buy when RSI is oversold, ATR shows sufficient volatility (so the bounce potential is meaningful), and the daily trend is bullish.
[[actions]]
type = "open_long"
amount = "100 USDC"

  [[actions.triggers]]
  indicator = "rsi_14"
  operator = "<"
  target = "35"
  timeframe = "1h"

  [[actions.triggers]]
  indicator = "atr_14"
  operator = ">"
  target = "400"
  timeframe = "1h"

  [[actions.triggers]]
  indicator = "sma_50"
  operator = ">"
  target = "sma_200"
  timeframe = "1d"
Volatility Regime Change
Detect the moment volatility expands from a quiet period. When ATR crosses above the threshold, it signals that the market is waking up -- combine with momentum direction for entry.
[[actions]]
type = "open_long"
amount = "75 USDC"

  [[actions.triggers]]
  indicator = "atr_14"
  operator = "cross_above"
  target = "400"
  timeframe = "1h"

  [[actions.triggers]]
  indicator = "roc_10"
  operator = ">"
  target = "1"
  timeframe = "1h"
Tips
ATR measures the size of price moves, not their direction. An ATR of 500 during a crash is the same as an ATR of 500 during a rally. Never use ATR as a buy or sell signal on its own. It is a filter -- it tells you whether conditions are right for trading, not which direction to trade.
You cannot use the same ATR threshold for BTC and SOL. BTC's ATR(14) on the hourly chart might be 500, while SOL's might be 1.50. Always calibrate your ATR thresholds by checking the indicator's recent values for the specific pair and timeframe. Backtesting is the best way to find appropriate thresholds.
One of the most powerful ATR patterns is the squeeze breakout. When ATR drops to unusually low levels (the market goes quiet), it often precedes an explosive move. Combine low ATR (atr_14 < threshold) with a directional breakout trigger (e.g., price > bb_upper or roc_10 > 2) to catch these moves early.
In flat, choppy markets, dip-buy signals from RSI or StochRSI often lead to tiny bounces that barely cover fees. Adding an ATR floor (atr_14 > threshold) to your entry triggers ensures you only trade when price is moving enough to produce meaningful profits.
Parkinson Volatility -- Parkinson Historical Volatility Estimator
Contents
Overview
Parkinson Volatility is a historical volatility estimator that uses only the high and low prices of each candle. It was developed by physicist Michael Parkinson in 1980 as a more efficient alternative to the traditional close-to-close volatility calculation.
The formula is:
Parkinson = sqrt( (1 / (4 * N * ln(2))) * sum( ln(H_i / L_i) )^2 )
Where H_i and L_i are the high and low prices for each candle, and N is the lookback period. The result is an annualized volatility estimate.
The key insight: Parkinson volatility is approximately 5x more efficient than close-to-close volatility. "Efficient" here means it extracts more information from the same amount of data. Consider a candle with a huge wick -- price spiked up and came back down, closing near its open. A close-to-close volatility estimator sees almost no movement. Parkinson catches the full intraday range, revealing the true volatility that close-only methods miss entirely. This makes it exceptionally useful for detecting volatility squeezes and expansions in cryptocurrency markets where wicks are common.
Format
parkinson_{period}
The period defines how many candles the estimator averages over.
| Example | Period | Use Case |
|---|---|---|
parkinson_10 | 10 | Short-term -- reactive to recent volatility shifts |
parkinson_20 | 20 | Standard -- good balance of smoothness and responsiveness |
parkinson_50 | 50 | Long-term -- captures the broader volatility regime |
Period range: 5 to 500.
Value range: 0 to infinity (annualized volatility, always positive). Typical crypto range: 0.005 to 0.10.
Understanding Parkinson Values
Parkinson values are annualized volatility estimates expressed as decimals. They are not normalized to a fixed scale like RSI. The values depend on the asset, timeframe, and current market conditions.
| Parkinson Range | Interpretation |
|---|---|
| Below 0.01 | Ultra-low volatility -- the market is barely moving. A squeeze is in effect. Breakout potential is high. |
| 0.01 -- 0.03 | Low volatility -- calm market conditions. Good environment for squeeze-based strategies. |
| 0.03 -- 0.06 | Moderate volatility -- normal trading conditions for most crypto pairs. |
| 0.06 -- 0.10 | High volatility -- the market is making large intraday moves. Elevated risk and reward. |
| Above 0.10 | Extreme volatility -- crisis-level moves. Caution advised for new entries. |
The ranges above are general guidelines for major crypto pairs on hourly timeframes. Smaller-cap altcoins will typically show higher Parkinson values even in calm markets. Always calibrate thresholds through backtesting on your specific trading pair and timeframe.
Understanding Operators with Parkinson
Each operator behaves differently with Parkinson volatility. Because Parkinson is a filter indicator (it describes market conditions, not trading direction), it is almost always used in combination with directional triggers.
< (Less Than) -- State-Based
What it does: The trigger is true on every candle where Parkinson volatility is below the threshold.
On the chart: Volatility is compressed. Candle ranges are small and consistent. The market is in a squeeze state, which often precedes explosive breakouts.
[[actions.triggers]]
indicator = "parkinson_20"
operator = "<"
target = "0.02"
timeframe = "1h"
Typical use: Detect volatility squeezes. When Parkinson drops to unusually low levels, the market is coiling. Combine with a directional trigger (RSI dip, EMA cross, Bollinger breakout) to enter at the moment the squeeze resolves.
> (Greater Than) -- State-Based
What it does: The trigger is true on every candle where Parkinson volatility is above the threshold.
On the chart: Volatility is elevated. Candles have large ranges with significant wicks. The market is making big moves.
[[actions.triggers]]
indicator = "parkinson_20"
operator = ">"
target = "0.07"
timeframe = "1h"
Typical use: High-volatility filter. Use > to either (1) avoid entering new positions during chaotic markets, or (2) only trade when volatility is high enough for profitable moves. The interpretation depends on your strategy design.
cross_below -- Event-Based
What it does: Fires once, at the exact candle where Parkinson transitions from above the threshold to below it. The previous candle had Parkinson >= the target, and the current candle has Parkinson < the target.
[[actions.triggers]]
indicator = "parkinson_20"
operator = "cross_below"
target = "0.03"
timeframe = "1h"
Typical use: Detect the moment the market enters a squeeze. Volatility has just dropped below your calm-market threshold. This signals the beginning of a compression phase -- start watching for directional breakout triggers.
cross_above -- Event-Based
What it does: Fires once, at the exact candle where Parkinson transitions from below the threshold to above it. The previous candle had Parkinson <= the target, and the current candle has Parkinson > the target.
[[actions.triggers]]
indicator = "parkinson_20"
operator = "cross_above"
target = "0.05"
timeframe = "1h"
Typical use: Detect the moment volatility expands. The market was quiet and has just started making larger moves. This often marks the beginning of a trending phase -- combine with a momentum indicator to determine direction.
= (Equal) -- Not Recommended for Parkinson
Why: Parkinson produces floating-point values calculated to many decimal places. Exact equality will almost never be true. Use < or > instead.
- Use
<to detect volatility squeezes -- the most common Parkinson operator. Low Parkinson = calm market = breakout potential. - Use
>to filter out chaotic markets or to require sufficient volatility for profitable trades. - Use
cross_below/cross_aboveto detect the exact moment a volatility regime changes.
TOML Examples
Low Volatility Squeeze with Bullish RSI
When Parkinson volatility is ultra-low (squeeze) and RSI signals oversold conditions, enter long. The logic: a quiet market with a dip often precedes a strong bounce.
[[actions]]
type = "open_long"
amount = "100 USDC"

  [[actions.triggers]]
  indicator = "parkinson_20"
  operator = "<"
  target = "0.02"
  timeframe = "1h"

  [[actions.triggers]]
  indicator = "rsi_14"
  operator = "<"
  target = "35"
  timeframe = "1h"
High Volatility Filter -- Avoid Entry
Use Parkinson as a safety gate. Only enter when volatility is not extreme. This protects against buying into violent, unpredictable markets.
[[actions]]
type = "open_long"
amount = "100 USDC"

  [[actions.triggers]]
  indicator = "rsi_14"
  operator = "cross_above"
  target = "30"
  timeframe = "1h"

  [[actions.triggers]]
  indicator = "parkinson_20"
  operator = "<"
  target = "0.08"
  timeframe = "1h"
Squeeze Breakout with Trend Confirmation
Wait for the market to be in a volatility squeeze, then enter when price breaks above the upper Bollinger Band with a bullish daily trend.
[[actions]]
type = "open_long"
amount = "100 USDC"

  [[actions.triggers]]
  indicator = "parkinson_20"
  operator = "<"
  target = "0.025"
  timeframe = "1h"

  [[actions.triggers]]
  indicator = "price"
  operator = ">"
  target = "bb_upper"
  timeframe = "1h"

  [[actions.triggers]]
  indicator = "sma_50"
  operator = ">"
  target = "sma_200"
  timeframe = "1d"
Volatility Compression DCA
During ultra-calm markets, dollar-cost average into positions. When the squeeze resolves, you will have accumulated at compressed prices.
[[actions]]
type = "open_long"
amount = "50 USDC"

  [[actions.triggers]]
  indicator = "parkinson_50"
  operator = "<"
  target = "0.015"
  timeframe = "4h"
  max_count = 3
Tips
Parkinson uses the full high-low range of each candle, making it more sensitive to wick-heavy price action than ATR. In crypto markets where candles frequently have large wicks that close near the open, Parkinson reveals the true intraday volatility that ATR and close-to-close methods underestimate. If you see calm ATR but elevated Parkinson, the market is quietly volatile -- large moves are happening within candles but not persisting across them.
Parkinson values vary enormously between assets. BTC/USDC on the 1-hour chart might have a typical Parkinson of 0.03, while a small-cap altcoin might sit at 0.08 in the same conditions. Always backtest on your specific pair and timeframe to determine what constitutes "low" and "high" volatility. Never copy thresholds from one asset to another without recalibrating.
Parkinson uses only high and low prices. Garman-Klass adds open and close information. Yang-Zhang adds overnight drift. Using all three together gives you a comprehensive volatility profile. If all three estimators agree that volatility is low, you have high-confidence squeeze detection. If they diverge, the type of divergence reveals what kind of volatility the market is experiencing.
Parkinson volatility assumes that the underlying asset has zero drift (no trending behavior). In a strongly trending market, Parkinson can underestimate true volatility because the consistent directional movement is not fully captured by the high-low range alone. For trending markets, consider using Yang-Zhang volatility which accounts for drift.
GK Vol -- Garman-Klass Volatility Estimator
Contents
Overview
Garman-Klass Volatility is the most efficient single-estimator for historical volatility because it uses all four OHLC prices -- open, high, low, and close -- from each candle. Developed by Mark Garman and Michael Klass in 1980, it extracts the maximum amount of volatility information from standard OHLC data.
The formula incorporates two components:
GK = sqrt( (1/N) * sum( 0.5 * ln(H/L)^2 - (2*ln(2) - 1) * ln(C/O)^2 ) )
The first term ln(H/L)^2 captures the intraday range (similar to Parkinson). The second term ln(C/O)^2 captures the open-to-close movement. By combining both, Garman-Klass achieves approximately 7.4x the efficiency of close-to-close volatility -- meaning it produces equally accurate estimates with far fewer data points.
This makes Garman-Klass the gold standard among single-estimator volatility measures. It is strictly better than Parkinson because it uses additional information (open and close) at no extra cost. The only limitation it does not address is overnight gaps -- the drift between one candle's close and the next candle's open. For that, you need Yang-Zhang volatility.
Format
gk_vol_{period}
The period defines how many candles the estimator averages over.
| Example | Period | Use Case |
|---|---|---|
gk_vol_10 | 10 | Short-term -- tracks recent volatility changes quickly |
gk_vol_20 | 20 | Standard -- the recommended default for most strategies |
gk_vol_50 | 50 | Long-term -- captures the broader volatility regime, very smooth |
Period range: 5 to 500.
Value range: 0 to infinity (annualized volatility, always positive). Typical crypto range: 0.005 to 0.15.
Understanding GK Vol Values
Like Parkinson, GK Vol values are annualized volatility estimates expressed as decimals. They are not bounded to a fixed range. Values depend on the asset, timeframe, and market conditions.
| GK Vol Range | Interpretation |
|---|---|
| Below 0.01 | Ultra-low volatility -- extreme squeeze. The market is barely moving on any dimension (range or body). Strong breakout potential. |
| 0.01 -- 0.04 | Low volatility -- calm, orderly market. Ideal environment for squeeze-based entry strategies. |
| 0.04 -- 0.08 | Moderate volatility -- normal trading conditions for major crypto pairs. Healthy for trend-following strategies. |
| 0.08 -- 0.15 | High volatility -- large moves with significant candle bodies and wicks. Elevated risk per trade. |
| Above 0.15 | Extreme volatility -- crisis or euphoria. Exercise extreme caution with new entries. |
GK Vol tends to produce slightly higher values than Parkinson because it incorporates the open-close component. Do not use Parkinson thresholds for GK Vol directly -- recalibrate through backtesting. The ranges above are approximate for major crypto pairs on hourly timeframes.
Understanding Operators with GK Vol
Each operator behaves differently with GK Vol. As a filter indicator measuring market conditions rather than direction, GK Vol is almost always combined with directional triggers.
< (Less Than) -- State-Based
What it does: The trigger is true on every candle where GK Vol is below the threshold.
On the chart: Volatility is compressed across all dimensions -- small wicks and small candle bodies. The market is coiling. This state-based trigger stays active for as long as GK Vol remains below the threshold.
[[actions.triggers]]
indicator = "gk_vol_20"
operator = "<"
target = "0.03"
timeframe = "1h"
Typical use: Squeeze detection. When GK Vol is low, both the range and the body of candles are small. This is an even more comprehensive squeeze signal than Parkinson alone, because it confirms that neither the wicks nor the closes are showing significant movement.
> (Greater Than) -- State-Based
What it does: The trigger is true on every candle where GK Vol is above the threshold.
On the chart: Volatility is elevated. Candles have large bodies, large wicks, or both. The market is making decisive moves.
[[actions.triggers]]
indicator = "gk_vol_20"
operator = ">"
target = "0.08"
timeframe = "1h"
Typical use: High-volatility filter. Either avoid entries during chaotic conditions, or require that enough volatility exists for trades to be profitable after fees and slippage.
cross_below -- Event-Based
What it does: Fires once, at the exact candle where GK Vol transitions from above the threshold to below it. The previous candle had GK Vol >= the target, and the current candle has GK Vol < the target.
[[actions.triggers]]
indicator = "gk_vol_20"
operator = "cross_below"
target = "0.04"
timeframe = "1h"
Typical use: Detect the transition into a low-volatility regime. The market has just calmed down after a volatile period. This can signal the beginning of a consolidation phase that will eventually resolve with a breakout.
cross_above -- Event-Based
What it does: Fires once, at the exact candle where GK Vol transitions from below the threshold to above it. The previous candle had GK Vol <= the target, and the current candle has GK Vol > the target.
[[actions.triggers]]
indicator = "gk_vol_20"
operator = "cross_above"
target = "0.06"
timeframe = "1h"
Typical use: Detect the moment volatility expands. This captures the exact transition from a quiet market to an active one. A volatility expansion often marks the start of a new trend -- combine with a directional indicator (RSI, ROC, EMA cross) to determine which side to trade.
= (Equal) -- Not Recommended for GK Vol
Why: GK Vol produces floating-point values calculated to many decimal places. Exact equality will almost never be true. Use < or > instead.
- Use
<for squeeze detection -- low GK Vol means the market is quiet on all fronts. - Use
>to filter for sufficient volatility or to block entries during chaos. - Use
cross_below/cross_aboveto detect the exact moment a volatility regime shifts.
TOML Examples
Moderate Volatility with Trend Entry
Enter when GK Vol shows the market is in a healthy range (not too quiet, not too chaotic) and the EMA signals a bullish trend.
[[actions]]
type = "open_long"
amount = "100 USDC"

  [[actions.triggers]]
  indicator = "gk_vol_20"
  operator = ">"
  target = "0.02"
  timeframe = "1h"

  [[actions.triggers]]
  indicator = "gk_vol_20"
  operator = "<"
  target = "0.08"
  timeframe = "1h"

  [[actions.triggers]]
  indicator = "ema_21"
  operator = ">"
  target = "ema_55"
  timeframe = "1h"
GK Vol Band Filter -- Goldilocks Zone
Only trade when volatility is in the "goldilocks zone" -- enough movement for profitable trades, but not so much that risk is uncontrollable. Combine with an RSI dip entry.
[[actions]]
type = "open_long"
amount = "100 USDC"

  [[actions.triggers]]
  indicator = "gk_vol_20"
  operator = ">"
  target = "0.025"
  timeframe = "1h"

  [[actions.triggers]]
  indicator = "gk_vol_20"
  operator = "<"
  target = "0.07"
  timeframe = "1h"

  [[actions.triggers]]
  indicator = "rsi_14"
  operator = "<"
  target = "30"
  timeframe = "1h"
EMA Cross with Volatility Confirmation
Only act on an EMA crossover when GK Vol confirms the market has enough energy for the trend to follow through.
[[actions]]
type = "open_long"
amount = "100 USDC"

  [[actions.triggers]]
  indicator = "ema_9"
  operator = "cross_above"
  target = "ema_21"
  timeframe = "1h"

  [[actions.triggers]]
  indicator = "gk_vol_20"
  operator = ">"
  target = "0.03"
  timeframe = "1h"
Volatility Regime Change Detection
Detect the exact moment the market transitions from low to higher volatility. When GK Vol crosses above the threshold while momentum is positive, ride the expansion.
[[actions]]
type = "open_long"
amount = "75 USDC"

  [[actions.triggers]]
  indicator = "gk_vol_20"
  operator = "cross_above"
  target = "0.04"
  timeframe = "1h"

  [[actions.triggers]]
  indicator = "roc_10"
  operator = ">"
  target = "1"
  timeframe = "1h"
Tips
Garman-Klass is theoretically 7.4x more efficient than close-to-close volatility, meaning it needs far fewer candles to produce an equally accurate estimate. This makes it the best single indicator for volatility measurement when you have standard OHLC data. If you can only pick one volatility estimator, GK Vol is the strongest choice.
Running Parkinson, GK Vol, and Yang-Zhang simultaneously gives you a complete volatility picture. If all three agree that volatility is low, you have a high-confidence squeeze. If Parkinson is low but GK Vol is moderate, it means the open-close moves are significant even though the high-low range is small -- the market is trending within its range. These divergences provide additional strategic insight.
Like all volatility estimators, GK Vol values differ dramatically between assets. BTC/USDC might show GK Vol of 0.04 in normal conditions, while a volatile altcoin might sit at 0.12. Never reuse thresholds across different trading pairs. Backtest on each specific pair and timeframe to determine what "low," "moderate," and "high" mean for that asset.
Garman-Klass assumes that the open of each candle equals the close of the previous candle -- it ignores any gap between them. While cryptocurrency markets trade 24/7 (minimizing true overnight gaps), there can still be significant jumps between candle closes and opens during exchange maintenance, liquidity gaps, or fast-moving markets. If gap-driven volatility is important to your strategy, use Yang-Zhang volatility which explicitly accounts for inter-candle drift.
YZ Vol -- Yang-Zhang Volatility Estimator
Contents
Overview
Yang-Zhang Volatility is the most comprehensive classical volatility estimator. Developed by Dennis Yang and Qiang Zhang in 2000, it combines three separate volatility components into a single, robust measure:
- Overnight volatility -- the variance of the open relative to the previous close (captures inter-candle drift).
- Open-to-close volatility -- the variance of the close relative to the open (captures intraday directional movement).
- Rogers-Satchell volatility -- a component similar to Garman-Klass that uses high, low, open, and close (captures intraday range efficiently).
The formula optimally weights these three components to minimize the estimator's variance:
YZ = sqrt( overnight_var + k * open_close_var + (1 - k) * rogers_satchell_var )
Where k is chosen to minimize the total variance of the estimator.
What makes Yang-Zhang unique is its handling of overnight drift -- the gap between one candle's close and the next candle's open. Parkinson and Garman-Klass both assume this gap is zero, which is incorrect whenever there are jumps between candles. While cryptocurrency markets trade 24/7 (no true "overnight" close), there are still meaningful open-vs-previous-close differences caused by rapid price movement between candles, exchange maintenance windows, and liquidity gaps. Yang-Zhang captures this drift, producing the most robust volatility estimate when market patterns are irregular.
Format
yz_vol_{period}
The period defines how many candles the estimator averages over.
| Example | Period | Use Case |
|---|---|---|
yz_vol_10 | 10 | Short-term -- responsive to recent volatility changes |
yz_vol_20 | 20 | Standard -- the recommended default for most strategies |
yz_vol_50 | 50 | Long-term -- captures the broad volatility regime, very stable |
Period range: 5 to 500.
Value range: 0 to infinity (annualized volatility, always positive). Typical crypto range: 0.005 to 0.12.
Understanding YZ Vol Values
Yang-Zhang values are annualized volatility estimates expressed as decimals. Like all volatility estimators, they are not bounded to a fixed range and depend on the asset, timeframe, and market conditions.
| YZ Vol Range | Interpretation |
|---|---|
| Below 0.01 | Ultra-calm -- all three volatility components are minimal. Strongest possible squeeze signal. |
| 0.01 -- 0.035 | Low volatility -- quiet market with minimal inter-candle drift. Excellent squeeze environment. |
| 0.035 -- 0.07 | Moderate volatility -- normal conditions for major crypto pairs. Suitable for most strategies. |
| 0.07 -- 0.12 | High volatility -- large moves with significant drift between candles. Elevated risk. |
| Above 0.12 | Extreme volatility -- rapid, gapped price action. Very high risk for new entries. |
Yang-Zhang values may differ from Parkinson and GK Vol for the same period because of the overnight component. In markets with frequent gaps between candle close and next open, YZ Vol will be higher than GK Vol. In smooth, continuous markets, they will be very similar. These differences are themselves informative -- a large gap between YZ Vol and GK Vol reveals that inter-candle drift is a significant source of volatility.
Understanding Operators with YZ Vol
Each operator behaves differently with YZ Vol. As the most comprehensive volatility filter indicator, YZ Vol is almost always combined with directional entry signals.
< (Less Than) -- State-Based
What it does: The trigger is true on every candle where YZ Vol is below the threshold.
On the chart: The market is calm on every dimension -- small wicks, small bodies, and minimal drift between candles. This is the most thorough squeeze confirmation available from a single indicator.
[[actions.triggers]]
indicator = "yz_vol_20"
operator = "<"
target = "0.025"
timeframe = "1h"
Typical use: High-confidence squeeze detection. When YZ Vol is low, it means not only are the candles small, but there is minimal jump between consecutive candle opens and prior closes. The market is truly quiet. Combine with a directional trigger to enter when the squeeze resolves.
> (Greater Than) -- State-Based
What it does: The trigger is true on every candle where YZ Vol is above the threshold.
On the chart: Volatility is elevated across all components. The market is making large moves and potentially gapping between candles.
[[actions.triggers]]
indicator = "yz_vol_20"
operator = ">"
target = "0.08"
timeframe = "1h"
Typical use: Volatile market filter. Use > to avoid entering new positions when the market is chaotic, or to exit existing positions when volatility spikes to dangerous levels. YZ Vol > threshold as an exit trigger captures risk expansion that other estimators might miss.
cross_below -- Event-Based
What it does: Fires once, at the exact candle where YZ Vol transitions from above the threshold to below it. The previous candle had YZ Vol >= the target, and the current candle has YZ Vol < the target.
[[actions.triggers]]
indicator = "yz_vol_20"
operator = "cross_below"
target = "0.04"
timeframe = "1h"
Typical use: Detect the exact moment the market settles into a calm regime. Volatility has just dropped below the threshold -- the market is transitioning from active to quiet. This begins the watch period for a squeeze breakout setup.
cross_above -- Event-Based
What it does: Fires once, at the exact candle where YZ Vol transitions from below the threshold to above it. The previous candle had YZ Vol <= the target, and the current candle has YZ Vol > the target.
[[actions.triggers]]
indicator = "yz_vol_20"
operator = "cross_above"
target = "0.06"
timeframe = "1h"
Typical use: Detect the moment volatility expands from a calm state. The market was quiet and is now making larger, more gapped moves. This regime change often marks the beginning of a significant trending move. Combine with direction indicators to trade the expansion.
= (Equal) -- Not Recommended for YZ Vol
Why: YZ Vol produces floating-point values calculated to many decimal places. Exact equality will almost never be true. Use < or > instead.
- Use
<for the most comprehensive squeeze detection available -- low YZ Vol means the market is quiet on every axis. - Use
>to avoid chaotic markets or to trigger exits when volatility spikes. - Use
cross_below/cross_aboveto detect precise volatility regime transitions.
TOML Examples
Ultra-Calm Market RSI Dip Buy
When YZ Vol confirms an ultra-calm market and RSI drops into oversold territory, buy the dip. The logic: in a truly quiet market, an RSI dip is more likely a temporary pullback than the start of a crash.
[[actions]]
type = "open_long"
amount = "100 USDC"

  [[actions.triggers]]
  indicator = "yz_vol_20"
  operator = "<"
  target = "0.02"
  timeframe = "1h"

  [[actions.triggers]]
  indicator = "rsi_14"
  operator = "<"
  target = "30"
  timeframe = "1h"
YZ Vol Spike -- Exit or Avoid
When volatility explodes above the danger threshold, exit the position. A sudden YZ Vol spike means the market has become unpredictable, with large gaps between candles.
[[actions]]
type = "sell"
amount = "100%"

  [[actions.triggers]]
  indicator = "yz_vol_20"
  operator = "cross_above"
  target = "0.10"
  timeframe = "1h"
Triple Volatility Confirmation Squeeze
The highest-confidence squeeze setup: require all three volatility estimators (Parkinson, GK Vol, and YZ Vol) to confirm low volatility simultaneously. When all three agree, enter on a bullish RSI signal.
[[actions]]
type = "open_long"
amount = "150 USDC"

  [[actions.triggers]]
  indicator = "parkinson_20"
  operator = "<"
  target = "0.02"
  timeframe = "1h"

  [[actions.triggers]]
  indicator = "gk_vol_20"
  operator = "<"
  target = "0.025"
  timeframe = "1h"

  [[actions.triggers]]
  indicator = "yz_vol_20"
  operator = "<"
  target = "0.025"
  timeframe = "1h"

  [[actions.triggers]]
  indicator = "rsi_14"
  operator = "cross_above"
  target = "30"
  timeframe = "1h"
Regime-Based Trend Entry
Use YZ Vol to confirm the market is in a moderate volatility regime (trending, not chaotic), then enter on an EMA crossover with a macro trend filter.
[[actions]]
type = "open_long"
amount = "100 USDC"

  [[actions.triggers]]
  indicator = "yz_vol_20"
  operator = ">"
  target = "0.02"
  timeframe = "1h"

  [[actions.triggers]]
  indicator = "yz_vol_20"
  operator = "<"
  target = "0.07"
  timeframe = "1h"

  [[actions.triggers]]
  indicator = "ema_9"
  operator = "cross_above"
  target = "ema_21"
  timeframe = "1h"

  [[actions.triggers]]
  indicator = "sma_50"
  operator = ">"
  target = "sma_200"
  timeframe = "1d"
Tips
Yang-Zhang is the only classical volatility estimator that accounts for overnight (inter-candle) drift in addition to intraday range and open-close movement. This makes it the most robust single number for answering "how volatile is this market right now?" If you can only use one volatility indicator, YZ Vol gives you the most complete picture.
Even though crypto markets trade 24/7, the open of a new candle often differs from the prior candle's close -- especially during fast-moving markets or lower-liquidity periods. Parkinson and GK Vol ignore this gap. Yang-Zhang captures it. If your strategy is sensitive to gap risk (e.g., stop-loss slippage between candles), YZ Vol is the right volatility measure to monitor.
Rather than using fixed thresholds, consider building strategies around volatility regimes: low YZ Vol (squeeze) = accumulate, moderate YZ Vol = trend-follow, high YZ Vol = reduce exposure. This regime-based approach adapts naturally to changing market conditions without requiring constant threshold recalibration.
Running Parkinson, GK Vol, and YZ Vol together reveals what kind of volatility the market is experiencing. If all three are similar, the market is behaving normally. If YZ Vol is significantly higher than GK Vol, inter-candle gaps are a major volatility source. If Parkinson is high but GK Vol is lower, candles have large wicks but close near their opens. These divergence patterns can inform whether to use tight stops, wide stops, or no stops at all.
OBV -- On-Balance Volume
Contents
Overview
On-Balance Volume (OBV) is a cumulative volume indicator that connects volume flow to price direction. It answers a simple question: is more volume flowing into the asset (buying pressure) or out of it (selling pressure)?
The calculation is straightforward:
- If the current candle closes higher than the previous candle, the candle's volume is added to the running OBV total.
- If the current candle closes lower than the previous candle, the candle's volume is subtracted from the running OBV total.
- If the close is unchanged, OBV stays the same.
The result is a running total that rises when buying dominates and falls when selling dominates. The absolute value of OBV is meaningless on its own -- what matters is its direction and how it relates to price.
Why OBV matters: Volume leads price. If OBV is rising while price is flat, smart money may be accumulating -- a breakout could follow. If price makes a new high but OBV does not, the rally lacks conviction and may reverse.
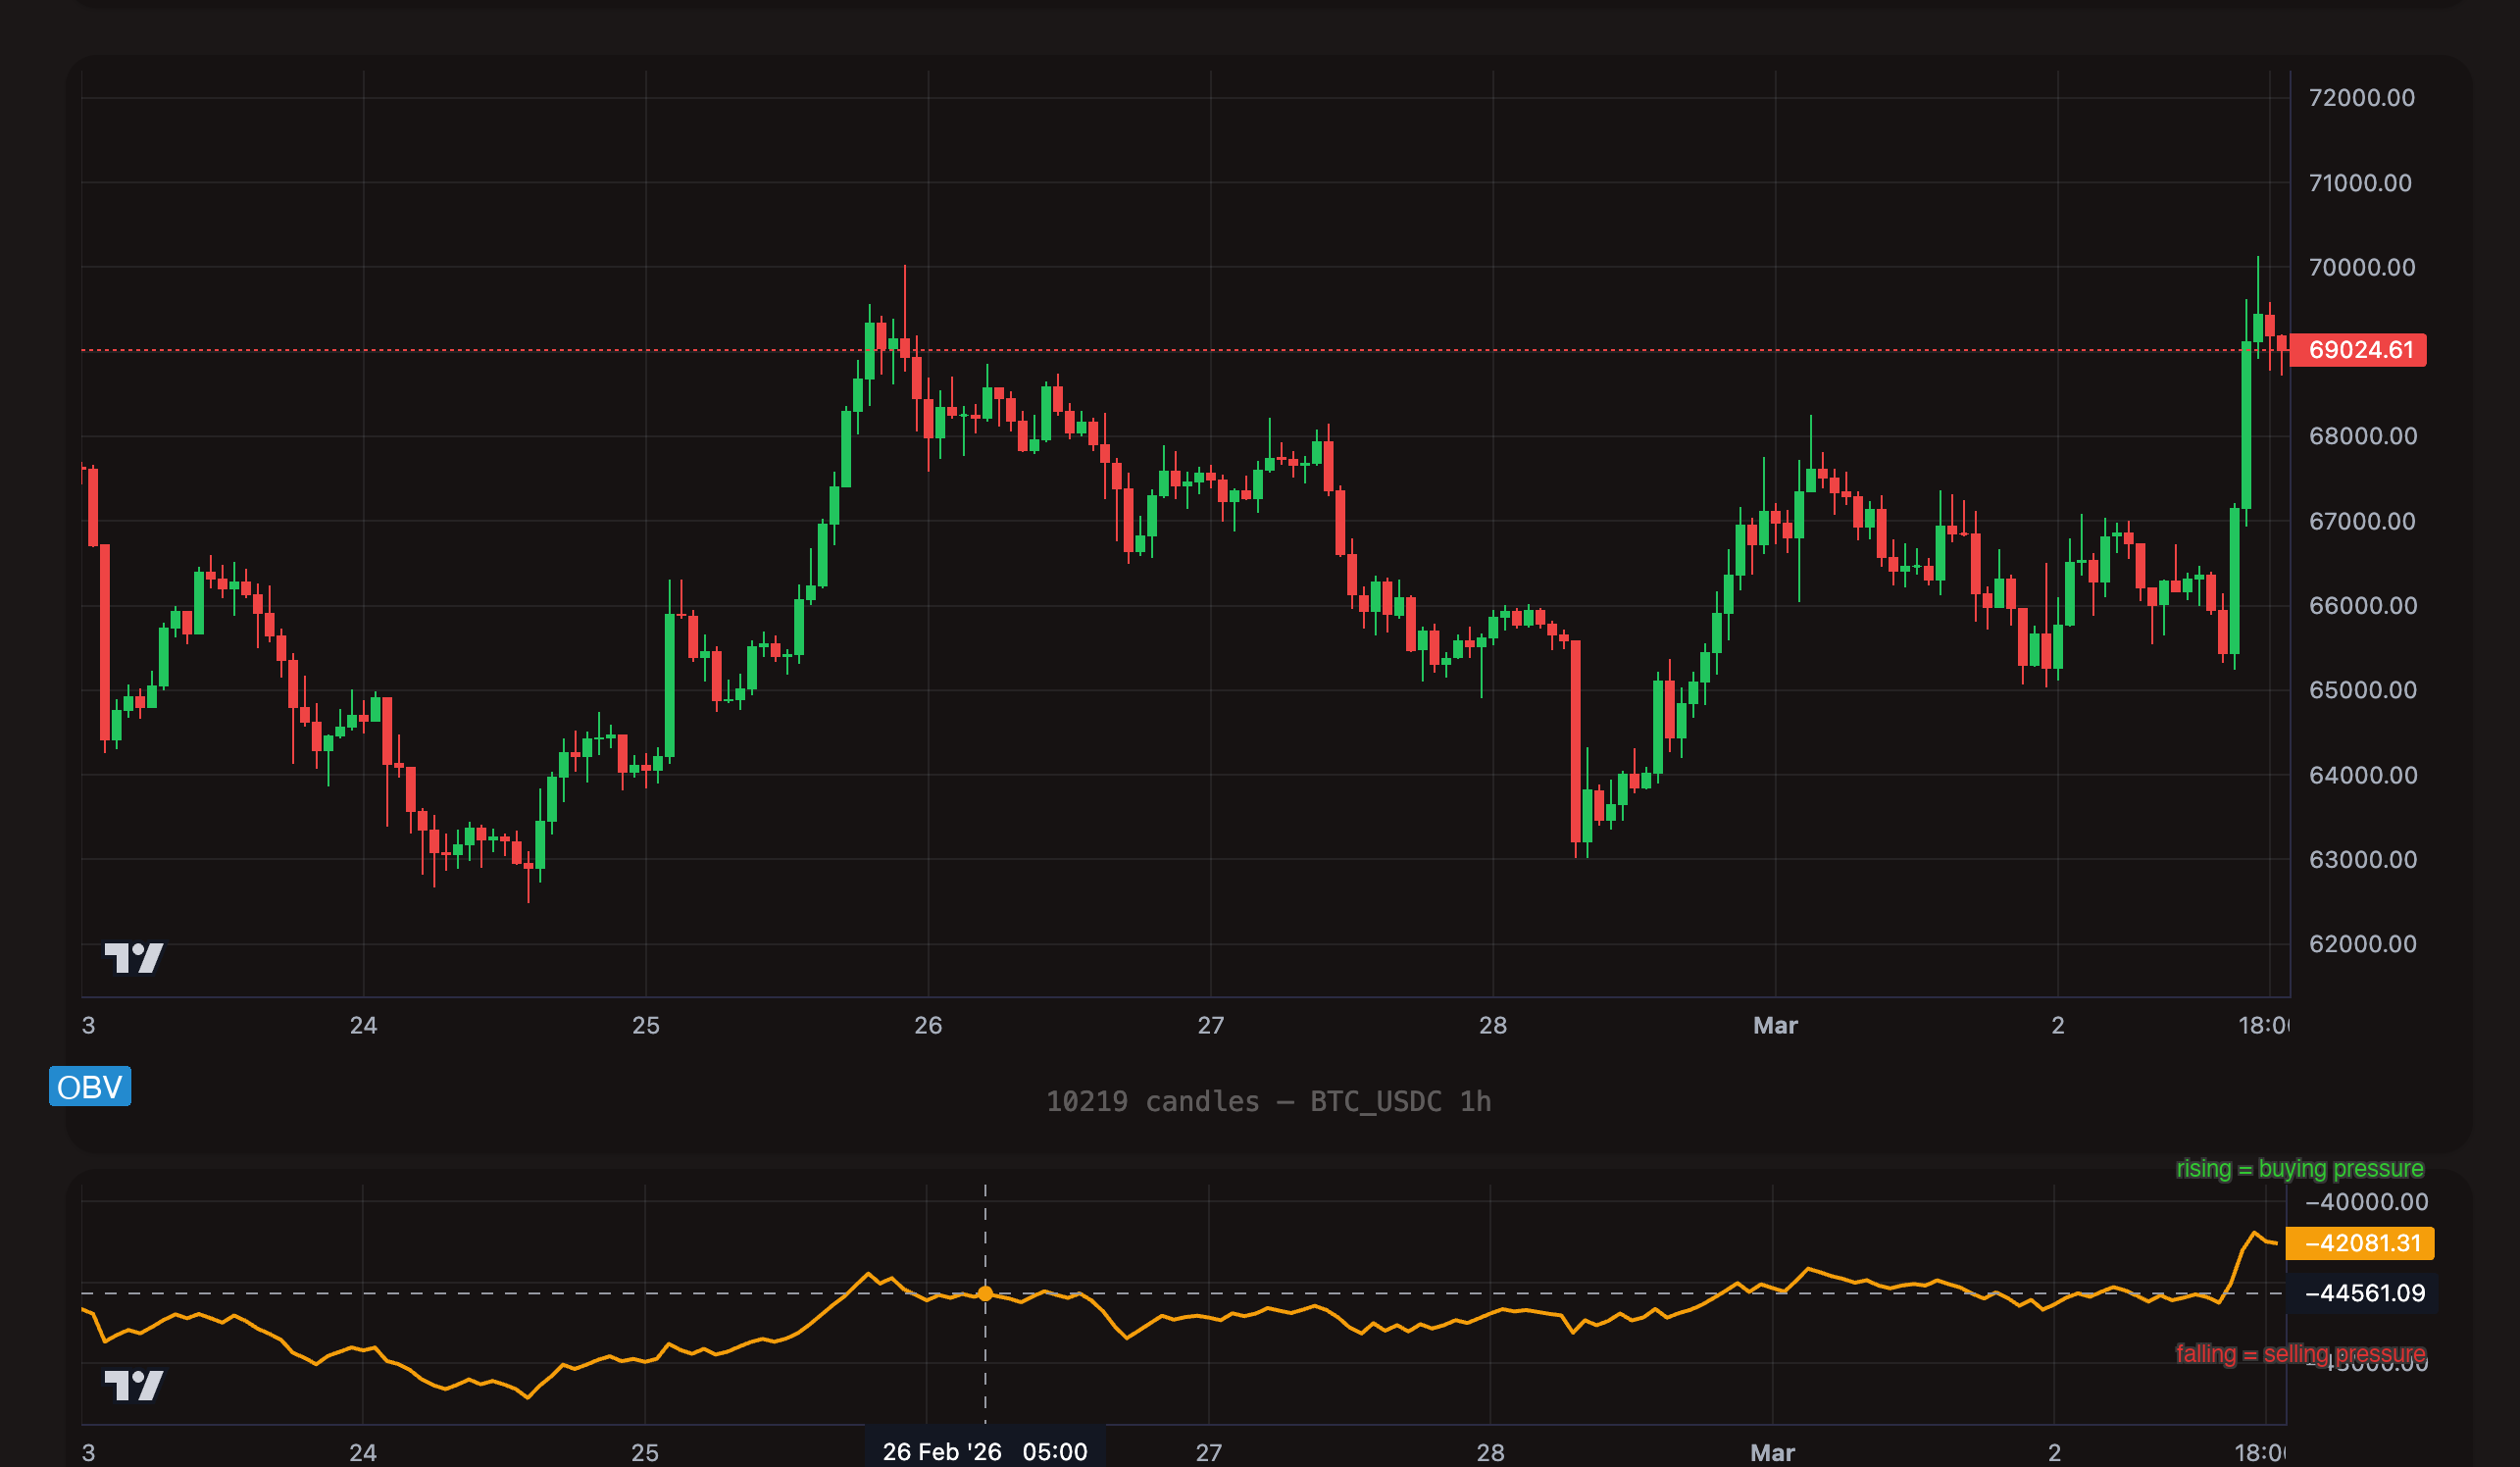
Format
OBV has two related formats:
| Format | Period | Description |
|---|---|---|
obv | None (cumulative) | The raw On-Balance Volume line. No period parameter -- it is a running total from the start of data. |
obv_sma_{period} | Configurable | A Simple Moving Average of OBV. Smooths the OBV line to create a crossover reference. |
OBV SMA examples:
| Example | Period | Use Case |
|---|---|---|
obv_sma_10 | 10 | Fast -- more responsive, more crossovers |
obv_sma_20 | 20 | Standard -- balanced signal frequency |
obv_sma_50 | 50 | Slow -- fewer but higher-conviction signals |
Value range: Unbounded. OBV can be any positive or negative number depending on cumulative volume flow. The scale depends entirely on the asset's trading volume.
Because OBV is cumulative, its absolute value varies enormously between assets and timeframes. Never compare OBV values across different pairs. Focus on the direction and crossovers with its SMA.
How OBV Works
Rising OBV: Volume is flowing into the asset on up-candles more than it is flowing out on down-candles. Buyers are in control. If price is also rising, the uptrend is healthy and supported by volume.
Falling OBV: Volume is flowing out on down-candles more than it is flowing in on up-candles. Sellers are in control. If price is also falling, the downtrend has conviction.
OBV Divergence: The most powerful OBV signal. When price and OBV move in opposite directions, something is changing beneath the surface:
- Bullish divergence: Price makes a lower low, but OBV makes a higher low. Selling pressure is diminishing despite the price drop. A reversal upward may be imminent.
- Bearish divergence: Price makes a higher high, but OBV makes a lower high. Buying pressure is weakening despite the price rise. A reversal downward may follow.
OBV vs. OBV SMA: The raw OBV line is noisy. Smoothing it with an SMA creates a baseline for crossover signals -- the same way a moving average smooths price. When OBV crosses above its SMA, volume momentum is turning bullish. When it crosses below, volume momentum is turning bearish.
Understanding Operators with OBV
OBV is most commonly used with crossover operators against its own SMA. This is its primary signal mechanism.
cross_above -- OBV Crosses Above Its SMA
What it does: Fires once at the exact candle where OBV transitions from below its SMA to above it. Volume momentum has just turned bullish.
On the chart: The OBV line was sitting below its smoothed average, then climbs above it. This moment marks the shift from net selling pressure to net buying pressure (relative to recent history).
[[actions.triggers]]
indicator = "obv"
operator = "cross_above"
target = "obv_sma_20"
timeframe = "1h"
Typical use: Entry signal. OBV crossing above its SMA confirms that buying volume is increasing. This is the primary OBV buy signal and pairs well with price-based triggers.
cross_below -- OBV Crosses Below Its SMA
What it does: Fires once at the exact candle where OBV transitions from above its SMA to below it. Volume momentum has just turned bearish.
On the chart: The OBV line drops below its smoothed average. Selling volume is now outpacing buying volume relative to recent history.
[[actions.triggers]]
indicator = "obv"
operator = "cross_below"
target = "obv_sma_20"
timeframe = "1h"
Typical use: Exit signal or short entry. When OBV drops below its SMA, the buying pressure that supported the price move is fading.
> OBV Above Its SMA -- State-Based
What it does: True on every candle where OBV remains above its SMA. Volume momentum is currently bullish.
[[actions.triggers]]
indicator = "obv"
operator = ">"
target = "obv_sma_20"
timeframe = "1h"
Typical use: Trend filter. Use this alongside another entry trigger to gate trades so they only execute when volume momentum is favorable. "Buy RSI dips only when OBV is above its SMA."
< OBV Below Its SMA -- State-Based
What it does: True on every candle where OBV remains below its SMA. Volume momentum is currently bearish.
[[actions.triggers]]
indicator = "obv"
operator = ">"
target = "obv_sma_20"
timeframe = "1h"
Typical use: Bearish filter. Avoid opening long positions when selling pressure dominates. Can also be used as an exit condition.
- Use
cross_above/cross_belowfor entry and exit signals -- they fire once at the turning point when volume momentum shifts. - Use
>/<as filters alongside other triggers to confirm that volume momentum supports the trade direction.
TOML Examples
Buying Pressure Emerges
Enter when OBV crosses above its 20-period SMA on the 1-hour chart. This signals that buying volume is starting to dominate.
[[actions]]
type = "open_long"
amount = "100 USDC"

  [[actions.triggers]]
  indicator = "obv"
  operator = "cross_above"
  target = "obv_sma_20"
  timeframe = "1h"
Volume Momentum Exit
Exit the position when OBV drops below its SMA. The buying pressure that justified the entry has faded.
[[actions]]
type = "sell"
amount = "100%"

  [[actions.triggers]]
  indicator = "obv"
  operator = "cross_below"
  target = "obv_sma_20"
  timeframe = "1h"
OBV Crossover with Price Breakout
Combine OBV with a Bollinger Band breakout to confirm that the price move has real volume behind it. This filters out low-conviction breakouts.
[[actions]]
type = "open_long"
amount = "100 USDC"

  [[actions.triggers]]
  indicator = "price"
  operator = "cross_above"
  target = "bb_upper"
  timeframe = "1h"

  [[actions.triggers]]
  indicator = "obv"
  operator = ">"
  target = "obv_sma_20"
  timeframe = "1h"
Full OBV Strategy (Entry + Exit)
Enter on bullish OBV crossover with RSI confirmation, exit on bearish OBV crossover or fixed profit.
[meta]
name = "OBV_Volume_Momentum"
description = "Enter on OBV bullish cross + RSI dip, exit on bearish cross or +3%"

# ENTRY
[[actions]]
type = "open_long"
amount = "100 USDC"

  [[actions.triggers]]
  indicator = "obv"
  operator = "cross_above"
  target = "obv_sma_20"
  timeframe = "1h"

  [[actions.triggers]]
  indicator = "rsi_14"
  operator = "<"
  target = "40"
  timeframe = "1h"

# TAKE PROFIT
[[actions]]
type = "sell"
amount = "100%"

  [[actions.triggers]]
  type = "pos_price_change"
  value = "3%"

# VOLUME EXIT
[[actions]]
type = "sell"
amount = "100%"

  [[actions.triggers]]
  indicator = "obv"
  operator = "cross_below"
  target = "obv_sma_20"
  timeframe = "1h"
Tips
OBV's absolute value is meaningless. Whether OBV reads 500,000 or -2,000,000 tells you nothing on its own. What matters is: is it rising or falling? Always use OBV with its SMA or look at the slope of the line. The crossover against obv_sma_20 is the standard way to quantify direction changes.
A shorter SMA period (10) produces more crossovers -- more signals but more noise. A longer period (50) produces fewer, higher-confidence signals but reacts slower. obv_sma_20 is the standard starting point. Adjust based on backtest results for your specific pair and timeframe.
OBV shines as a confirmation layer for price-based signals. A price breakout above resistance combined with OBV crossing above its SMA is far more reliable than either signal alone. Volume confirms conviction -- use it to validate what price is telling you.
OBV is only as meaningful as the underlying volume data. On thinly traded pairs, a single large order can spike OBV dramatically, creating false signals. Stick to high-liquidity pairs (BTC, ETH, major alts) where volume reflects broad market participation.
Volume SMA
Contents
Overview
Volume SMA calculates the Simple Moving Average of trading volume over the last N candles. It establishes a baseline for what "normal" volume looks like, so you can detect when trading activity is unusually high or unusually low.
Volume is the fuel behind price moves. A price breakout on high volume carries conviction -- many participants are driving the move. A breakout on low volume is suspect -- it may lack the momentum to sustain itself and could reverse quickly.
By comparing current volume to its average, you turn raw volume into an actionable signal: is trading activity above or below normal right now?
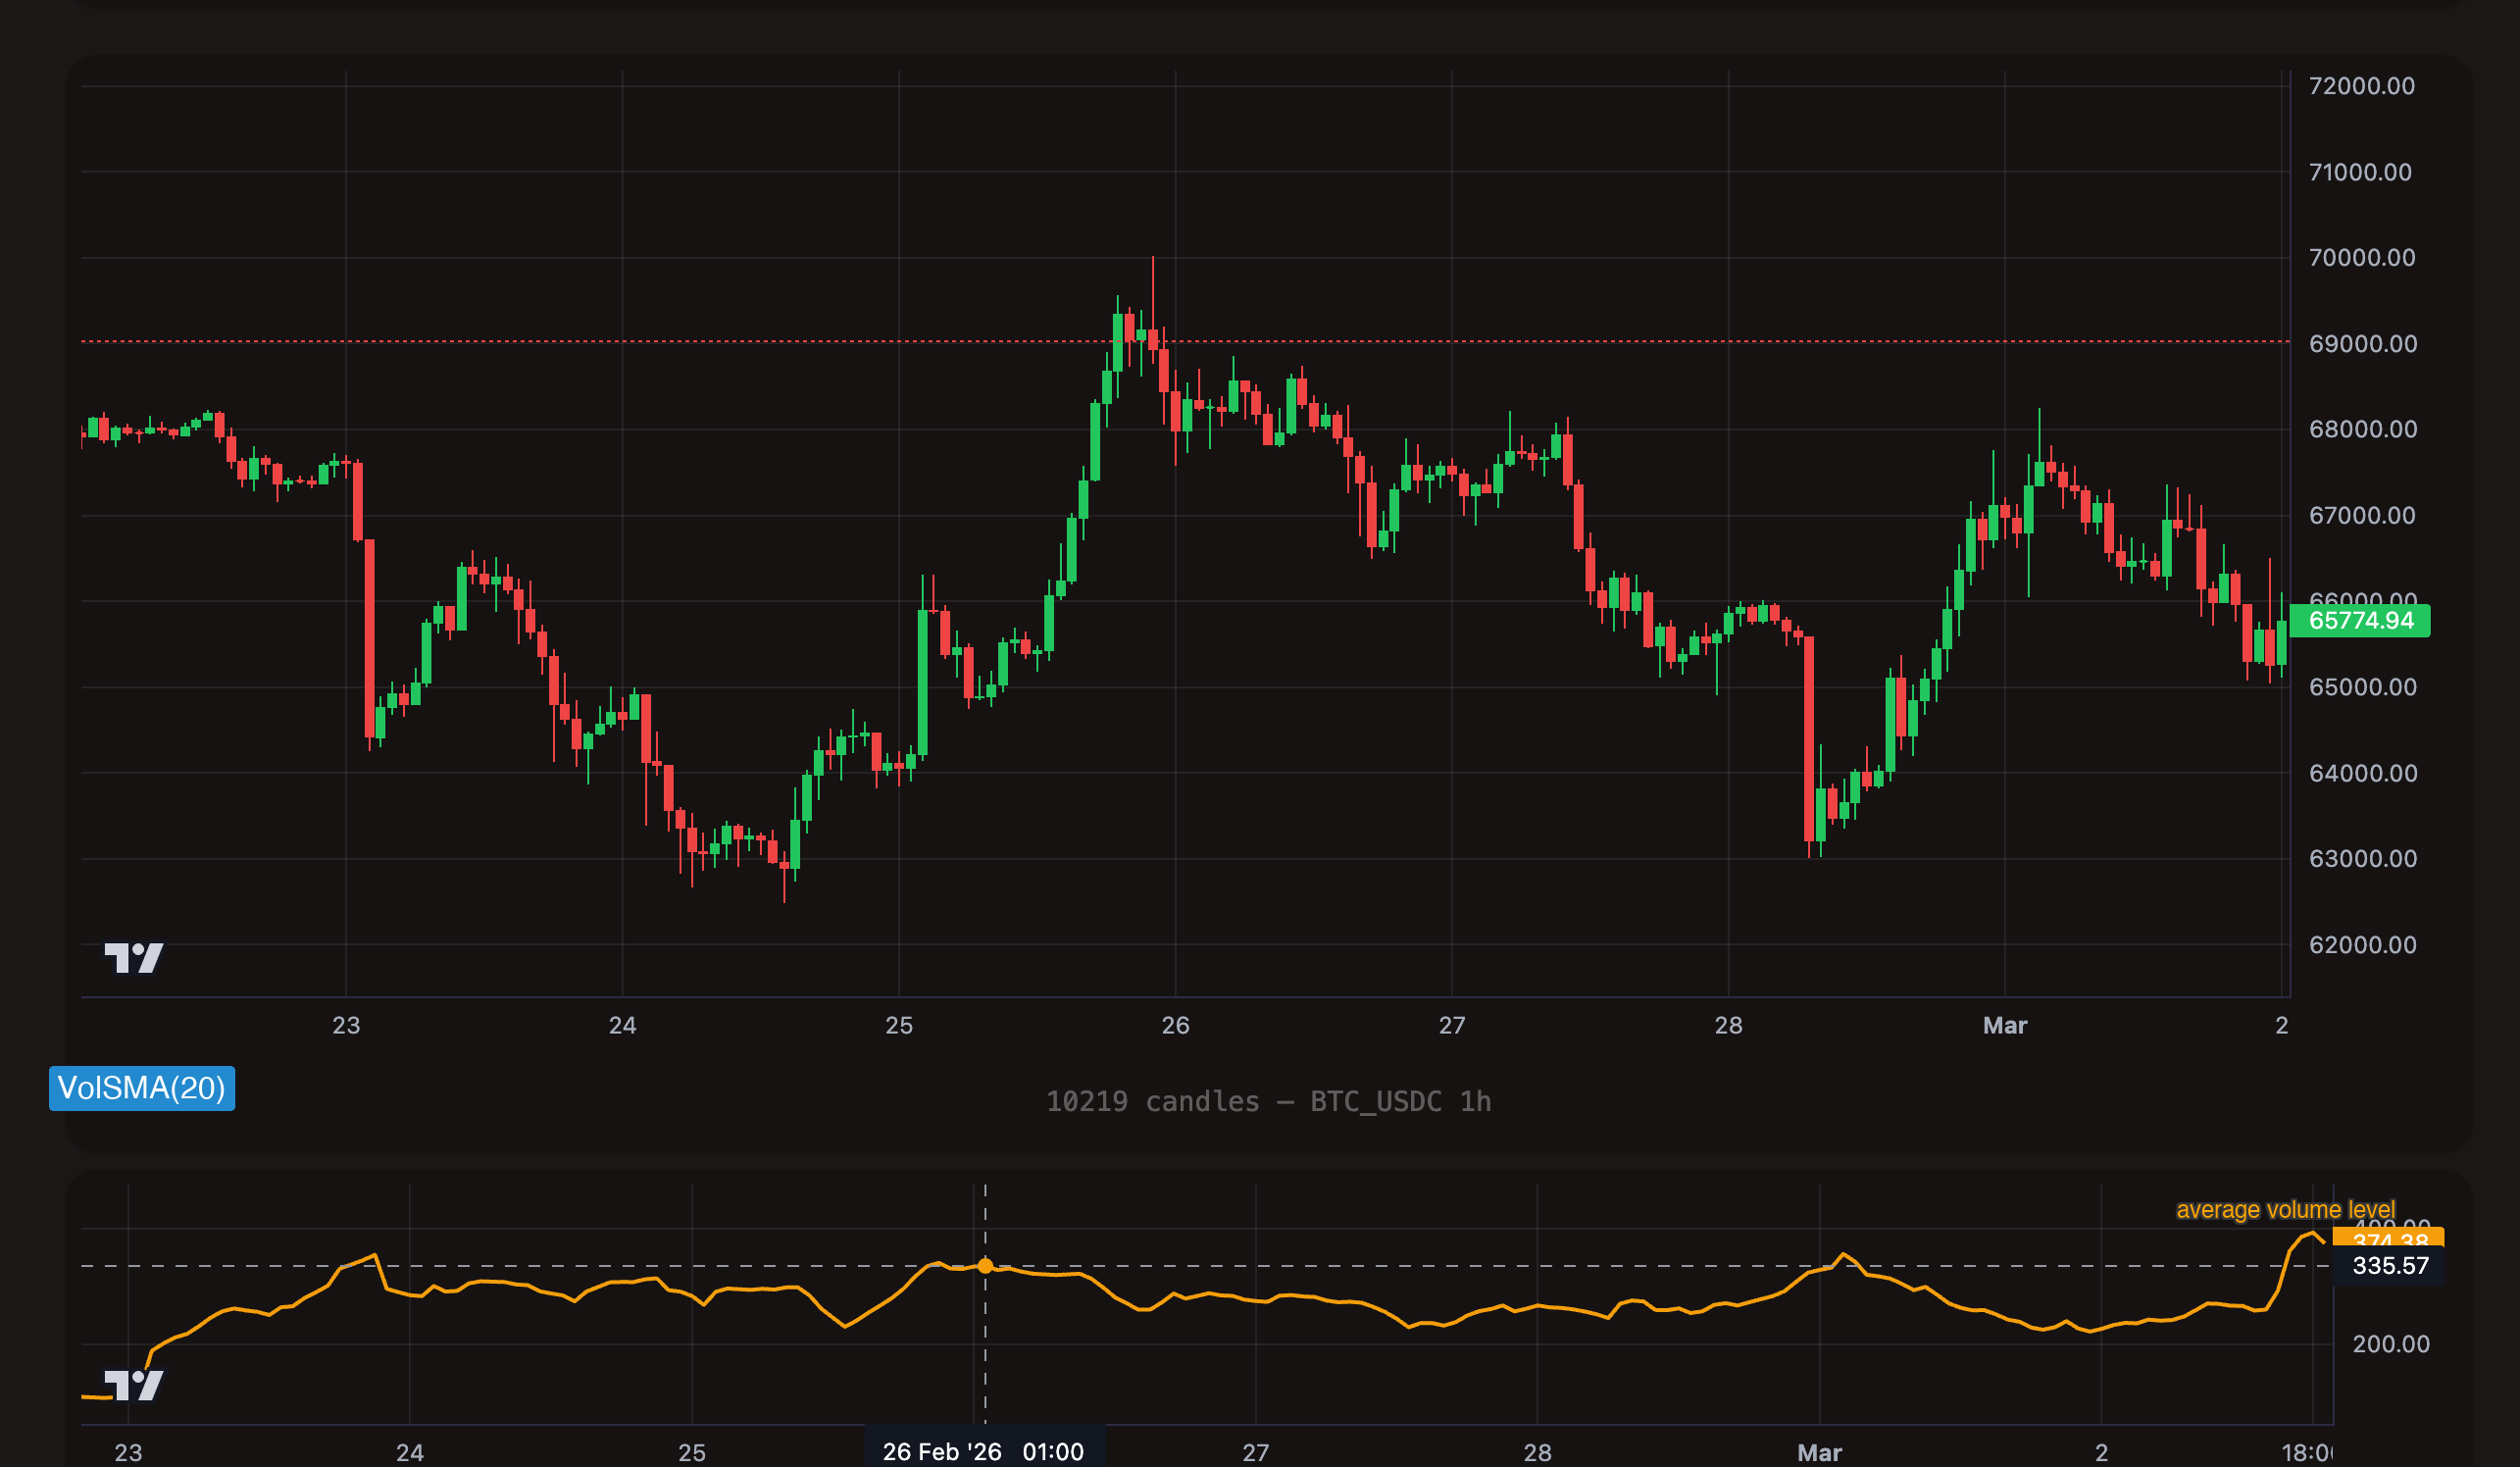
Format
vol_sma_{period}
The period defines how many candles are averaged to establish the "normal" volume baseline.
| Example | Period | Use Case |
|---|---|---|
vol_sma_10 | 10 | Short window -- reacts quickly to volume changes |
vol_sma_20 | 20 | Standard -- smooth baseline for most strategies |
vol_sma_50 | 50 | Long window -- captures the broader volume trend |
Period range: 1 to 200.
Value range: 0+ (always positive, volume-denominated). The actual values depend entirely on the asset and timeframe. BTC on hourly candles might have a vol_sma_20 of 500 BTC. A small-cap altcoin might have a vol_sma_20 of 10,000 tokens. Never compare Volume SMA values across different pairs.
Volume SMA is denominated in the asset's trading volume units, not in price. The absolute values vary enormously between pairs and timeframes. When using Volume SMA as a target for comparison, you are comparing current volume to average volume on the same pair and timeframe -- the scale is always consistent within that context.
How Volume SMA Works
Current volume above Volume SMA: Trading activity is above the recent average. Something is happening -- a breakout, news event, or institutional activity. Price moves during above-average volume are more likely to sustain.
Current volume below Volume SMA: Trading activity is below the recent average. The market is quiet. Price moves during below-average volume often lack follow-through and may reverse. This is typical of consolidation phases.
Volume spike: When current volume crosses from below to above its SMA, a volume surge has begun. This is the event-based way to detect the start of unusual activity.
Volume drying up: When current volume drops below its SMA, the market is settling down. If this happens after a big move, it may signal that the move is losing steam.
Understanding Operators with Volume SMA
Volume SMA is typically used as a confirmation filter -- you pair it with a price-based trigger to ensure the price move has volume backing it.
> Above Average Volume -- State-Based
What it does: True on every candle where current volume exceeds the Volume SMA. Trading activity is above average.
[[actions.triggers]]
indicator = "vol_sma_20"
operator = ">"
target = "0"
timeframe = "1h"
The example above triggers whenever vol_sma_20 is positive, which is effectively always. In practice, you use Volume SMA as a target rather than the indicator. The typical pattern compares the current candle's volume to the SMA: use vol_sma_20 as a filter alongside price triggers to confirm that volume supports the move.
Typical use: Confirmation layer. Add this trigger to a price breakout action so it only fires when volume is elevated. "Buy when price breaks above the upper Bollinger Band AND volume is above average."
< Below Average Volume -- State-Based
What it does: True on every candle where current volume is below the Volume SMA. The market is quiet.
Typical use: Detect consolidation. Low-volume periods often precede breakouts. You can also use this to avoid entering trades during dead markets where price moves are unreliable.
cross_above -- Volume Spike Begins
What it does: Fires once at the exact candle where volume transitions from below the SMA to above it. A volume surge has just started.
[[actions.triggers]]
indicator = "vol_sma_20"
operator = "cross_above"
target = "0"
timeframe = "1h"
Typical use: Detect the start of a volume spike. Combine with a trend filter to determine if the spike is bullish or bearish. Volume alone does not tell you direction -- it tells you that something significant is happening.
cross_below -- Volume Returns to Normal
What it does: Fires once when volume drops from above the SMA to below it. The surge is ending.
Typical use: Detect when a high-volume event is winding down. Can be used as a trailing exit signal -- if you entered on a volume spike, exit when volume normalizes.
Volume SMA is almost always a supporting trigger, not a standalone entry signal. High volume confirms a move. Low volume warns of a fake-out. Pair volume triggers with price or momentum indicators for reliable strategies.
TOML Examples
Confirm Breakout with High Volume
Only enter on a Bollinger Band breakout when volume confirms the move. Price above the upper band with elevated volume signals a genuine breakout, not a low-conviction spike.
[[actions]]
type = "open_long"
amount = "100 USDC"

  [[actions.triggers]]
  indicator = "price"
  operator = "cross_above"
  target = "bb_upper"
  timeframe = "1h"

  [[actions.triggers]]
  indicator = "vol_sma_20"
  operator = ">"
  target = "0"
  timeframe = "1h"
Detect Low-Volume Consolidation
Avoid buying RSI dips during dead markets. Low volume + oversold RSI often means the market is drifting, not reversing. Wait for volume to confirm interest.
[[actions]]
type = "open_long"
amount = "100 USDC"

  [[actions.triggers]]
  indicator = "rsi_14"
  operator = "<"
  target = "30"
  timeframe = "1h"

  [[actions.triggers]]
  indicator = "obv"
  operator = ">"
  target = "obv_sma_20"
  timeframe = "1h"
Volume Spike Entry
Enter when a volume surge begins during an uptrend. The MACD filter ensures the trend is bullish, and the volume crossover catches the moment activity spikes.
[[actions]]
type = "open_long"
amount = "100 USDC"

  [[actions.triggers]]
  indicator = "macd_line"
  operator = ">"
  target = "0"
  timeframe = "1h"

  [[actions.triggers]]
  indicator = "vol_sma_20"
  operator = "cross_above"
  target = "0"
  timeframe = "1h"
Multi-Signal Breakout with Volume Confirmation
A high-confidence entry: price crosses above the 50-period SMA, MACD is bullish, and volume is above average. Three independent signals aligning greatly reduces false positives.
[[actions]]
type = "open_long"
amount = "100 USDC"

  [[actions.triggers]]
  indicator = "price"
  operator = "cross_above"
  target = "sma_50"
  timeframe = "1h"

  [[actions.triggers]]
  indicator = "macd_line"
  operator = ">"
  target = "0"
  timeframe = "1h"

  [[actions.triggers]]
  indicator = "vol_sma_20"
  operator = ">"
  target = "0"
  timeframe = "1h"
Tips
Volume SMA rarely makes sense as a standalone signal. It does not tell you direction -- only that activity is above or below normal. Always pair it with a directional indicator (MACD, SMA crossover, RSI) to determine whether the volume supports a bullish or bearish thesis.
Shorter periods (10) give you a more reactive baseline. Volume only needs to exceed the recent few candles to qualify as "above average." Good for catching quick spikes on lower timeframes.
Longer periods (50) establish a broader sense of normal. Volume needs to exceed a longer history to qualify as elevated. Better for filtering out noise on higher timeframes.
vol_sma_20 is the standard starting point for most strategies.
Volume SMA values are denominated in trading volume units, which vary enormously between assets. BTC might trade 500 units per hourly candle while a small-cap altcoin trades 50,000 tokens. Never hardcode absolute volume thresholds across different pairs. Use Volume SMA as a relative comparison within the same pair and timeframe.
One of the oldest principles in technical analysis: volume changes often precede price changes. A surge in volume during a consolidation phase -- before price breaks out -- can be an early warning that a significant move is about to begin. Watch for volume rising while price is flat.
TTM Trend
Contents
Overview
TTM Trend is a simplified trend direction indicator that distills the current market regime into one of three discrete values: bullish, neutral, or bearish. Instead of producing a continuous range of values like RSI or MACD, TTM Trend gives you a clean, unambiguous answer: what direction is the trend?
This makes TTM Trend uniquely suited for use as a trend gate -- a filter that allows or blocks trades based on the current trend direction. Rather than trying to time exact entries with TTM Trend, you use it to ensure that your other signals (RSI dips, MACD crossovers, Bollinger touches) only fire when the broader trend supports the trade.
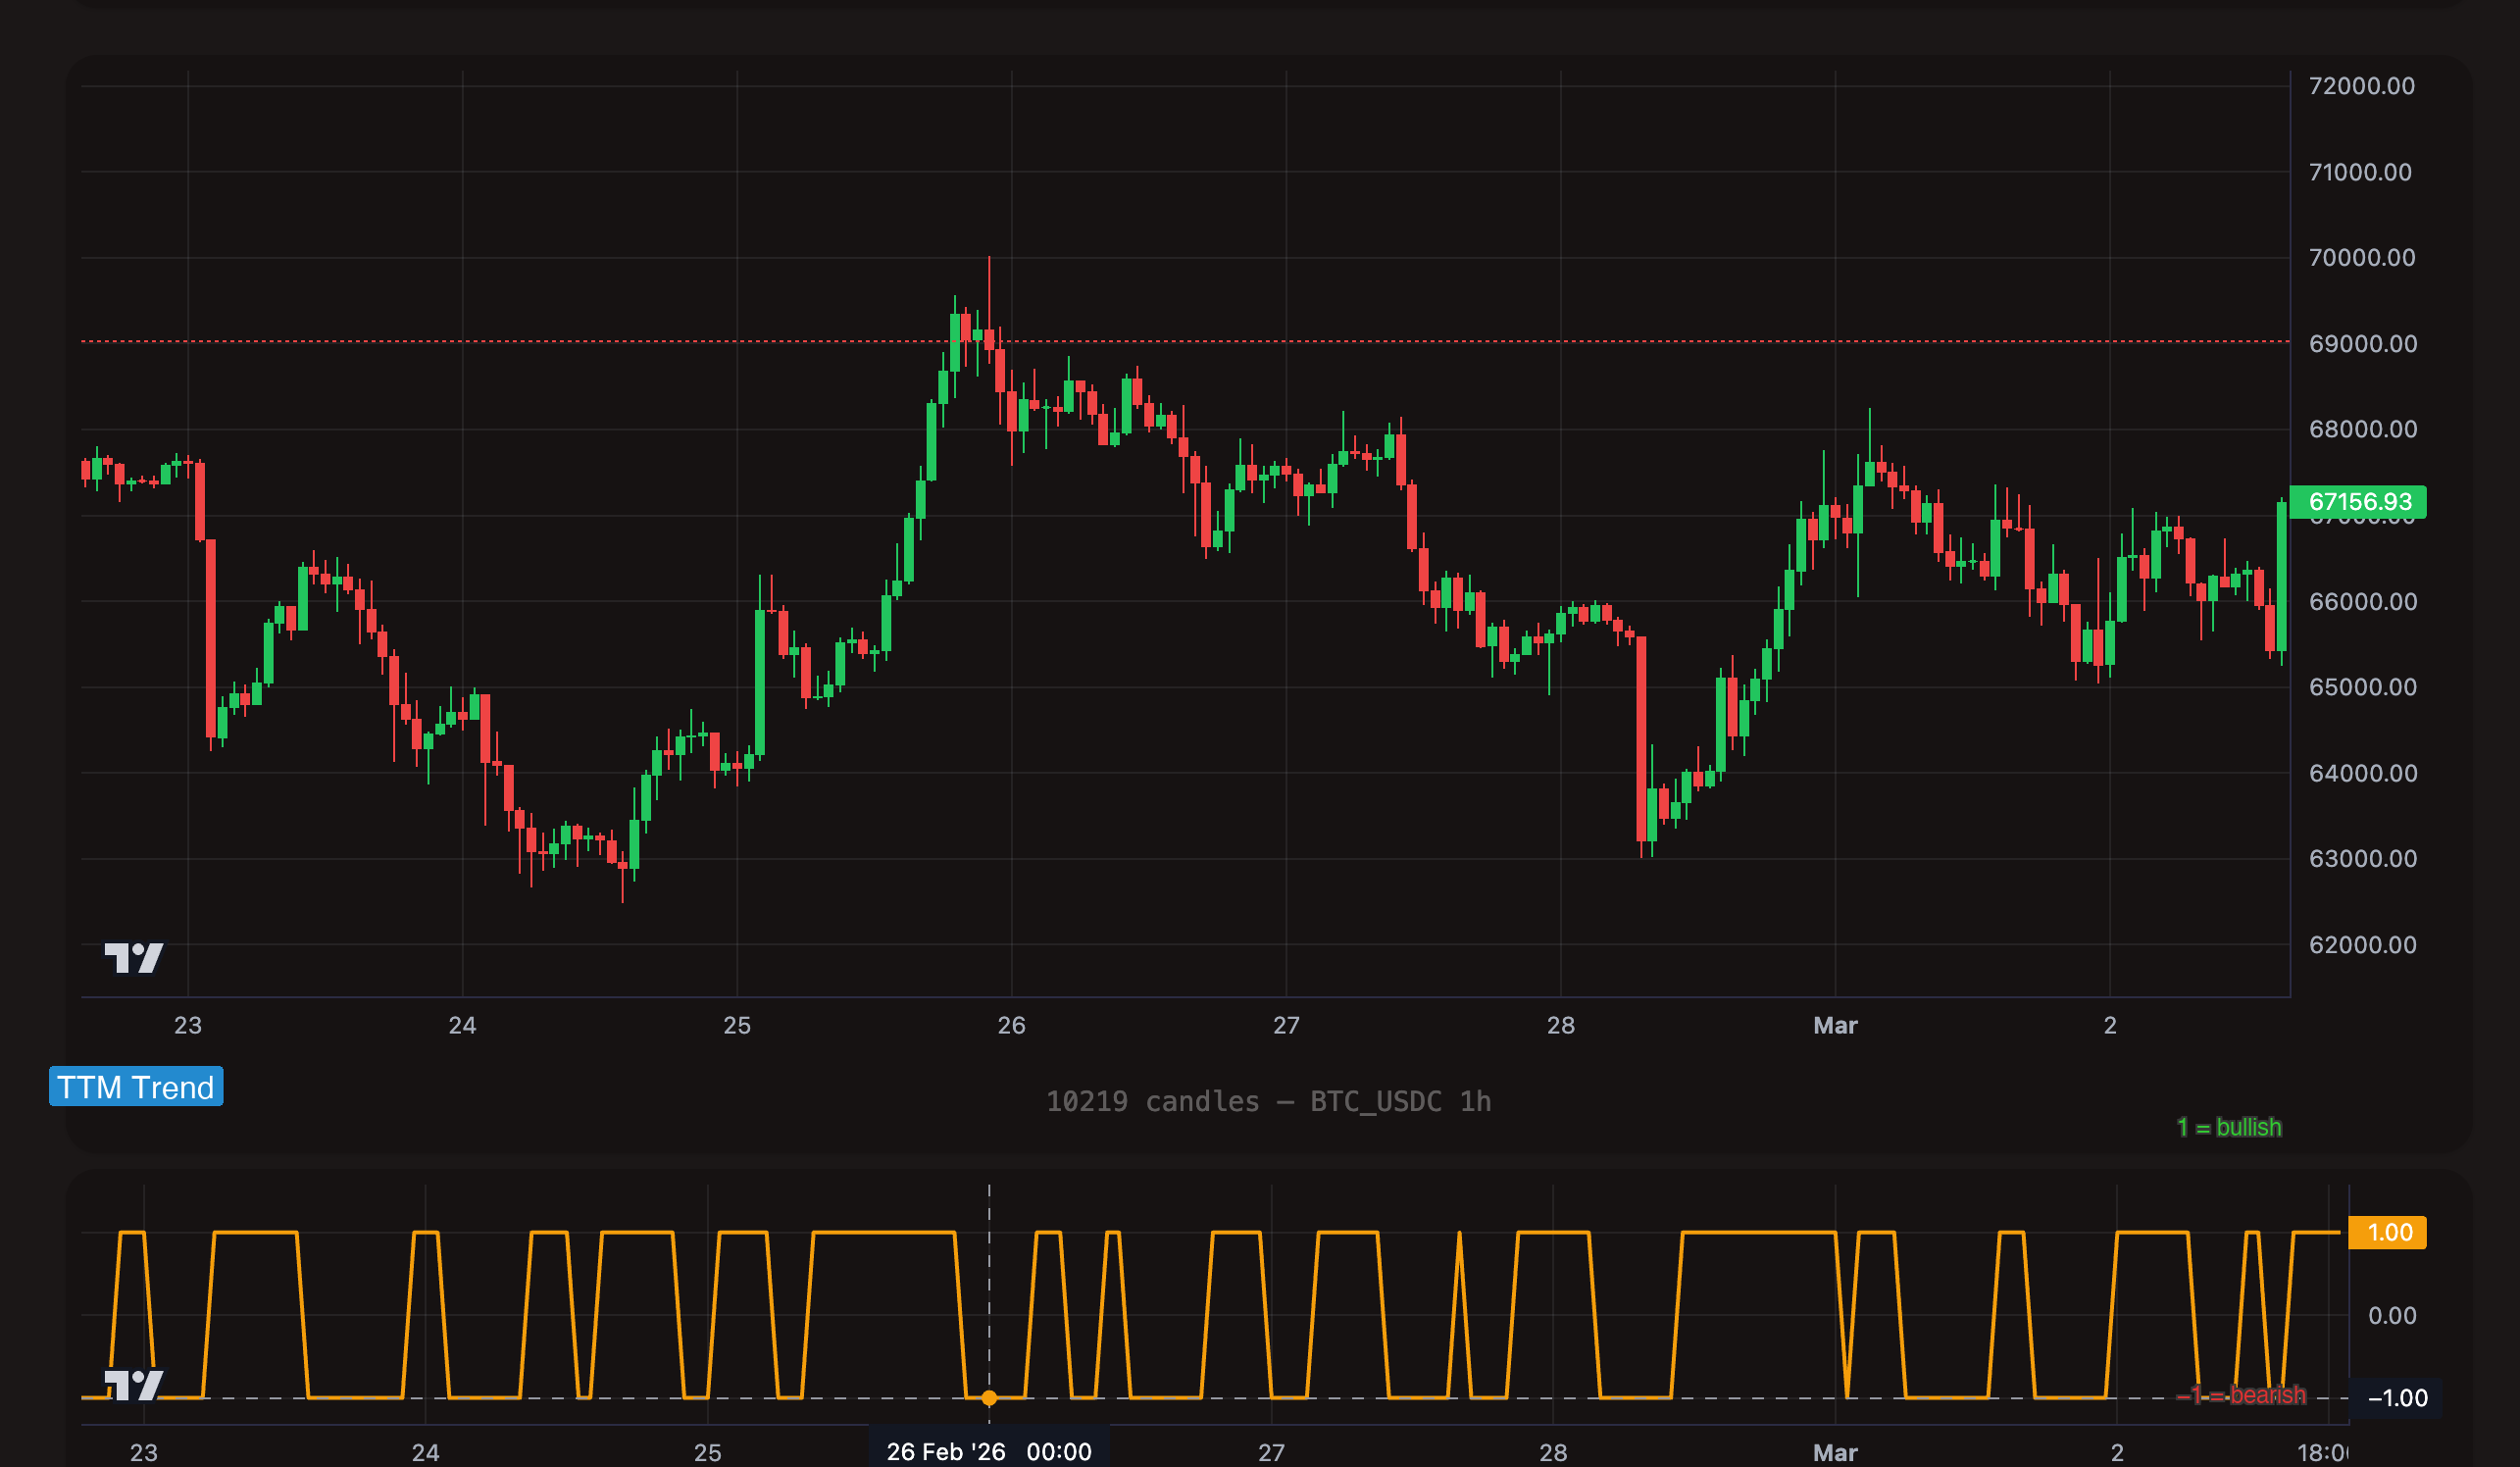
Format
ttm_trend
TTM Trend has no period parameter. It uses a fixed internal calculation to determine trend direction. The format is always just ttm_trend.
Value range: Discrete integers only -- 1, 0, or -1.
TTM Trend Values
| Value | Meaning | Interpretation |
|---|---|---|
1 | Bullish | The market is in an uptrend. Favorable for long entries. |
0 | Neutral | No clear trend direction. The market is transitioning or consolidating. |
-1 | Bearish | The market is in a downtrend. Favorable for exits or short entries. |
TTM Trend outputs integers, not floating-point numbers. This is why the = (equals) operator works perfectly here -- there are only three possible values, and they are exact. This is the exception to the general rule that = is rarely useful for technical indicators.
Understanding Operators with TTM Trend
TTM Trend is the primary use case for the = operator. Its discrete values make equality comparisons meaningful and reliable.
= (Equals) -- The Primary Operator
What it does: True on every candle where TTM Trend equals the specified value. This is a state-based operator -- it fires as long as the condition holds.
Bullish gate (= 1):
[[actions.triggers]]
indicator = "ttm_trend"
operator = "="
target = "1"
timeframe = "1h"
This fires on every candle where the hourly trend is bullish. Use it as a filter alongside entry triggers to prevent buying in downtrends or neutral markets.
Bearish gate (= -1):
[[actions.triggers]]
indicator = "ttm_trend"
operator = "="
target = "-1"
timeframe = "1h"
This fires on every candle where the trend is bearish. Use it as an exit condition -- when the trend turns against your position, close it.
Neutral gate (= 0):
[[actions.triggers]]
indicator = "ttm_trend"
operator = "="
target = "0"
timeframe = "1h"
This fires when the market has no clear direction. Useful for avoiding trades during choppy, directionless periods.
> (Greater Than) -- Not Bearish
What it does: True when TTM Trend is greater than the target value. Since TTM Trend only outputs -1, 0, and 1:
ttm_trend > 0is true when TTM Trend = 1 (bullish only).ttm_trend > -1is true when TTM Trend = 0 or 1 (not bearish).
[[actions.triggers]]
indicator = "ttm_trend"
operator = ">"
target = "0"
timeframe = "1h"
Typical use: A slightly looser filter than = 1. Allows trades when the trend is bullish. Since there is only one integer above 0 (which is 1), this behaves identically to = 1 in practice.
The more useful form is > -1 (not bearish), which allows trades in both bullish and neutral conditions:
[[actions.triggers]]
indicator = "ttm_trend"
operator = ">"
target = "-1"
timeframe = "1h"
< (Less Than) -- Not Bullish
What it does: True when TTM Trend is less than the target value.
ttm_trend < 0is true when TTM Trend = -1 (bearish only).ttm_trend < 1is true when TTM Trend = 0 or -1 (not bullish).
[[actions.triggers]]
indicator = "ttm_trend"
operator = "<"
target = "1"
timeframe = "1h"
Typical use: Exit filter. Close positions when the trend is no longer bullish. Using < 1 catches both the neutral and bearish states -- a more conservative exit than waiting for full bearish confirmation.
cross_above / cross_below -- Trend Transitions
What they do: Fire once at the moment TTM Trend transitions through a value. Because TTM Trend changes in discrete steps (e.g., from 0 to 1), these operators catch the exact candle where the trend regime shifts.
# Trend just turned bullish
[[actions.triggers]]
indicator = "ttm_trend"
operator = "cross_above"
target = "0"
timeframe = "1h"
# Trend just turned bearish
[[actions.triggers]]
indicator = "ttm_trend"
operator = "cross_below"
target = "0"
timeframe = "1h"
Typical use: Catching the moment a trend change occurs. Unlike = which fires on every candle during the trend, cross_above fires once at the transition. This is useful for one-time entries or exits at the trend shift.
Use = when TTM Trend is a filter for another trigger. The filter needs to be true on the same candle the other trigger fires, so = (state-based, fires every candle) is correct.
Use cross_above / cross_below when TTM Trend is the primary signal and you want to act at the exact moment the trend changes.
TOML Examples
Only Enter During Uptrend
Gate RSI entries so they only fire when the hourly trend is bullish. This prevents buying oversold dips in a downtrend -- a common trap.
[[actions]]
type = "open_long"
amount = "100 USDC"

  [[actions.triggers]]
  indicator = "rsi_14"
  operator = "<"
  target = "30"
  timeframe = "1h"

  [[actions.triggers]]
  indicator = "ttm_trend"
  operator = "="
  target = "1"
  timeframe = "1h"
Exit on Downtrend Confirmation
Sell the entire position when the trend turns bearish. This acts as a trend-based stop-loss.
[[actions]]
type = "sell"
amount = "100%"

  [[actions.triggers]]
  indicator = "ttm_trend"
  operator = "="
  target = "-1"
  timeframe = "1h"
RSI Dip Buy with Trend Filter
A refined dip-buying strategy. The daily TTM Trend confirms the macro direction is bullish, while the hourly RSI catches oversold dips for entry timing. Multi-timeframe confirmation.
[[actions]]
type = "open_long"
amount = "100 USDC"

  [[actions.triggers]]
  indicator = "ttm_trend"
  operator = "="
  target = "1"
  timeframe = "1d"

  [[actions.triggers]]
  indicator = "rsi_14"
  operator = "<"
  target = "35"
  timeframe = "1h"

  [[actions.triggers]]
  indicator = "macd_line"
  operator = ">"
  target = "0"
  timeframe = "1h"
Full Trend-Filtered Strategy (Entry + Exit)
Enter on RSI dips in an uptrend, exit when the trend turns bearish or a profit target is hit.
[meta]
name = "Trend_Filtered_DCA"
description = "Buy RSI dips in uptrend, exit on trend reversal or +4%"

# ENTRY -- only in uptrend
[[actions]]
type = "open_long"
amount = "100 USDC"

  [[actions.triggers]]
  indicator = "ttm_trend"
  operator = "="
  target = "1"
  timeframe = "1h"

  [[actions.triggers]]
  indicator = "rsi_14"
  operator = "<"
  target = "30"
  timeframe = "1h"

# TAKE PROFIT
[[actions]]
type = "sell"
amount = "100%"

  [[actions.triggers]]
  type = "pos_price_change"
  value = "4%"

# TREND EXIT
[[actions]]
type = "sell"
amount = "100%"

  [[actions.triggers]]
  indicator = "ttm_trend"
  operator = "="
  target = "-1"
  timeframe = "1h"
Tips
TTM Trend is at its best when it acts as a filter for other indicators. RSI < 30 is a decent buy signal. RSI < 30 WHILE TTM Trend = 1 is a much better buy signal -- you are buying a dip within a confirmed uptrend rather than catching a falling knife in a downtrend.
A powerful pattern: use daily TTM Trend for the macro direction and hourly indicators for entry timing. ttm_trend = 1 on the daily chart confirms you are in a bull market, then RSI or MACD on the hourly chart picks the exact entry point. This dramatically reduces false entries during corrections within a larger uptrend.
The = operator works reliably with TTM Trend because it outputs discrete integers (1, 0, -1). Do not use = with indicators like RSI, SMA, EMA, or MACD -- those produce floating-point values like 29.87 or -142.53, and exact equality almost never matches. Use < or > for continuous indicators.
TTM Trend = 0 (neutral) often occurs during trend transitions. If the trend was bullish and shifts to neutral, it may be weakening before turning bearish. Consider using ttm_trend < 1 (not bullish) as a conservative exit trigger rather than waiting for full bearish confirmation at -1.
Price
Contents
Overview
price is not a calculated indicator -- it is the current candle's closing price. It allows you to compare raw price directly against indicator values, moving averages, Bollinger Bands, or fixed numeric levels.
Every other indicator in Botmarley derives a signal from price. Sometimes, though, you want to work with price itself: "Is the price above the 200-period SMA?" or "Has price dropped below the lower Bollinger Band?" or "Is price above 100,000?" The price field makes these comparisons possible.
This gives you the building block for classic technical analysis rules: support/resistance levels, moving average crossovers from price's perspective, and price-relative-to-band signals.
Format
price
Price has no period parameter. It always represents the close of the current candle on the specified timeframe. The format is simply price.
Value range: The actual market price of the asset. For BTC, this might be 50,000--100,000+. For a small-cap altcoin, it might be 0.001. Values are always positive.
price always refers to the closing price of the current candle on the trigger's timeframe. On a 1-hour chart, it is the close of the current hourly candle. On a daily chart, it is the close of the current daily candle.
How Price Works in Triggers
Price is unique because it can be used on either side of a trigger -- as the indicator or as the target.
Price as the indicator:
indicator = "price"
operator = "<"
target = "bb_lower"
Read as: "price is below the lower Bollinger Band."
Price as the target:
indicator = "bb_lower"
operator = ">"
target = "price"
Read as: "the lower Bollinger Band is above price." This is logically identical to the first form -- both mean price is below the lower Bollinger Band.
Price compared to a fixed value:
indicator = "price"
operator = ">"
target = "100000"
Read as: "price is above 100,000." This allows you to set absolute level-based triggers.
The flexibility of price means you can express the same condition in multiple ways. Choose whichever reads most naturally to you. Most traders find indicator = "price" with the comparison target to be the most intuitive form.
Understanding Operators with Price
All five operators work with price. The behavior follows the same state-based vs. event-based rules as other indicators.
< Price Below a Level -- State-Based
What it does: True on every candle where price is below the target value. This is a sustained condition.
[[actions.triggers]]
indicator = "price"
operator = "<"
target = "bb_lower"
timeframe = "1h"
On the chart: Price is sitting below the lower Bollinger Band. For as long as it stays there, this trigger fires on every candle. Use max_count to limit repeated firing, or switch to cross_below if you only want the initial break.
Common pairings:
price < bb_lower-- below the volatility envelope (oversold by Bollinger standards)price < sma_200-- below the long-term moving average (bearish territory)price < ema_50-- below the medium-term trend line
> Price Above a Level -- State-Based
What it does: True on every candle where price is above the target value. This is a sustained condition.
[[actions.triggers]]
indicator = "price"
operator = ">"
target = "sma_200"
timeframe = "1d"
Typical use: Trend filter. "Only allow entries when price is above the 200-day SMA" -- a classic bull-market confirmation. Because this is state-based, it works perfectly as a background filter for other entry signals.
Common pairings:
price > sma_200-- above the long-term trend (bullish territory)price > bb_upper-- above the volatility envelope (breakout or overbought)price > ema_20-- above the short-term trend
cross_above -- Price Crossing Above
What it does: Fires once at the exact candle where price transitions from below the target to above it. The previous candle's close was at or below the target; the current candle's close is above it.
[[actions.triggers]]
indicator = "price"
operator = "cross_above"
target = "ema_50"
timeframe = "1h"
On the chart: Price was below the EMA(50) line, then closes above it. This crossing moment fires the trigger once. This is the classic "golden cross from price's perspective" -- the moment price reclaims a key moving average.
Typical use: Breakout entries. When price crosses above a significant level (moving average, Bollinger middle band), it signals a potential trend shift. Event-based operators fire once, making them ideal for entry signals without needing max_count.
cross_below -- Price Crossing Below
What it does: Fires once at the exact candle where price transitions from above the target to below it.
[[actions.triggers]]
indicator = "price"
operator = "cross_below"
target = "sma_50"
timeframe = "1h"
Typical use: Breakdown signals. Price dropping below a key moving average can signal trend weakness. Use as an exit trigger or as a warning that the trend is changing.
= Exact Price -- Rarely Useful
What it does: True only when price exactly equals the target value.
[[actions.triggers]]
indicator = "price"
operator = "="
target = "100000"
Price is a floating-point value with many decimal places. The chance of price landing on exactly 100000.000000 is extremely low. In practice, = almost never fires with price. Use > or < instead, or use cross_above / cross_below to catch the moment price passes through a level.
TOML Examples
Price Below Bollinger Lower Band
The classic Bollinger Bounce entry. Price has extended more than 2 standard deviations below the mean -- a statistically significant move that often reverts.
[[actions]]
type = "open_long"
amount = "100 USDC"

  [[actions.triggers]]
  indicator = "price"
  operator = "<"
  target = "bb_lower"
  timeframe = "1h"
Price Above Long-Term Moving Average
Use price above the 200-period SMA on the daily chart as a macro trend filter. Only allow entries when the market is in confirmed bullish territory.
[[actions]]
type = "open_long"
amount = "100 USDC"

  [[actions.triggers]]
  indicator = "price"
  operator = ">"
  target = "sma_200"
  timeframe = "1d"

  [[actions.triggers]]
  indicator = "rsi_14"
  operator = "<"
  target = "35"
  timeframe = "1h"
Price Crosses Above EMA
Enter when price reclaims the 50-period EMA. This catches the moment price moves back above the medium-term trend line -- a potential trend resumption signal.
[[actions]]
type = "open_long"
amount = "100 USDC"

  [[actions.triggers]]
  indicator = "price"
  operator = "cross_above"
  target = "ema_50"
  timeframe = "1h"

  [[actions.triggers]]
  indicator = "macd_line"
  operator = ">"
  target = "0"
  timeframe = "1h"
Absolute Price Target
Sell when price breaks above a specific level. Useful for taking profit at a predetermined price target.
[[actions]]
type = "sell"
amount = "50%"

  [[actions.triggers]]
  indicator = "price"
  operator = "cross_above"
  target = "100000"
  timeframe = "1h"
  max_count = 1
Tips
price can be used on either side of the trigger. These two triggers are logically identical:
indicator = "price",operator = "<",target = "bb_lower"-- "price is below the lower band"indicator = "bb_lower",operator = ">",target = "price"-- "the lower band is above price"
Choose whichever reads more naturally. Most strategies use indicator = "price" because it reads like plain English: "price below X."
The simplest trend filter in technical analysis: is price above or below a key moving average? price > sma_200 on the daily chart has been used for decades to define bull vs. bear markets. Add it as a background filter to virtually any strategy to avoid trading against the major trend.
If you want to act when price hits a specific level (a round number like 100,000, or a moving average), use cross_above or cross_below instead of > or <. The cross operator fires once at the moment of crossing. The comparison operators fire on every candle while the condition holds, which can cause repeated actions without max_count.
When using fixed numeric targets like target = "100000", remember that this value is specific to the trading pair. A strategy with price > 100000 makes sense for BTC/USDC but is meaningless for ETH/USDC. If you reuse strategy templates across pairs, prefer indicator-relative targets (like bb_lower or sma_200) over hardcoded price levels.
RSTD -- Rolling Standard Deviation
Contents
Overview
Rolling Standard Deviation (RSTD) measures the dispersion of closing prices around their rolling mean over the last N candles. In simple terms, it tells you how spread out recent prices are -- it quantifies volatility based on close-to-close variation.
The calculation is straightforward: take the last N closing prices, compute their mean, then compute the standard deviation. A high RSTD means closing prices have been scattered far from their average -- the market is volatile. A low RSTD means closing prices are clustered tightly around their average -- the market is quiet and compressed.
The key distinction from ATR: ATR uses the high-low-close True Range, capturing intrabar volatility (wicks, gaps). RSTD uses only closing prices, capturing close-to-close variation. This makes RSTD the foundation for both Z-Score and Bollinger Bands. If you think of ATR as "how wide do candles get," think of RSTD as "how much do closes jump around." Both are volatility measures, but they capture different dimensions of it.
Format
rstd_{period}
The period defines the lookback window -- how many closing prices are included in the standard deviation calculation.
| Example | Period | Use Case |
|---|---|---|
rstd_20 | 20 | Standard -- matches Bollinger Band default, good balance of responsiveness and smoothness |
rstd_50 | 50 | Slower -- captures longer-term volatility regime, filters out short spikes |
rstd_10 | 10 | Fast -- reacts quickly to sudden volatility shifts, noisier |
Period range: 5 to 500.
Value range: 0 to infinity (always positive, denominated in the asset's price currency -- same units as price and ATR).
Understanding RSTD Values
Like ATR, RSTD values are not normalized to a fixed scale. They are denominated in the same currency as the asset's price. This means RSTD thresholds must be calibrated per asset and timeframe.
| Asset | Timeframe | Typical RSTD(20) Range | What It Means |
|---|---|---|---|
| BTC/USDC | 1h | 150 -- 600 | BTC closes typically deviate $150--$600 from their 20-period mean |
| BTC/USDC | 1d | 800 -- 2,500 | BTC daily closes deviate $800--$2,500 from their 20-day mean |
| ETH/USDC | 1h | 10 -- 50 | ETH closes typically deviate $10--$50 from their 20-period mean |
| SOL/USDC | 1h | 0.30 -- 2.50 | SOL closes typically deviate $0.30--$2.50 from their 20-period mean |
The values above are illustrative and vary with market conditions. During high-volatility events, RSTD can spike to 3--5x its normal range. Always check recent RSTD values for your specific pair and timeframe. Backtesting is the best way to calibrate thresholds.
Understanding Operators with RSTD
Each operator behaves differently with RSTD. Because RSTD is a volatility filter (it describes the market's current dispersion, not direction), it is almost always used in combination with directional triggers.
> (Greater Than) -- State-Based
What it does: The trigger is true on every candle where RSTD is above the threshold.
On the chart: Price dispersion is elevated. Closing prices are jumping around significantly from candle to candle. This trigger stays active for as long as RSTD remains above the threshold.
[[actions.triggers]]
indicator = "rstd_20"
operator = ">"
target = "400"
timeframe = "1h"
Typical use: "Only trade when close-to-close variation is high enough." High RSTD means there is enough directional movement in closing prices to justify entry. This filters out sideways chop where candles have large wicks but close near each other.
< (Less Than) -- State-Based
What it does: The trigger is true on every candle where RSTD is below the threshold.
On the chart: Price dispersion is compressed. Closes are clustering tightly around the mean -- a volatility squeeze. This is the setup phase before many breakouts.
[[actions.triggers]]
indicator = "rstd_20"
operator = "<"
target = "150"
timeframe = "1h"
Typical use: Detect low-dispersion squeeze environments. When RSTD drops to unusually low levels, it means prices are coiling. Combine with a directional breakout trigger to enter when the squeeze resolves.
cross_above -- Event-Based
What it does: Fires once, at the exact candle where RSTD transitions from below the threshold to above it. The previous candle had RSTD <= the target, and the current candle has RSTD > the target.
[[actions.triggers]]
indicator = "rstd_20"
operator = "cross_above"
target = "300"
timeframe = "1h"
Typical use: Detect the moment volatility expands. This captures the transition from a compressed market to a dispersed one -- the squeeze is breaking. Combine with a directional indicator (RSI, ROC, or MACD) to determine entry direction.
cross_below -- Event-Based
What it does: Fires once, at the exact candle where RSTD transitions from above the threshold to below it. The previous candle had RSTD >= the target, and the current candle has RSTD < the target.
[[actions.triggers]]
indicator = "rstd_20"
operator = "cross_below"
target = "200"
timeframe = "1h"
Typical use: Detect the moment volatility contracts. Useful for exiting positions when the market quiets down, or for initiating squeeze-detection logic -- once RSTD drops below the threshold, start watching for a breakout.
= (Equal) -- Not Recommended for RSTD
Why: RSTD produces floating-point values that are rarely exactly equal to any specific number. Use > or < instead.
- Use
>to ensure close-to-close dispersion is high enough for meaningful moves. This is the most common RSTD operator. - Use
<to detect volatility squeezes where price is coiling before a breakout. - Use
cross_above/cross_belowto detect the exact moment a volatility regime changes.
TOML Examples
Volatility Expansion: Short vs Long Period
Compare short-period RSTD against long-period RSTD to detect volatility expansion. When the fast RSTD exceeds the slow RSTD, recent volatility is accelerating relative to the longer-term norm -- a breakout may be underway. Combine with positive momentum to enter long.
[[actions]]
type = "open_long"
amount = "100 USDC"

  [[actions.triggers]]
  indicator = "rstd_20"
  operator = ">"
  target = "rstd_50"
  timeframe = "1h"

  [[actions.triggers]]
  indicator = "roc_10"
  operator = ">"
  target = "1.5"
  timeframe = "1h"
Low Volatility Squeeze Entry
Wait for a volatility squeeze (RSTD drops to unusually low levels) and then enter when price breaks above the upper Bollinger Band. The combination of compressed volatility + directional breakout often produces outsized moves.
[[actions]]
type = "open_long"
amount = "100 USDC"

  [[actions.triggers]]
  indicator = "rstd_20"
  operator = "<"
  target = "150"
  timeframe = "1h"

  [[actions.triggers]]
  indicator = "price"
  operator = ">"
  target = "bb_upper"
  timeframe = "1h"
RSI Dip Buy with Volatility Filter
A classic dip-buy strategy enhanced with an RSTD filter. Only enter when RSI is oversold AND close-to-close dispersion is high enough that a meaningful bounce is likely. This avoids buying dips in dead, flat markets where the "bounce" is a few cents.
[[actions]]
type = "open_long"
amount = "100 USDC"

  [[actions.triggers]]
  indicator = "rsi_14"
  operator = "<"
  target = "30"
  timeframe = "1h"

  [[actions.triggers]]
  indicator = "rstd_20"
  operator = ">"
  target = "300"
  timeframe = "1h"

  [[actions.triggers]]
  indicator = "sma_50"
  operator = ">"
  target = "sma_200"
  timeframe = "1d"
Tips
Like ATR, RSTD measures the magnitude of price variation, not the direction. A high RSTD during a selloff is the same as a high RSTD during a rally. Never use RSTD as a buy or sell signal on its own. It is a filter that tells you whether the market is moving, not which way.
You cannot use the same RSTD threshold for BTC and SOL. BTC's RSTD(20) on the hourly chart might be 400, while SOL's might be 1.20. Always calibrate your RSTD thresholds by checking the indicator's recent values for the specific pair and timeframe. Backtesting is the best way to find appropriate thresholds.
One of the most effective RSTD patterns is comparing a short-period RSTD against a long-period RSTD. When rstd_20 < rstd_50, recent volatility is below the longer-term norm -- a squeeze is forming. When rstd_20 > rstd_50, volatility is expanding. This relative comparison adapts automatically to changing market conditions, unlike a fixed threshold.
Z-Score is calculated as (price - mean) / rstd. If you understand RSTD, you understand the denominator of Z-Score. When RSTD is low, even a small price move produces a large Z-Score. When RSTD is high, it takes a big price move to produce an extreme Z-Score. Combining RSTD with Z-Score gives you both the volatility context and the statistical position of price.
Z-Score -- Standard Score
Contents
Overview
Z-Score measures how many standard deviations the current price is from its rolling mean. The formula is: Z = (price - mean) / standard_deviation, where both the mean and standard deviation are calculated over the last N closing prices.
The result translates raw price into a universal, dimensionless scale. A Z-Score of -2 means the current price is 2 standard deviations below the recent average -- statistically, this puts it in approximately the bottom 2.5% of the recent price distribution (assuming normality). A Z-Score of +2 means the opposite: price is in the top 2.5%.
This universality is what makes Z-Score powerful. Unlike ATR or RSTD, where thresholds must be recalibrated for every asset and timeframe, Z-Score thresholds are asset-agnostic. A Z-Score of -2 means "statistically cheap relative to recent history" whether you are trading BTC at $60,000 or SOL at $150. This makes Z-Score one of the most portable indicators for mean-reversion strategies -- you write the logic once, and it works across any pair.
Format
zscore_{period}
The period defines the lookback window used to calculate both the rolling mean and the rolling standard deviation.
| Example | Period | Use Case |
|---|---|---|
zscore_20 | 20 | Standard -- responsive to recent deviations, good for intraday mean reversion |
zscore_50 | 50 | Slower -- captures deviations from a longer-term average, fewer false signals |
zscore_100 | 100 | Long-term -- identifies major statistical outliers, best for swing/position trading |
Period range: 5 to 500.
Value range: Typically -4 to +4 (theoretically unbounded). 0 = price is exactly at its rolling mean. Negative = below mean. Positive = above mean.
Understanding Z-Score Values
Z-Score values are normalized and universal. The same thresholds apply across all assets and timeframes, which is a major advantage over price-denominated indicators like ATR and RSTD.
| Z-Score Range | Statistical Meaning | Trading Interpretation |
|---|---|---|
| > +3.0 | Top ~0.1% -- extreme outlier | Extremely overbought. Price has deviated far above the mean. High risk of reversion. |
| +2.0 to +3.0 | Top ~2.5% | Overbought. Statistically expensive. Mean-reversion sell zone. |
| +1.0 to +2.0 | Above average | Moderately elevated. Price is above the mean but within a normal range. |
| -1.0 to +1.0 | Within 1 standard deviation | Normal range. ~68% of prices fall here. No strong signal. |
| -2.0 to -1.0 | Below average | Moderately depressed. Price is below the mean but within a normal range. |
| -3.0 to -2.0 | Bottom ~2.5% | Oversold. Statistically cheap. Mean-reversion buy zone. |
| < -3.0 | Bottom ~0.1% -- extreme outlier | Extremely oversold. Price has deviated far below the mean. High probability of reversion. |
These statistical percentages assume a normal distribution. Crypto price returns have fat tails -- Z-Scores of -3 or -4 occur more frequently than a normal distribution would predict. This actually works in favor of mean-reversion strategies: the extremes are more common, giving you more trading opportunities, and the reversion tendency still holds.
Understanding Operators with Z-Score
Z-Score is primarily a mean-reversion indicator. It tells you when price has deviated "too far" from its recent average. The operators let you define what "too far" means for your strategy.
> (Greater Than) -- State-Based
What it does: The trigger is true on every candle where Z-Score is above the threshold.
On the chart: Price is elevated relative to its recent mean. The higher the Z-Score, the more statistically extended the price is. This trigger stays active for as long as the Z-Score remains above the threshold.
[[actions.triggers]]
indicator = "zscore_20"
operator = ">"
target = "2.0"
timeframe = "1h"
Typical use: "Price is statistically overbought -- consider taking profit or selling." When Z-Score exceeds +2.0, price is in the top ~2.5% of its recent range. For mean-reversion strategies, this is a sell or exit signal.
< (Less Than) -- State-Based
What it does: The trigger is true on every candle where Z-Score is below the threshold.
On the chart: Price is depressed relative to its recent mean. The more negative the Z-Score, the more statistically cheap the price is. This trigger stays active for as long as Z-Score remains below the threshold.
[[actions.triggers]]
indicator = "zscore_20"
operator = "<"
target = "-2.0"
timeframe = "1h"
Typical use: "Price is statistically oversold -- consider buying." When Z-Score drops below -2.0, price is in the bottom ~2.5% of its recent range. This is the classic mean-reversion buy signal. The assumption is that price will revert toward the mean.
cross_above -- Event-Based
What it does: Fires once, at the exact candle where Z-Score transitions from below the threshold to above it. The previous candle had Z-Score <= the target, and the current candle has Z-Score > the target.
[[actions.triggers]]
indicator = "zscore_20"
operator = "cross_above"
target = "0"
timeframe = "1h"
Typical use: Detect the moment price crosses back above the mean (Z-Score crosses above 0). In a mean-reversion strategy, this can signal that the reversion is complete -- price has returned to "normal." Also useful for detecting the moment price transitions into overbought territory (crossing above +2.0).
cross_below -- Event-Based
What it does: Fires once, at the exact candle where Z-Score transitions from above the threshold to below it. The previous candle had Z-Score >= the target, and the current candle has Z-Score < the target.
[[actions.triggers]]
indicator = "zscore_20"
operator = "cross_below"
target = "-2.0"
timeframe = "1h"
Typical use: Detect the exact moment price enters the oversold zone. Unlike < which stays active the entire time Z-Score is below -2.0, cross_below fires only at the transition -- ensuring you enter once per dip rather than on every candle during an extended decline.
= (Equal) -- Not Recommended for Z-Score
Why: Z-Score produces floating-point values that are rarely exactly equal to any specific number. Use > or < instead.
- Use
<with a negative target (e.g., -2.0) for mean-reversion buy entries. This is the most common Z-Score operator. - Use
>with a positive target (e.g., +1.0 or +2.0) for mean-reversion exits or overbought detection. - Use
cross_belowto enter once per dip (fires at the moment of transition, not on every candle). - Use
cross_aboveto detect the moment price returns to the mean (exit signal).
TOML Examples
Mean Reversion at Statistical Extreme
The classic Z-Score trade: buy when price drops to 2 standard deviations below the mean. This is a statistically rare event (~2.5% of the time under normal assumptions), and prices tend to revert toward the mean. Add a trend filter to avoid catching falling knives in a downtrend.
[[actions]]
type = "open_long"
amount = "100 USDC"

  [[actions.triggers]]
  indicator = "zscore_20"
  operator = "<"
  target = "-2.0"
  timeframe = "1h"

  [[actions.triggers]]
  indicator = "sma_50"
  operator = ">"
  target = "sma_200"
  timeframe = "1d"
Exit When Mean Reversion Completes
Close the position when Z-Score crosses back above +1.0 -- price has not only returned to the mean but has moved one standard deviation above it. This captures the full reversion move plus some continuation.
[[actions]]
type = "close_long"
amount = "100%"

  [[actions.triggers]]
  indicator = "zscore_20"
  operator = "cross_above"
  target = "1.0"
  timeframe = "1h"
Z-Score with Trend Filter
Buy statistically cheap price levels, but only when the broader trend supports it. The Z-Score provides the entry timing (price is 2.5 standard deviations below the mean), while the EMA crossover confirms the macro trend is bullish. This prevents mean-reversion entries during sustained downtrends.
[[actions]]
type = "open_long"
amount = "150 USDC"

  [[actions.triggers]]
  indicator = "zscore_50"
  operator = "<"
  target = "-2.5"
  timeframe = "1h"

  [[actions.triggers]]
  indicator = "ema_21"
  operator = ">"
  target = "ema_55"
  timeframe = "1d"

  [[actions.triggers]]
  indicator = "rsi_14"
  operator = "<"
  target = "40"
  timeframe = "1h"
Multi-Timeframe Z-Score Confluence
Enter only when Z-Score is oversold on BOTH the hourly and 4-hour timeframes. When two timeframes agree that price is statistically cheap, the mean-reversion signal is much stronger than a single-timeframe reading.
[[actions]]
type = "open_long"
amount = "200 USDC"

  [[actions.triggers]]
  indicator = "zscore_20"
  operator = "<"
  target = "-2.0"
  timeframe = "1h"

  [[actions.triggers]]
  indicator = "zscore_20"
  operator = "<"
  target = "-1.5"
  timeframe = "4h"
Tips
Z-Score assumes price will revert to the mean. In a strong trend (sustained rally or crash), price can stay at extreme Z-Score levels for extended periods. A Z-Score of -3 during a capitulation crash may go to -4, -5, or worse before reverting. Always combine Z-Score with a trend filter (e.g., SMA crossover, EMA direction) to avoid mean-reverting against the dominant trend.
Unlike ATR or RSTD where you need different thresholds for every asset, Z-Score thresholds work the same everywhere. A Z-Score of -2 means "bottom 2.5% of recent prices" whether you are trading BTC, ETH, SOL, or any other pair. This makes Z-Score strategies highly portable -- write once, deploy on any asset.
The most natural way to use Z-Score is as a complete mean-reversion system: enter at one extreme, exit at the opposite extreme or at the mean. For example, enter long when zscore_20 < -2.0 and exit when zscore_20 > 1.0. This creates a symmetric strategy that captures the full reversion move.
Z-Score divides the deviation from the mean by the rolling standard deviation (RSTD). This normalization is what makes the thresholds universal. If you want to understand why a Z-Score is extreme, look at the RSTD: if RSTD is very low (squeeze), even a small price move creates a large Z-Score. If RSTD is high, it takes a much bigger move to reach the same Z-Score level.
PRANK -- Percentile Rank
Contents
- Format
- Understanding Percentile Rank Values
- Understanding Operators with Percentile Rank
- TOML Examples
- Tips
Overview
Percentile Rank measures where the current closing price ranks among the last N closing prices, expressed as a percentage from 0 to 100. If the current price is the lowest close in the lookback window, the Percentile Rank is 0. If it is the highest, the Percentile Rank is 100. A value of 25 means the current price is higher than 25% of the closes in the window.
The calculation is simple: count how many of the last N closes are less than or equal to the current close, divide by N, and multiply by 100. No assumptions about distribution shape, no parameters beyond the lookback period. This simplicity is its strength.
The key advantage of Percentile Rank over Z-Score: it is distribution-free. Z-Score assumes prices are approximately normally distributed to interpret its thresholds (e.g., "Z = -2 means bottom 2.5%"). Percentile Rank makes no such assumption. A Percentile Rank of 5 means "the current price is in the bottom 5% of the last N closes" regardless of whether prices are normally distributed, skewed, or have fat tails. For crypto markets, where returns are decidedly non-normal, this non-parametric property is valuable. Percentile Rank tells you exactly what it says -- no statistical assumptions required.
Format
prank_{period}
The period defines the lookback window -- how many recent closing prices are compared against the current close.
| Example | Period | Use Case |
|---|---|---|
prank_50 | 50 | Standard -- ranks price among the last 50 closes, good for short-to-medium-term context |
prank_100 | 100 | Slower -- ranks price within a broader window, better for swing trading and position sizing |
prank_200 | 200 | Long-term -- provides context against a large historical sample, fewer extremes |
Period range: 10 to 500.
Value range: 0 to 100 (always). 0 = current price is the lowest close in the window. 100 = current price is the highest close in the window.
Understanding Percentile Rank Values
Percentile Rank values are bounded between 0 and 100 and have an intuitive interpretation that does not depend on the asset or timeframe. A value of 10 means "cheaper than 90% of recent closes" whether you are looking at BTC on the hourly chart or ETH on the daily chart.
| Percentile Rank | Meaning | Trading Interpretation |
|---|---|---|
| 95 -- 100 | Price is at or near the highest close in the window | Extremely expensive relative to recent history. Potential top. Contrarian sell zone. |
| 75 -- 95 | Price is in the upper quartile | Elevated. Market has been rallying. Trend-following strategies may stay long; mean-reversion strategies may start scaling out. |
| 25 -- 75 | Price is in the middle range | Normal territory. No strong signal from percentile rank alone. |
| 5 -- 25 | Price is in the lower quartile | Depressed. Market has pulled back. Starting to get interesting for dip buyers. |
| 0 -- 5 | Price is at or near the lowest close in the window | Extremely cheap relative to recent history. Potential bottom. Contrarian buy zone. |
Percentile Rank is relative to the lookback window. A prank_50 of 5 means "bottom 5% of the last 50 closes" -- it says nothing about where price stands relative to the last 200 or 500 closes. Longer periods provide more historical context but react more slowly to recent trends.
Understanding Operators with Percentile Rank
Percentile Rank is a contrarian positioning indicator. It tells you where price sits in the context of recent history. Extreme lows suggest buying opportunities; extreme highs suggest selling opportunities.
> (Greater Than) -- State-Based
What it does: The trigger is true on every candle where Percentile Rank is above the threshold.
On the chart: Price is ranking high among recent closes. The closer to 100, the closer price is to its recent high watermark. This trigger stays active for as long as the Percentile Rank remains above the threshold.
[[actions.triggers]]
indicator = "prank_100"
operator = ">"
target = "95"
timeframe = "1h"
Typical use: "Price is near the top of its recent range -- consider taking profit or reducing exposure." When Percentile Rank exceeds 95, the current price is higher than 95% of the last 100 closes. This is a contrarian signal that the move may be overextended.
< (Less Than) -- State-Based
What it does: The trigger is true on every candle where Percentile Rank is below the threshold.
On the chart: Price is ranking low among recent closes. The closer to 0, the closer price is to its recent low point. This trigger stays active for as long as Percentile Rank remains below the threshold.
[[actions.triggers]]
indicator = "prank_100"
operator = "<"
target = "5"
timeframe = "1h"
Typical use: "Price is near the bottom of its recent range -- consider buying." When Percentile Rank drops below 5, the current price is lower than 95% of the last 100 closes. This is the core contrarian buy signal. Price is historically cheap within the lookback window.
cross_above -- Event-Based
What it does: Fires once, at the exact candle where Percentile Rank transitions from below the threshold to above it. The previous candle had Percentile Rank <= the target, and the current candle has Percentile Rank > the target.
[[actions.triggers]]
indicator = "prank_100"
operator = "cross_above"
target = "50"
timeframe = "1h"
Typical use: Detect the moment price crosses above the median of its recent range. This can serve as an exit signal for mean-reversion trades: you bought in the bottom percentile, and now price has recovered to the middle of its range -- the reversion is complete.
cross_below -- Event-Based
What it does: Fires once, at the exact candle where Percentile Rank transitions from above the threshold to below it. The previous candle had Percentile Rank >= the target, and the current candle has Percentile Rank < the target.
[[actions.triggers]]
indicator = "prank_100"
operator = "cross_below"
target = "10"
timeframe = "1h"
Typical use: Detect the exact moment price falls into the bottom percentile zone. Unlike < which stays active the entire time Percentile Rank is below 10, cross_below fires only at the transition -- giving you a single entry signal per dip.
= (Equal) -- Not Recommended for Percentile Rank
Why: While Percentile Rank produces integer-like values more often than Z-Score, exact matches are still unreliable for triggering. Use > or < instead.
- Use
<with a low threshold (e.g., 5 or 10) to buy when price is at the bottom of its recent range. This is the most common Percentile Rank operator. - Use
>with a high threshold (e.g., 90 or 95) to sell or take profit when price is at the top of its recent range. - Use
cross_belowto enter once per dip (fires at the moment of transition, not on every candle). - Use
cross_aboveto detect the moment price recovers to mid-range (exit signal).
TOML Examples
Buy the Bottom 5th Percentile
The classic contrarian trade: buy when the current price is lower than 95% of the last 100 closes. This is a purely statistical signal -- price is at the extreme low of its recent range. Add a trend filter to avoid buying into a sustained downtrend.
[[actions]]
type = "open_long"
amount = "100 USDC"

  [[actions.triggers]]
  indicator = "prank_100"
  operator = "<"
  target = "5"
  timeframe = "1h"

  [[actions.triggers]]
  indicator = "sma_50"
  operator = ">"
  target = "sma_200"
  timeframe = "1d"
Exit at 60th Percentile
Close the position when price recovers to the 60th percentile of its recent range. This exits above the median, capturing the majority of the reversion move without waiting for price to reach the top of the range (which may never happen).
[[actions]]
type = "close_long"
amount = "100%"

  [[actions.triggers]]
  indicator = "prank_100"
  operator = "cross_above"
  target = "60"
  timeframe = "1h"
Percentile Rank with RSI Confluence
Combine Percentile Rank with RSI for double confirmation. Both indicators must agree that price is depressed: Percentile Rank says the price is in the bottom 10% of its recent range, and RSI says momentum is oversold. The confluence of two independent signals increases confidence in the entry.
[[actions]]
type = "open_long"
amount = "100 USDC"

  [[actions.triggers]]
  indicator = "prank_100"
  operator = "<"
  target = "10"
  timeframe = "1h"

  [[actions.triggers]]
  indicator = "rsi_14"
  operator = "<"
  target = "30"
  timeframe = "1h"

  [[actions.triggers]]
  indicator = "ema_21"
  operator = ">"
  target = "ema_55"
  timeframe = "1d"
DCA at Different Percentile Levels
Dollar-cost average into a position at progressively lower percentile levels. The deeper the dip, the larger the allocation. This creates a tiered entry strategy that averages into a position more aggressively as price becomes cheaper relative to recent history.
# Light entry at 15th percentile
[[actions]]
type = "open_long"
amount = "50 USDC"
[[actions.triggers]]
indicator = "prank_100"
operator = "cross_below"
target = "15"
timeframe = "4h"
# Medium entry at 8th percentile
[[actions]]
type = "open_long"
amount = "100 USDC"
[[actions.triggers]]
indicator = "prank_100"
operator = "cross_below"
target = "8"
timeframe = "4h"
# Heavy entry at 3rd percentile
[[actions]]
type = "open_long"
amount = "200 USDC"
[[actions.triggers]]
indicator = "prank_100"
operator = "cross_below"
target = "3"
timeframe = "4h"
Tips
A Percentile Rank of 0 means price is the lowest close in the last N periods -- but it says nothing about whether price will continue falling. In a sustained downtrend, price can print a Percentile Rank of 0 on every new candle as it keeps making new lows. Always combine Percentile Rank with a trend filter to avoid buying into an accelerating decline.
Unlike Z-Score, which interprets its thresholds based on a normal distribution assumption, Percentile Rank is completely non-parametric. A Percentile Rank of 5 literally means "current price is lower than 95% of the last N closes." No bell curve required. For crypto markets with fat tails and skewed returns, this is an advantage -- the number means exactly what it says.
Z-Score and Percentile Rank often agree, but when they diverge, it is informative. If Z-Score says -3 (extreme) but Percentile Rank says 15 (not that extreme), it means price is far from the mean but not actually near the lowest close -- volatility has expanded the Z-Score. Combining both gives you a parametric and non-parametric view of the same question: "Is this price cheap?"
A prank_50 reaching 5 means price is the cheapest of the last ~2 days of hourly candles -- a short-term dip. A prank_200 reaching 5 means price is the cheapest of the last ~8 days of hourly candles -- a more significant pullback. Choose your period based on your holding horizon: shorter periods for quick mean-reversion trades, longer periods for swing trades that may take days to play out.
Hurst -- Hurst Exponent
Contents
Overview
The Hurst Exponent measures the "memory" of a price series using Rescaled Range (R/S) analysis. It answers the most fundamental question in quantitative trading: is this market trending, mean-reverting, or random?
The calculation works by dividing the price series into sub-periods of varying lengths, computing the rescaled range (the range of cumulative deviations from the mean, divided by the standard deviation) for each, and then fitting a power law to find the exponent H. A Hurst Exponent of 0.5 corresponds to a random walk -- past price changes have no bearing on future ones. Values above 0.5 indicate persistence (trending behavior -- an up move is more likely to be followed by another up move). Values below 0.5 indicate anti-persistence (mean-reverting behavior -- an up move is more likely to be followed by a down move).
This is THE regime detector. If Hurst says the market is random (H near 0.5), no technical indicator has a statistical edge -- you are just gambling. Hurst above 0.55 means momentum strategies (MACD, EMA crossovers, breakout entries) have a mathematical basis. Hurst below 0.45 means mean-reversion strategies (RSI dip-buys, Z-Score entries, Bollinger Band bounces) have a mathematical basis. This is the foundation for all regime-adaptive strategies.
Format
hurst_{period}
The period defines the lookback window -- how many candles of price data are used to estimate the Hurst Exponent via R/S analysis.
| Example | Period | Use Case |
|---|---|---|
hurst_100 | 100 | Moderate lookback -- reacts faster to regime changes, noisier |
hurst_200 | 200 | Standard -- good balance of stability and responsiveness |
hurst_500 | 500 | Very stable -- captures the dominant long-term regime, slow to update |
Period range: 50 to 500.
Value range: 0 to 1 (always).
Understanding Hurst Values
| Hurst Range | Regime | Interpretation |
|---|---|---|
| 0.00 -- 0.40 | Strong mean reversion | Price frequently reverses direction. Past moves are strongly anti-persistent. Mean-reversion strategies (RSI, Z-Score, BB bounces) have strong edge. |
| 0.40 -- 0.50 | Weak mean reversion / random | Slight anti-persistence but close to random. The edge for mean reversion is marginal. Proceed with caution. |
| 0.50 | Pure random walk | No memory. Past prices give zero information about future direction. No technical strategy has a statistical edge. |
| 0.50 -- 0.60 | Weak trend | Slight persistence. Momentum strategies may work but the edge is marginal. Require strong confirmation signals. |
| 0.60 -- 1.00 | Strong trend | Price moves are highly persistent. Trends tend to continue. Momentum strategies (MACD, EMA crossovers, breakout entries) have strong edge. |
Hurst Exponent is a statistical property of the price series, not a timing signal. It tells you what kind of strategies will work in the current regime, not when to enter or exit. Always combine Hurst with a directional indicator for actual trade signals.
Understanding Operators with Hurst
Each operator behaves differently with Hurst. Because Hurst is a regime filter (it classifies the market's behavior, not its direction), it is almost always used as a gate on top of directional entry triggers.
> (Greater Than) -- State-Based
What it does: The trigger is true on every candle where the Hurst Exponent is above the threshold.
On the chart: The market is in a trending regime. Price moves tend to persist -- up follows up, down follows down. This trigger stays active for as long as Hurst remains above the threshold.
[[actions.triggers]]
indicator = "hurst_200"
operator = ">"
target = "0.55"
timeframe = "1h"
Typical use: "Only trade momentum strategies when the market is actually trending." A Hurst above 0.55 confirms that trend-following indicators (MACD, EMA crossovers) have a statistical basis. Without this filter, momentum signals in random-walk markets are just noise.
< (Less Than) -- State-Based
What it does: The trigger is true on every candle where the Hurst Exponent is below the threshold.
On the chart: The market is in a mean-reverting regime. Price moves tend to reverse -- deviations from the mean are corrected. This trigger stays active for as long as Hurst remains below the threshold.
[[actions.triggers]]
indicator = "hurst_200"
operator = "<"
target = "0.45"
timeframe = "1h"
Typical use: "Only trade mean-reversion strategies when the market is actually mean-reverting." A Hurst below 0.45 confirms that dip-buy strategies (RSI oversold, Z-Score below -2, price at lower Bollinger Band) have a mathematical edge.
cross_above -- Event-Based
What it does: Fires once, at the exact candle where the Hurst Exponent transitions from below the threshold to above it. The previous candle had Hurst <= the target, and the current candle has Hurst > the target.
[[actions.triggers]]
indicator = "hurst_200"
operator = "cross_above"
target = "0.55"
timeframe = "1h"
Typical use: Detect the moment the market shifts from random/mean-reverting into a trending regime. This is a regime change signal -- you may want to switch from mean-reversion strategies to momentum strategies, or enable a trend-following bot.
cross_below -- Event-Based
What it does: Fires once, at the exact candle where the Hurst Exponent transitions from above the threshold to below it. The previous candle had Hurst >= the target, and the current candle has Hurst < the target.
[[actions.triggers]]
indicator = "hurst_200"
operator = "cross_below"
target = "0.50"
timeframe = "1h"
Typical use: Detect the moment the market loses its trending character. When Hurst drops below 0.50, the trend has broken down and momentum strategies lose their edge. This can be used to exit trend-following positions or pause a momentum bot.
= (Equal) -- Not Recommended for Hurst
Why: Hurst produces floating-point values calculated to many decimal places. Exact equality (e.g., hurst_200 = 0.50) will almost never be true. Use > or < instead.
- Use
>to gate momentum strategies behind a trending regime. This is the most common Hurst operator. - Use
<to gate mean-reversion strategies behind an anti-persistent regime. - Use
cross_above/cross_belowto detect regime transitions and switch strategy modes.
TOML Examples
Trending Regime + MACD Entry
Only enter on MACD bullish crossovers when Hurst confirms the market is trending. Without the Hurst filter, MACD crossovers in random-walk markets produce many false signals.
[[actions]]
type = "open_long"
amount = "100 USDC"
[[actions.triggers]]
indicator = "hurst_200"
operator = ">"
target = "0.55"
timeframe = "1h"
[[actions.triggers]]
indicator = "macd_12_26_9"
operator = "cross_above"
target = "macd_signal"
timeframe = "1h"
Mean-Reverting Regime + RSI Entry
Only buy RSI oversold dips when Hurst confirms the market is mean-reverting. In a trending regime, RSI can stay oversold for extended periods as the trend continues lower.
[[actions]]
type = "open_long"
amount = "100 USDC"
[[actions.triggers]]
indicator = "hurst_200"
operator = "<"
target = "0.45"
timeframe = "1h"
[[actions.triggers]]
indicator = "rsi_14"
operator = "<"
target = "30"
timeframe = "1h"
max_count = 1
Avoid Random Walk Markets
Gate all entries behind a Hurst filter that excludes the random-walk zone. This strategy only enters when the market has clear character -- either trending (momentum entry) or mean-reverting (dip entry) -- and stays flat when the market is random.
# Momentum entry in trending regime
[[actions]]
type = "open_long"
amount = "75 USDC"
[[actions.triggers]]
indicator = "hurst_200"
operator = ">"
target = "0.55"
timeframe = "1h"
[[actions.triggers]]
indicator = "ema_12"
operator = "cross_above"
target = "ema_26"
timeframe = "1h"
# Dip entry in mean-reverting regime
[[actions]]
type = "open_long"
amount = "75 USDC"
[[actions.triggers]]
indicator = "hurst_200"
operator = "<"
target = "0.45"
timeframe = "1h"
[[actions.triggers]]
indicator = "rsi_14"
operator = "<"
target = "30"
timeframe = "1h"
max_count = 1
Hurst + Half-Life Combo
Combine Hurst with Half-Life for a complete mean-reversion setup. Hurst confirms the regime is mean-reverting, and Half-Life confirms the reversion happens fast enough to be tradeable.
[[actions]]
type = "open_long"
amount = "100 USDC"
[[actions.triggers]]
indicator = "hurst_200"
operator = "<"
target = "0.45"
timeframe = "1h"
[[actions.triggers]]
indicator = "halflife_200"
operator = "<"
target = "30"
timeframe = "1h"
[[actions.triggers]]
indicator = "rsi_14"
operator = "<"
target = "30"
timeframe = "1h"
max_count = 1
Tips
Hurst Exponent estimation is noisy on short lookback windows. With a period of 50 or 100, the value can jump around significantly from candle to candle, making it unreliable as a regime classifier. Use 200 or more candles for a stable reading. The trade-off is slower reaction to regime changes, but for a structural indicator like Hurst, stability matters more than speed.
Hurst tells you what kind of market you are in, not when to buy or sell. Always pair Hurst with a directional indicator. Hurst > 0.55 + MACD cross = trending momentum entry. Hurst < 0.45 + RSI oversold = mean-reversion dip entry. Hurst alone is useless for trade timing.
Build regime-adaptive strategies: when Hurst says "trending," use momentum indicators (MACD, EMA crossovers, ROC). When Hurst says "mean-reverting," use oscillators (RSI, StochRSI, Z-Score, Bollinger Bands). When Hurst says "random," stay flat. This single indicator decides which strategy gets activated.
Regimes are fractal -- a market can be trending on the daily timeframe but mean-reverting on the 5-minute chart. Compute Hurst on the timeframe that matches your trading horizon. For swing trades (holding days to weeks), use Hurst on daily candles. For intraday trades, use Hurst on hourly candles. Do not mix regime reads across timeframes.
Half-Life -- Half-Life of Mean Reversion
Contents
Overview
The Half-Life of Mean Reversion estimates how many candles it takes for price to revert halfway back to its mean, using OLS regression on an Ornstein-Uhlenbeck process. It answers the question: if price deviates from the mean, how fast does it snap back?
The calculation fits a linear regression to the price series' first differences against its lagged levels (the discrete Ornstein-Uhlenbeck model). The regression coefficient gives the speed of mean reversion, and the half-life is derived as -log(2) / coefficient. A short half-life means price deviations are corrected quickly -- the market snaps back to its mean within a few candles. A long half-life means reversion is sluggish or essentially non-existent.
The key insight: if Hurst Exponent tells you whether the market is mean-reverting, Half-Life tells you how fast that reversion happens. Knowing a market is mean-reverting is only half the picture -- you also need to know the timescale. If the half-life is 15 candles, you can expect a dip to recover halfway within 15 candles and calibrate your exits accordingly. If the half-life is 500 candles, reversion is so slow that it is practically useless for trading -- the statistical property exists but the time horizon is impractical.
Format
halflife_{period}
The period defines the lookback window -- how many candles of price data are used to estimate the mean-reversion speed via OLS regression.
| Example | Period | Use Case |
|---|---|---|
halflife_100 | 100 | Moderate lookback -- captures recent regime, reacts faster to changes |
halflife_200 | 200 | Standard -- stable estimate, good balance of accuracy and responsiveness |
halflife_500 | 500 | Very stable -- captures the dominant long-term mean-reversion speed |
Period range: 50 to 500.
Value range: 1 to very large (in candles). Practical useful range: 5 to 100 candles.
Understanding Half-Life Values
Half-Life values are expressed in candles (the number of bars on your chart). The interpretation depends on your timeframe:
| Half-Life (candles) | Speed | Interpretation |
|---|---|---|
| 1 -- 20 | Very fast | Day-trading territory. Price reverts halfway to the mean within 20 candles. On a 1h chart, that is less than a day. Excellent for short-term mean-reversion trades with tight time exits. |
| 20 -- 50 | Moderate | Swing-trading territory. On a 1h chart, reversion takes 1--2 days. Good for multi-day positions with RSI or Z-Score entries. Set time_in_position to roughly 2x the half-life. |
| 50 -- 100 | Slow | Position-trading territory. On a 1h chart, reversion takes 2--4 days. Only worthwhile if the deviation is large enough to justify holding that long. |
| 100+ | Impractically slow | Reversion exists statistically but takes too long to be tradeable. A half-life of 500 on the hourly chart means roughly 3 weeks to revert halfway. Other market dynamics will dominate before reversion completes. |
Half-Life values depend heavily on the timeframe. A half-life of 20 on the 1h chart means ~20 hours. A half-life of 20 on the 1d chart means ~20 days. Always interpret half-life in the context of your chart's timeframe.
Understanding Operators with Half-Life
Each operator behaves differently with Half-Life. Because Half-Life is a regime qualifier (it tells you how fast mean reversion works), it is almost always used in combination with a regime detector (Hurst) and a directional entry trigger (RSI, Z-Score).
< (Less Than) -- State-Based
What it does: The trigger is true on every candle where the Half-Life is below the threshold.
On the chart: Mean reversion is happening fast. Price deviations are being corrected quickly. This trigger stays active for as long as the half-life remains short.
[[actions.triggers]]
indicator = "halflife_200"
operator = "<"
target = "30"
timeframe = "1h"
Typical use: "Only trade mean-reversion strategies when reversion is fast enough to be profitable." A half-life below 30 candles means price should recover halfway within about 30 hours on the hourly chart -- fast enough for swing trades. This filters out markets where reversion is too slow to be practical.
> (Greater Than) -- State-Based
What it does: The trigger is true on every candle where the Half-Life is above the threshold.
On the chart: Mean reversion is slow or absent. Price deviations persist for long periods before correcting.
[[actions.triggers]]
indicator = "halflife_200"
operator = ">"
target = "100"
timeframe = "1h"
Typical use: Defensive filter -- "do not enter mean-reversion trades when the half-life is too long." If reversion takes 100+ candles, the trade will tie up capital for too long. Some strategies use halflife > 100 as a condition to exit or avoid mean-reversion positions entirely.
cross_below -- Event-Based
What it does: Fires once, at the exact candle where the Half-Life transitions from above the threshold to below it. The previous candle had Half-Life >= the target, and the current candle has Half-Life < the target.
[[actions.triggers]]
indicator = "halflife_200"
operator = "cross_below"
target = "30"
timeframe = "1h"
Typical use: Detect the moment the market transitions into a fast-reverting regime. When the half-life drops below 30, mean reversion just became tradeable. This can trigger the activation of mean-reversion entries.
cross_above -- Event-Based
What it does: Fires once, at the exact candle where the Half-Life transitions from below the threshold to above it. The previous candle had Half-Life <= the target, and the current candle has Half-Life > the target.
[[actions.triggers]]
indicator = "halflife_200"
operator = "cross_above"
target = "50"
timeframe = "1h"
Typical use: Detect the moment mean reversion slows down. When the half-life crosses above 50, the market is no longer reverting fast enough for swing trades. This can be used to disable mean-reversion entries or exit existing positions.
= (Equal) -- Not Recommended for Half-Life
Why: Half-Life produces floating-point values calculated to many decimal places. Exact equality (e.g., halflife_200 = 20) will almost never be true. Use < or > instead.
- Use
<to ensure mean reversion is fast enough to trade. This is the most common Half-Life operator. - Use
>to avoid or exit positions when reversion is too slow. - Use
cross_below/cross_aboveto detect the exact moment the reversion speed changes regime.
TOML Examples
Short Half-Life + RSI Dip Buy
Only buy RSI oversold dips when the half-life confirms fast mean reversion. A half-life below 25 candles on the hourly chart means price should recover halfway within about a day -- ideal for swing dip-buying.
[[actions]]
type = "open_long"
amount = "100 USDC"
[[actions.triggers]]
indicator = "halflife_200"
operator = "<"
target = "25"
timeframe = "1h"
[[actions.triggers]]
indicator = "rsi_14"
operator = "<"
target = "30"
timeframe = "1h"
max_count = 1
Half-Life-Based Time Exit
Use the half-life to calibrate your exit timing. If the half-life is 20 candles, the market should revert halfway in 20 bars and fully in roughly 40--60 bars. Set time_in_position to 2x the estimated half-life (here ~40 candles) as a time-based stop.
# Entry: dip buy with half-life confirmation
[[actions]]
type = "open_long"
amount = "100 USDC"
[[actions.triggers]]
indicator = "halflife_200"
operator = "<"
target = "20"
timeframe = "1h"
[[actions.triggers]]
indicator = "rsi_14"
operator = "<"
target = "30"
timeframe = "1h"
max_count = 1
# Exit: time-based stop calibrated to ~2x half-life
[[actions]]
type = "sell"
amount = "100%"
[[actions.triggers]]
type = "time_in_position"
candles = 40
timeframe = "1h"
Complete Regime Setup: Hurst + Half-Life + Entry
The full mean-reversion stack: Hurst confirms the market IS mean-reverting, Half-Life confirms reversion is fast enough, and RSI provides the actual entry signal.
[[actions]]
type = "open_long"
amount = "100 USDC"
[[actions.triggers]]
indicator = "hurst_200"
operator = "<"
target = "0.45"
timeframe = "1h"
[[actions.triggers]]
indicator = "halflife_200"
operator = "<"
target = "30"
timeframe = "1h"
[[actions.triggers]]
indicator = "rsi_14"
operator = "<"
target = "30"
timeframe = "1h"
max_count = 1
Tips
Hurst Exponent and Half-Life are complementary. Hurst tells you whether the market is mean-reverting (H < 0.5). Half-Life tells you how fast that reversion happens. A market with H = 0.35 and a half-life of 15 candles is a mean-reversion paradise. A market with H = 0.40 and a half-life of 300 candles is mean-reverting in theory but untradeable in practice. Always use both together.
If the estimated half-life is N candles, price should revert halfway in N candles and approximately fully in 2--3x N candles. Set your time_in_position exit to roughly 2x the half-life as a safety stop. If the trade has not recovered by then, the regime may have changed and you should exit.
Like Hurst, the Half-Life estimate is noisy on short lookback windows. The OLS regression needs enough data points to produce a reliable slope estimate. Use 200+ candles for the period. Shorter periods may produce wildly fluctuating half-life values that are not actionable.
When the half-life exceeds 100 candles on your timeframe, mean reversion is too slow to be profitable. On the hourly chart, 100 candles is over 4 days -- other market dynamics (news, macro events, sentiment shifts) will dominate before the statistical reversion completes. If the half-life is high, either switch to momentum strategies or stay flat.
Vol Regime -- Volatility Regime Classifier
Contents
Overview
The Volatility Regime Classifier categorizes the current volatility environment into three discrete regimes: low (1), medium (2), and high (3). Instead of requiring you to set raw ATR or RSTD thresholds that are asset-specific and timeframe-specific, vol_regime automatically classifies the current volatility by comparing it against its own recent history using rolling standard deviation percentiles.
The calculation works by computing the rolling standard deviation of price over the lookback period, then determining which percentile the current value falls into relative to the distribution of recent values. The bottom third maps to regime 1 (low), the middle third to regime 2 (medium), and the top third to regime 3 (high). This makes the indicator self-calibrating -- it adapts to the asset and timeframe automatically.
The key insight: instead of guessing absolute volatility thresholds (which differ for every trading pair and timeframe), vol_regime gives you a universal classification. Regime 1 means volatility is compressed relative to recent history -- compression precedes breakout, so this is the setup phase. Regime 2 means normal conditions -- most strategies work here. Regime 3 means volatility is elevated relative to recent history -- chaotic conditions where wider stops are needed and risk is higher. This single number replaces the need to manually calibrate ATR or RSTD thresholds for each pair.
Format
vol_regime_{period}
The period defines the lookback window -- how many candles of data are used to compute the rolling standard deviation and its percentile classification.
| Example | Period | Use Case |
|---|---|---|
vol_regime_50 | 50 | Faster adaptation -- reacts quickly to volatility shifts, but more regime flickering |
vol_regime_100 | 100 | Standard -- good balance of stability and responsiveness |
vol_regime_200 | 200 | Very stable -- slower to reclassify, but fewer false regime changes |
Period range: 50 to 500.
Value range: Discrete: 1, 2, or 3.
Understanding Vol Regime Values
Unlike most indicators that produce continuous floating-point values, Vol Regime outputs one of three discrete integers:
| Value | Regime | Interpretation |
|---|---|---|
| 1 | Low volatility | The market is calm and compressed. Volatility is in the bottom third of its recent range. This is the squeeze/setup phase -- low volatility periods often precede explosive breakouts. Good for accumulation and squeeze-breakout strategies. |
| 2 | Medium volatility | Normal market conditions. Volatility is in the middle third of its recent range. Most strategies work here without special adjustments. This is the "default" regime. |
| 3 | High volatility | The market is chaotic and volatile. Volatility is in the top third of its recent range. Wider stops are needed, position sizes should be reduced, and false signals increase. Some strategies should stay flat entirely in regime 3. |
Because vol_regime outputs discrete values (1, 2, 3), you use fractional thresholds like 1.5 and 2.5 with < and > operators to identify specific regimes. vol_regime < 1.5 means "regime 1 (low)." vol_regime > 2.5 means "regime 3 (high)." This avoids the floating-point equality problem.
Understanding Operators with Vol Regime
Each operator behaves differently with Vol Regime. Because the indicator outputs discrete values (1, 2, 3), the operator thresholds are set between values (1.5 and 2.5) to cleanly identify regimes.
< (Less Than) -- State-Based
What it does: The trigger is true on every candle where the vol regime value is below the threshold.
On the chart: The market is in a low-volatility phase. Price is moving in small increments relative to recent history. This trigger stays active for the entire duration of the low-vol regime.
[[actions.triggers]]
indicator = "vol_regime_100"
operator = "<"
target = "1.5"
timeframe = "1h"
Typical use: "Only enter when volatility is compressed." Low-volatility regimes are the setup phase for squeeze breakouts. Combining vol_regime < 1.5 with a directional breakout signal captures the expansion move from a compressed base.
> (Greater Than) -- State-Based
What it does: The trigger is true on every candle where the vol regime value is above the threshold.
On the chart: The market is in a high-volatility phase. Price is swinging wildly relative to recent history. This trigger stays active for the entire duration of the high-vol regime.
[[actions.triggers]]
indicator = "vol_regime_100"
operator = ">"
target = "2.5"
timeframe = "1h"
Typical use: Defensive filter -- "exit or do not enter during high-volatility regimes." Regime 3 conditions produce more false signals, wider spreads, and larger drawdowns. Some strategies use vol_regime > 2.5 as a sell trigger or as a gate to prevent new entries.
cross_below -- Event-Based
What it does: Fires once, at the exact candle where vol regime transitions from above the threshold to below it. The previous candle had vol_regime >= the target, and the current candle has vol_regime < the target.
[[actions.triggers]]
indicator = "vol_regime_100"
operator = "cross_below"
target = "1.5"
timeframe = "1h"
Typical use: Detect the moment the market enters a low-volatility regime. This signals that the squeeze phase has begun -- start watching for directional breakout signals.
cross_above -- Event-Based
What it does: Fires once, at the exact candle where vol regime transitions from below the threshold to above it. The previous candle had vol_regime <= the target, and the current candle has vol_regime > the target.
[[actions.triggers]]
indicator = "vol_regime_100"
operator = "cross_above"
target = "2.5"
timeframe = "1h"
Typical use: Detect the moment volatility spikes into the high regime. This can trigger a defensive exit -- when vol regime crosses above 2.5, the market just became chaotic and existing positions may need to be closed or hedged.
= (Equal) -- Not Recommended for Vol Regime
Why: Although vol_regime outputs integers (1, 2, 3), the underlying computation may produce floating-point values that are very close to but not exactly equal to these integers. Use < 1.5 for regime 1, > 1.5 combined with < 2.5 for regime 2, and > 2.5 for regime 3.
- Use
< 1.5to identify low-volatility regimes (regime 1) for squeeze-breakout strategies. - Use
> 2.5to identify high-volatility regimes (regime 3) for defensive exits or position sizing. - Use
cross_below 1.5/cross_above 2.5to detect the exact moment of regime transitions.
TOML Examples
Buy Only in Low Volatility Regime
Enter when the market is in a low-volatility squeeze and price breaks above the upper Bollinger Band. The compressed volatility (regime 1) combined with a directional breakout often produces outsized moves.
[[actions]]
type = "open_long"
amount = "100 USDC"
[[actions.triggers]]
indicator = "vol_regime_100"
operator = "<"
target = "1.5"
timeframe = "1h"
[[actions.triggers]]
indicator = "price"
operator = ">"
target = "bb_upper"
timeframe = "1h"
Exit When High Volatility Arrives
Sell the position when the market enters a high-volatility regime. Regime 3 conditions are chaotic -- protect profits by exiting before volatility causes a sharp drawdown.
[[actions]]
type = "sell"
amount = "100%"
[[actions.triggers]]
indicator = "vol_regime_100"
operator = "cross_above"
target = "2.5"
timeframe = "1h"
Adaptive Entry: Low Vol + Trend
Combine the low-volatility squeeze with a trend confirmation. Only buy when volatility is compressed (regime 1) AND the daily trend is bullish (SMA 50 above SMA 200). This is the classic "buy the quiet before the storm" setup within a confirmed uptrend.
[[actions]]
type = "open_long"
amount = "100 USDC"
[[actions.triggers]]
indicator = "vol_regime_100"
operator = "<"
target = "1.5"
timeframe = "1h"
[[actions.triggers]]
indicator = "sma_50"
operator = ">"
target = "sma_200"
timeframe = "1d"
[[actions.triggers]]
indicator = "roc_10"
operator = ">"
target = "0.5"
timeframe = "1h"
Vol Regime + Hurst Combo
The ultimate regime-aware strategy. Hurst confirms the market is trending, vol regime confirms volatility is not chaotic, and MACD provides the entry signal. This triple filter produces high-conviction entries in favorable conditions.
[[actions]]
type = "open_long"
amount = "100 USDC"
[[actions.triggers]]
indicator = "hurst_200"
operator = ">"
target = "0.55"
timeframe = "1h"
[[actions.triggers]]
indicator = "vol_regime_100"
operator = "<"
target = "2.5"
timeframe = "1h"
[[actions.triggers]]
indicator = "macd_12_26_9"
operator = "cross_above"
target = "macd_signal"
timeframe = "1h"
Tips
Because vol_regime outputs discrete integers (1, 2, 3), use fractional thresholds to cleanly identify regimes: < 1.5 for low volatility (regime 1), > 2.5 for high volatility (regime 3). For medium volatility, use > 1.5 AND < 2.5 as two separate triggers. This is cleaner and more reliable than trying to use = with integer values.
Short periods (50) cause more frequent regime flickering -- the classification bounces between regimes as individual candles enter and leave the lookback window. Longer periods (100--200) produce more stable regime reads. Use 100 as a good default, and increase to 200 if you see too many false regime transitions.
Vol Regime tells you about volatility conditions. Hurst tells you about trend/mean-reversion character. Together they give you a complete market regime picture: Is the market trending or mean-reverting? (Hurst.) Is volatility compressed, normal, or elevated? (Vol Regime.) Use both to select the right strategy AND the right risk parameters for the current environment.
Volatility regimes are structural -- they describe the market's character over days and weeks, not minutes. While vol_regime works on any timeframe, it is most meaningful on the daily chart where it captures true regime shifts rather than intraday noise. Use the hourly or daily timeframe for regime classification, even if your entries are on lower timeframes like 15m or 5m.
VWAP -- Volume-Weighted Average Price
Contents
Overview
Volume-Weighted Average Price (VWAP) is the average price an asset has traded at, weighted by volume, cumulative from the session start. Unlike a simple moving average that treats every candle equally, VWAP gives more weight to prices where more volume transacted. It answers the question: what is the true average price that reflects where actual trading occurred?
The calculation is cumulative:
VWAP = cumulative(typical_price x volume) / cumulative(volume)
Where typical_price = (high + low + close) / 3. At each candle, the numerator and denominator are accumulated from the first available candle. This means VWAP is anchored -- it does not have a sliding window like SMA or EMA. Early in the session, VWAP is more responsive to new data. As the session progresses, it becomes increasingly stable because it incorporates more and more historical volume.
VWAP is THE institutional benchmark. Large funds and algorithmic traders use VWAP to measure execution quality -- a buy order filled below VWAP is considered a "good" fill, while a fill above VWAP is considered "poor." This institutional usage creates a self-fulfilling dynamic: price below VWAP attracts institutional buying (they are getting a discount), while price above VWAP attracts institutional selling (they are locking in above-average prices). For retail traders, this means VWAP acts as a dynamic support/resistance level that institutional players actually respect.
Format
vwap
VWAP has no period parameter. It is cumulative from the first available candle in the session.
| Example | Period | Use Case |
|---|---|---|
vwap | None (cumulative) | The volume-weighted average price -- institutional benchmark for fair value |
Period range: Not applicable -- VWAP is always cumulative.
Value range: Price-denominated (same units as the asset's price). VWAP tracks very close to the actual price since it is an average of traded prices.
Understanding VWAP Values
VWAP values are in the same currency as the asset's price. The key is not the absolute value but the relationship between price and VWAP.
| Price vs. VWAP | Interpretation |
|---|---|
| Price well below VWAP | Trading at a discount to volume-weighted fair value. Institutional buyers may see this as attractive. Potential support zone. |
| Price slightly below VWAP | Near fair value, leaning cheap. VWAP may act as a magnet pulling price back up. |
| Price at VWAP | At the volume-weighted average -- equilibrium. No directional edge. |
| Price slightly above VWAP | Near fair value, leaning expensive. VWAP may act as a magnet pulling price back down. |
| Price well above VWAP | Trading at a premium to volume-weighted fair value. Institutional sellers may see this as a good exit. Potential resistance zone. |
VWAP is cumulative and anchored to the session start. As the session progresses, VWAP becomes increasingly stable and harder to move. Early in a session, VWAP is more volatile and reactive. The most reliable VWAP signals come after enough volume has been accumulated to establish a meaningful average.
Understanding Operators with VWAP
Each operator behaves differently with VWAP. Because VWAP is a dynamic price level (not an oscillator), it is most commonly compared against price or used as a target for other indicators.
> (Greater Than) -- State-Based
What it does: The trigger is true on every candle where price is above VWAP. This indicates the asset is trading at a premium to the volume-weighted average.
On the chart: Imagine the VWAP line drawn through the candles. Whenever price is above this line, the trigger is active. The asset is "expensive" relative to where most volume traded.
[[actions.triggers]]
indicator = "price"
operator = ">"
target = "vwap"
timeframe = "1h"
Typical use: Filter for bullish conditions. Price above VWAP means buyers are in control and willing to pay above the average. Combine with momentum indicators for long entries.
< (Less Than) -- State-Based
What it does: The trigger is true on every candle where price is below VWAP. This indicates the asset is trading at a discount to the volume-weighted average.
On the chart: Price is below the VWAP line. The asset is "cheap" relative to where most volume traded -- institutional buyers may be accumulating.
[[actions.triggers]]
indicator = "price"
operator = "<"
target = "vwap"
timeframe = "1h"
Typical use: Discount-buying strategy. When price is below VWAP, you are buying at a price that institutional algorithms consider a bargain. Combine with an RSI dip or support level for precision.
cross_above -- Event-Based
What it does: Fires once, at the exact candle where price transitions from below VWAP to above it. The previous candle had price <= VWAP, and the current candle has price > VWAP.
[[actions.triggers]]
indicator = "price"
operator = "cross_above"
target = "vwap"
timeframe = "1h"
Typical use: Bullish VWAP crossover entry. When price crosses above VWAP, it signals that buyers have seized control and pushed the price above the institutional fair value line. This is a commonly used intraday entry signal.
cross_below -- Event-Based
What it does: Fires once, at the exact candle where price transitions from above VWAP to below it. The previous candle had price >= VWAP, and the current candle has price < VWAP.
[[actions.triggers]]
indicator = "price"
operator = "cross_below"
target = "vwap"
timeframe = "1h"
Typical use: Bearish VWAP crossover exit. When price drops below VWAP, sellers have pushed the market below institutional fair value. This can signal the start of distribution or a shift to bearish control.
= (Equal) -- Not Recommended for VWAP
Why: VWAP and price are both floating-point values that change with every candle. Exact equality between price and VWAP will almost never occur. Use < or > instead, or use cross_above / cross_below to detect the moment price transitions through VWAP.
- Use
</>when you want to act while price is on one side of VWAP (state-based). Pair withmax_countto limit repeated firing. - Use
cross_above/cross_belowwhen you want to act at the moment price pierces through VWAP (event-based). Nomax_countneeded -- crossovers fire once by nature.
TOML Examples
Buy Below VWAP
The simplest VWAP strategy. Accumulate when price is trading below the institutional benchmark. The max_count limits entries so you do not keep buying on every candle below VWAP.
[[actions]]
type = "open_long"
amount = "100 USDC"
[[actions.triggers]]
indicator = "price"
operator = "<"
target = "vwap"
timeframe = "1h"
max_count = 3
Sell Above VWAP
Exit positions when price is trading above VWAP -- you are selling at a premium to the volume-weighted average.
[[actions]]
type = "sell"
amount = "100%"
[[actions.triggers]]
indicator = "price"
operator = ">"
target = "vwap"
timeframe = "1h"
max_count = 1
VWAP Bounce with Deviation Confirmation
Buy when price is below VWAP (discount zone) AND VWAP Deviation confirms the discount is statistically significant (more than 1.5 standard deviations below VWAP). This avoids buying minor VWAP dips that lack statistical edge.
[[actions]]
type = "open_long"
amount = "100 USDC"
[[actions.triggers]]
indicator = "price"
operator = "<"
target = "vwap"
timeframe = "1h"
[[actions.triggers]]
indicator = "vwap_dev_20"
operator = "<"
target = "-1.5"
timeframe = "1h"
[[actions.triggers]]
indicator = "rsi_14"
operator = "<"
target = "40"
timeframe = "1h"
Price Crosses Above VWAP Entry
Enter at the moment price crosses above VWAP with a bullish macro trend. This is the classic intraday VWAP breakout.
[[actions]]
type = "open_long"
amount = "100 USDC"
[[actions.triggers]]
indicator = "price"
operator = "cross_above"
target = "vwap"
timeframe = "1h"
[[actions.triggers]]
indicator = "sma_50"
operator = ">"
target = "sma_200"
timeframe = "1d"
Tips
Because institutional algorithms buy below VWAP and sell above it, VWAP functions as a dynamic support/resistance level that adapts to each session's trading activity. Price tends to gravitate toward VWAP and often bounces off it. This makes VWAP a powerful level for entries and exits -- far more meaningful than arbitrary fixed support/resistance lines.
Raw VWAP tells you "price is below fair value." VWAP Deviation (vwap_dev_20) tells you "price is 2.3 standard deviations below fair value." The combination is far more powerful: VWAP gives you the level, VWAP Dev gives you the statistical significance. A VWAP dip at -0.5 dev is noise; a VWAP dip at -2.0 dev is a rare statistical event worth acting on.
VWAP accumulates from the session start, so it becomes increasingly stable as more data is incorporated. Early in a session, VWAP is volatile and reactive. After many candles, it takes massive volume to move VWAP significantly. This means VWAP signals are most reliable after the session has been running long enough to establish a meaningful average.
VWAP tells you where the market considers fair value based on volume-weighted prices. It does not predict direction. In a strong downtrend, price can stay below VWAP for the entire session -- buying every VWAP discount would be disastrous. Always combine VWAP with trend confirmation (SMA crossovers, RSI) and risk management (stop-losses, max_count).
VWAP Dev -- VWAP Deviation
Contents
Overview
VWAP Deviation measures how many standard deviations the current closing price is from VWAP. It adds statistical rigor to VWAP analysis by quantifying not just whether price is above or below VWAP, but how extreme the deviation is relative to recent behavior.
The calculation is:
VWAP Dev = (close - VWAP) / rolling_std(close - VWAP, period)
Where rolling_std is the standard deviation of the difference between close and VWAP over the lookback period. This is conceptually identical to a Z-Score, but measured relative to VWAP instead of a simple moving average. The result tells you: "the current close is X standard deviations away from VWAP."
The key insight: instead of just knowing "price is below VWAP," VWAP Deviation tells you "price is 2.5 standard deviations below VWAP" -- a statistically rare event. Under normal distribution assumptions, values beyond +/-2.0 occur only about 5% of the time. The further from zero, the more extreme and unusual the current price is relative to the volume-weighted average. This transforms VWAP from a simple level into a statistically grounded framework for identifying high-probability mean-reversion opportunities.
Format
vwap_dev_{period}
The period defines the lookback window used to calculate the rolling standard deviation of the close-to-VWAP difference.
| Example | Period | Use Case |
|---|---|---|
vwap_dev_20 | 20 | Standard -- responsive to recent VWAP deviation patterns |
vwap_dev_50 | 50 | Slower -- captures longer-term VWAP deviation norms, fewer false extremes |
vwap_dev_10 | 10 | Fast -- reacts quickly but noisier, more frequent extreme readings |
Period range: 5 to 500.
Value range: Typically -4.0 to +4.0 (like Z-Score). 0 = price is at VWAP. Negative = price is below VWAP. Positive = price is above VWAP. Extreme values beyond +/-3.0 are rare and represent significant statistical events.
Understanding VWAP Dev Values
VWAP Dev uses a standardized scale (standard deviations), so its thresholds are universal -- unlike raw VWAP which is denominated in the asset's price currency. A VWAP Dev of -2.0 means the same thing for BTC, ETH, or SOL: price is 2 standard deviations below VWAP.
| VWAP Dev Range | Zone | Interpretation |
|---|---|---|
| Below -2.0 | Extreme discount | Price is far below VWAP -- a statistically rare event. Strong mean-reversion potential. Institutional buyers may view this as a significant bargain. |
| -2.0 to -1.0 | Moderate discount | Price is meaningfully below VWAP. Discount is notable but not extreme. Worth watching for confirmation. |
| -1.0 to 0 | Slight discount | Price is near VWAP, slightly below. Weak directional signal. Normal variation. |
| 0 to +1.0 | Slight premium | Price is near VWAP, slightly above. Normal variation. No strong signal. |
| +1.0 to +2.0 | Moderate premium | Price is meaningfully above VWAP. Profits may be taken. Overbought relative to volume-weighted average. |
| Above +2.0 | Extreme premium | Price is far above VWAP -- a statistically rare event. Strong mean-reversion potential to the downside. Consider taking profits or exiting. |
VWAP Dev is based on the same statistical framework as Z-Score. Under a normal distribution, values beyond +/-2.0 occur about 5% of the time, and values beyond +/-3.0 occur about 0.3% of the time. Crypto markets are not perfectly normal (they have fat tails), so extreme values occur somewhat more often -- but they still represent meaningful statistical events.
Understanding Operators with VWAP Dev
Each operator behaves differently with VWAP Dev. Because VWAP Dev is a standardized measure of deviation, it excels at identifying extremes for mean-reversion strategies.
< (Less Than) -- State-Based
What it does: The trigger is true on every candle where VWAP Dev is below the threshold. This detects periods when price is trading at a statistically significant discount to VWAP.
On the chart: Price has drifted far below the VWAP line. The further negative the VWAP Dev reading, the more extreme the discount. This trigger stays active for as long as VWAP Dev remains below the threshold.
[[actions.triggers]]
indicator = "vwap_dev_20"
operator = "<"
target = "-2.0"
timeframe = "1h"
Typical use: Mean-reversion buy signal. When VWAP Dev is below -2.0, price is at a statistically rare discount to VWAP. This is the primary VWAP Dev operator for entry strategies.
> (Greater Than) -- State-Based
What it does: The trigger is true on every candle where VWAP Dev is above the threshold. This detects periods when price is trading at a statistically significant premium to VWAP.
On the chart: Price has drifted far above the VWAP line. The higher the VWAP Dev reading, the more stretched the premium.
[[actions.triggers]]
indicator = "vwap_dev_20"
operator = ">"
target = "1.5"
timeframe = "1h"
Typical use: Exit signal or overextension warning. When VWAP Dev exceeds +1.5 or +2.0, price is stretched above its volume-weighted average. Profits should be considered. For aggressive strategies, this can be a short signal.
cross_below -- Event-Based
What it does: Fires once, at the exact candle where VWAP Dev transitions from above the threshold to below it. The previous candle had VWAP Dev >= the target, and the current candle has VWAP Dev < the target.
[[actions.triggers]]
indicator = "vwap_dev_20"
operator = "cross_below"
target = "-2.0"
timeframe = "1h"
Typical use: Detect the moment price enters extreme discount territory. This captures the exact candle where the deviation becomes statistically significant -- useful for precision entries that fire only once at the critical moment.
cross_above -- Event-Based
What it does: Fires once, at the exact candle where VWAP Dev transitions from below the threshold to above it. The previous candle had VWAP Dev <= the target, and the current candle has VWAP Dev > the target.
[[actions.triggers]]
indicator = "vwap_dev_20"
operator = "cross_above"
target = "2.0"
timeframe = "1h"
Typical use: Detect the moment price enters extreme premium territory. Useful as an exit trigger -- the exact candle where the premium becomes statistically overextended.
= (Equal) -- Not Recommended for VWAP Dev
Why: VWAP Dev produces floating-point values that are rarely exactly equal to any specific number. Use < or > instead.
- Use
<for mean-reversion buys -- price is at a statistically significant discount to VWAP. This is the most common VWAP Dev operator. - Use
>for exit signals or profit-taking -- price is at a statistically significant premium. - Use
cross_below/cross_aboveto detect the exact moment price enters an extreme deviation zone.
TOML Examples
Extreme VWAP Discount
Buy when price is more than 2 standard deviations below VWAP. This is a statistically rare event that offers a high-probability bounce. The max_count prevents repeated entries while price remains deeply discounted.
[[actions]]
type = "open_long"
amount = "100 USDC"
[[actions.triggers]]
indicator = "vwap_dev_20"
operator = "<"
target = "-2.0"
timeframe = "1h"
max_count = 2
VWAP Premium Exit
Take profits when price is extended more than 1.5 standard deviations above VWAP. The premium is significant enough that mean reversion is likely.
[[actions]]
type = "sell"
amount = "100%"
[[actions.triggers]]
indicator = "vwap_dev_20"
operator = ">"
target = "1.5"
timeframe = "1h"
max_count = 1
VWAP Dev Combined with VWAP Level
Use both raw VWAP (the level) and VWAP Dev (the significance). Price must be below VWAP AND the deviation must be statistically meaningful. This ensures you are not just buying a trivial dip below VWAP but a significant one.
[[actions]]
type = "open_long"
amount = "100 USDC"
[[actions.triggers]]
indicator = "price"
operator = "<"
target = "vwap"
timeframe = "1h"
[[actions.triggers]]
indicator = "vwap_dev_20"
operator = "<"
target = "-1.5"
timeframe = "1h"
[[actions.triggers]]
indicator = "sma_50"
operator = ">"
target = "sma_200"
timeframe = "1d"
VWAP Dev and RSI Confluence
Combine VWAP Dev with RSI for double confirmation. When both statistical deviation from VWAP AND momentum oscillator agree that price is oversold, the setup has strong confluence.
[[actions]]
type = "open_long"
amount = "100 USDC"
[[actions.triggers]]
indicator = "vwap_dev_20"
operator = "<"
target = "-2.0"
timeframe = "1h"
[[actions.triggers]]
indicator = "rsi_14"
operator = "<"
target = "30"
timeframe = "1h"
[[actions.triggers]]
indicator = "obv"
operator = ">"
target = "obv_sma_20"
timeframe = "1h"
Tips
Unlike raw VWAP (which is denominated in the asset's price currency), VWAP Dev is standardized in standard deviations. A reading of -2.0 means the same thing for BTC, ETH, SOL, or any asset: price is 2 standard deviations below VWAP. This makes it easy to apply the same threshold logic across your entire portfolio without recalibrating per asset.
Raw VWAP gives you the price level -- where institutional fair value sits. VWAP Dev gives you the statistical significance -- how extreme the current deviation is. Used together, they answer two questions at once: "Is price below fair value?" (VWAP) and "Is this discount large enough to matter?" (VWAP Dev). The combination is far more powerful than either alone.
Knowing that BTC is "$500 below VWAP" is not actionable -- you need context. Is $500 a big move or a small one? VWAP Dev normalizes this by telling you "price is 2.1 standard deviations below VWAP." Now you know it is statistically significant regardless of the dollar amount. This normalization is what makes VWAP Dev valuable for systematic trading.
VWAP Dev identifies statistically extreme deviations, not guaranteed reversals. In a strong trend, VWAP Dev can stay at -3.0 for extended periods as VWAP lags behind a rapidly falling price. Always pair VWAP Dev with trend filters (SMA crossovers) and risk management (stop-losses, max_count). A -2.0 reading during a confirmed downtrend may just be the beginning of a larger selloff.
Skew -- Rolling Skewness
Contents
Overview
Rolling Skewness measures the asymmetry of the return distribution over a rolling window. It is computed on log returns (the natural logarithm of price ratios between consecutive candles). Skewness answers a fundamental question: is the market more prone to sudden crashes or sudden rallies?
A symmetric distribution (skewness = 0) means upside moves and downside moves are roughly mirror images of each other. But financial markets are rarely symmetric. Skewness quantifies the direction of that asymmetry:
- Negative skew means the return distribution has a long left tail. Most returns are clustered slightly positive, but occasional large drops drag the tail to the left. The market is prone to sudden crashes -- "left-tail events." This is the classic risk profile before major crypto selloffs.
- Positive skew means the return distribution has a long right tail. Most returns are clustered slightly negative or flat, but occasional large rallies push the tail to the right. Upside surprises are more likely than downside surprises.
- Zero skew means the distribution is roughly symmetric. Neither tail is dominant.
The key insight: skewness tells you WHERE the risk is hiding. In a negatively skewed market, the average return may look fine, but the risk of a sudden crash is elevated. For contrarian strategies, negative skew combined with oversold conditions creates high-probability bounce setups -- the market has already experienced panic, and the left tail has been "spent." For trend-following strategies, positive skew confirms that upside momentum has room to run.
Format
skew_{period}
The period defines the rolling lookback window -- how many candles of log returns are included in the skewness calculation.
| Example | Period | Use Case |
|---|---|---|
skew_60 | 60 | Standard -- captures distribution shape over a meaningful window without excessive smoothing |
skew_100 | 100 | Slower -- more stable reading, better for regime identification |
skew_30 | 30 | Faster -- reacts quicker to distribution shifts, noisier |
Period range: 20 to 500.
Value range: Typically -3.0 to +3.0. Values near 0 indicate a symmetric distribution. Values beyond +/-1.0 indicate significant asymmetry. Extreme values beyond +/-2.0 are rare.
Understanding Skewness Values
Skewness values are standardized and universal -- a reading of -1.5 means the same degree of left-tail asymmetry regardless of the asset or timeframe.
| Skewness Range | Zone | Interpretation |
|---|---|---|
| Below -1.0 | Heavily left-skewed | Panic mode. The return distribution has a pronounced left tail -- large drops have dominated. The market is crash-prone. For contrarian traders: if combined with oversold momentum, the crash may be exhausting itself. |
| -1.0 to -0.3 | Moderately negative | Returns skew to the downside. Downside risk is elevated but not extreme. Caution is warranted for new long entries without confirmation. |
| -0.3 to +0.3 | Roughly symmetric | No significant asymmetry. The distribution of returns is balanced. Neither tail dominates. Neutral reading. |
| +0.3 to +1.0 | Moderately positive | Returns skew to the upside. Upside surprises are more likely than downside crashes. Favorable environment for trend-following longs. |
| Above +1.0 | Heavily right-skewed | Strong upside bias. The return distribution has a pronounced right tail -- large rallies have been occurring. Momentum is heavily bullish. For contrarian traders: the upside may be overextended. |
Skewness is a lagging measure -- it describes what the distribution of returns has looked like over the past N candles, not what it will look like in the future. However, skewness regimes tend to persist for meaningful periods, making it a useful regime filter. A market that has been negatively skewed is statistically more likely to experience further left-tail events until the regime shifts.
Understanding Operators with Skewness
Each operator behaves differently with skewness. Because skewness is a distribution shape indicator, it is most powerful as a regime filter combined with directional triggers.
< (Less Than) -- State-Based
What it does: The trigger is true on every candle where skewness is below the threshold. This detects periods when the return distribution is negatively skewed -- crash risk is elevated or a crash has recently occurred.
On the chart: Recent returns have been dominated by sharp drops. The left tail of the distribution is elongated. This trigger stays active for as long as the skewness reading remains below the threshold.
[[actions.triggers]]
indicator = "skew_60"
operator = "<"
target = "-1.0"
timeframe = "1h"
Typical use: Contrarian panic-buying. When skewness is deeply negative, the market has been experiencing sharp drops. Combined with oversold RSI, this identifies washout moments where selling pressure is exhausted. Also used as a risk filter to avoid entries during crash-prone regimes.
> (Greater Than) -- State-Based
What it does: The trigger is true on every candle where skewness is above the threshold. This detects periods when the return distribution is positively skewed -- upside surprises are more frequent.
On the chart: Recent returns have included sharp rallies. The right tail of the distribution is elongated. Momentum favors the upside.
[[actions.triggers]]
indicator = "skew_60"
operator = ">"
target = "0.5"
timeframe = "1h"
Typical use: Trend confirmation filter. Positive skewness confirms that the market's return distribution favors upside moves. Combine with trend-following entries (EMA cross, price above SMA) for higher-conviction longs.
cross_below -- Event-Based
What it does: Fires once, at the exact candle where skewness transitions from above the threshold to below it. The previous candle had skewness >= the target, and the current candle has skewness < the target.
[[actions.triggers]]
indicator = "skew_60"
operator = "cross_below"
target = "-1.0"
timeframe = "1h"
Typical use: Detect the moment the market enters a crash regime. Skewness has just shifted to heavily negative -- the distribution has tilted toward left-tail events. This can be an exit signal to protect existing positions.
cross_above -- Event-Based
What it does: Fires once, at the exact candle where skewness transitions from below the threshold to above it. The previous candle had skewness <= the target, and the current candle has skewness > the target.
[[actions.triggers]]
indicator = "skew_60"
operator = "cross_above"
target = "0"
timeframe = "1h"
Typical use: Detect the moment the market exits a negative skew regime. Skewness returning to zero or positive means the distribution is normalizing -- the crash regime may be ending. This can signal the "all clear" to resume normal entries.
= (Equal) -- Not Recommended for Skewness
Why: Skewness produces floating-point values that are rarely exactly equal to any specific number. Use < or > instead.
- Use
<to detect negative skew regimes -- crash-prone or post-crash environments. The most common skewness operator. - Use
>to confirm positive skew -- upside momentum in the return distribution. - Use
cross_below/cross_aboveto detect regime transitions -- the exact moment the distribution shifts.
TOML Examples
Panic Buyer: Negative Skew + RSI Oversold
The contrarian play: when skewness is deeply negative (the market has been crashing) AND RSI confirms oversold conditions, buy the panic. The logic: left-tail events have already occurred, selling pressure is likely exhausted, and a mean-reversion bounce is probable.
[[actions]]
type = "open_long"
amount = "100 USDC"
[[actions.triggers]]
indicator = "skew_60"
operator = "<"
target = "-1.0"
timeframe = "1h"
[[actions.triggers]]
indicator = "rsi_14"
operator = "<"
target = "25"
timeframe = "1h"
max_count = 2
Ride the Positive Skew Upside
When skewness is positive (upside surprises dominate) and the trend is confirmed by EMA, enter long. The return distribution itself confirms that momentum favors buyers.
[[actions]]
type = "open_long"
amount = "100 USDC"
[[actions.triggers]]
indicator = "skew_100"
operator = ">"
target = "0.5"
timeframe = "1h"
[[actions.triggers]]
indicator = "ema_20"
operator = ">"
target = "ema_50"
timeframe = "1h"
[[actions.triggers]]
indicator = "rsi_14"
operator = "<"
target = "60"
timeframe = "1h"
Exit on Extreme Negative Skew Shift
Protect existing positions when skewness suddenly plunges below -1.5. This signals a regime shift toward crash-prone conditions -- the distribution is becoming dangerously asymmetric.
[[actions]]
type = "sell"
amount = "100%"
[[actions.triggers]]
indicator = "skew_60"
operator = "cross_below"
target = "-1.5"
timeframe = "1h"
Skewness Combined with Kurtosis
The full distribution picture: buy when skewness is negative (crash has happened) but kurtosis is low (the market is not producing extreme moves anymore -- the volatility storm has passed). This ensures you are buying after the crash, not during it.
[[actions]]
type = "open_long"
amount = "100 USDC"
[[actions.triggers]]
indicator = "skew_60"
operator = "<"
target = "-0.8"
timeframe = "1h"
[[actions.triggers]]
indicator = "kurt_60"
operator = "<"
target = "2.0"
timeframe = "1h"
[[actions.triggers]]
indicator = "rsi_14"
operator = "cross_above"
target = "30"
timeframe = "1h"
Tips
A heavily negative skewness reading tells you that the recent return distribution is dominated by left-tail events -- large drops have been happening. This does not guarantee another crash is imminent. It means the environment is crash-prone. For contrarian traders, this is the setup: when combined with oversold indicators, negative skew identifies moments where the crash has already happened and a bounce is probable.
Skewness tells you which direction the tail risk is. Kurtosis tells you how fat the tails are. Together, they describe the complete shape of the return distribution. Negative skew + high kurtosis = active crash in progress (large, frequent extreme moves to the downside). Negative skew + low kurtosis = crash has exhausted itself (the skew persists in the data but extreme moves have stopped). The second scenario is the higher-probability bounce setup.
Short-period skewness (20-30 candles) is noisy and can flip rapidly between positive and negative. For regime identification, longer periods (60-100 candles) produce more stable readings that better capture the underlying distribution shape. Reserve short periods for lower timeframes (1m, 5m) where you need faster reaction. For hourly and daily charts, 60-100 periods are recommended.
Skewness describes what the return distribution looked like over the past N candles. It does not predict what will happen next. However, distribution regimes tend to be persistent -- a market that has been negatively skewed often remains so for a meaningful period. Use skewness as a regime filter to set context, then rely on real-time indicators (RSI, price crossovers) for precise timing.
Kurt -- Rolling Kurtosis
Contents
Overview
Rolling Kurtosis measures how fat the tails of the return distribution are over a rolling window. It is computed on log returns using excess kurtosis (kurtosis relative to the normal distribution). Kurtosis answers a critical risk question: is the market producing more extreme moves than expected?
The formula computes the fourth moment of the return distribution, normalized by its variance, minus 3:
Kurtosis = E[(r - mean)^4] / std^4 - 3
The subtraction of 3 makes the result relative to the normal distribution (which has a kurtosis of 3). This means a reading of 0 indicates the tails match what you would expect from a normal distribution. Positive values mean the tails are fatter -- extreme moves are happening more often than a bell curve would predict.
- High kurtosis (fat tails) means the market is producing extreme moves -- both up and down -- more frequently than normal. This is the domain of gap opens, flash crashes, and "impossible" events. Stop-losses get blown through because price jumps past them.
- Low kurtosis (thin tails) means the market is behaving predictably. Returns cluster near the mean with few outliers. This is a safe, stable environment where systematic strategies perform well.
- Zero kurtosis means the tails match the normal distribution exactly. This is the theoretical baseline.
The key insight: kurtosis is a risk indicator. It does not tell you which direction the market will move -- it tells you how extreme the moves are likely to be. High kurtosis environments are dangerous because they produce the outsized moves that destroy positions. Low kurtosis environments are where systematic strategies thrive because price behavior is predictable and well-behaved.
Format
kurt_{period}
The period defines the rolling lookback window -- how many candles of log returns are included in the kurtosis calculation.
| Example | Period | Use Case |
|---|---|---|
kurt_60 | 60 | Standard -- captures tail behavior over a meaningful window |
kurt_100 | 100 | Slower -- more stable regime identification, filters out transient spikes |
kurt_30 | 30 | Faster -- reacts quicker to changing tail behavior, noisier |
Period range: 20 to 500.
Value range: Typically -2.0 to +10.0. 0 = normal distribution tails. Positive = fat tails (more extremes than normal). Negative = thin tails (fewer extremes than normal). Values above 4 indicate a highly volatile, tail-heavy environment.
Understanding Kurtosis Values
Kurtosis values are standardized (excess kurtosis relative to the normal distribution), making them universal across assets and timeframes.
| Kurtosis Range | Zone | Interpretation |
|---|---|---|
| Below 0 | Thin tails | Fewer extreme moves than a normal distribution. The market is highly predictable. Ideal environment for systematic strategies -- returns are well-behaved. |
| 0 to 2 | Near-normal | Tail behavior is close to what a normal distribution would produce. Safe for most strategies. Occasional outliers occur but at expected frequency. |
| 2 to 4 | Moderately fat tails | Extreme moves are happening more often than expected. The market is producing occasional surprises. Be cautious with tight stops and leveraged positions. |
| Above 4 | Very fat tails | Danger zone. Extreme moves are frequent and large. This is when "impossible" events occur -- gap moves, flash crashes, violent whipsaws. Risk management is critical. Reduce position size or avoid new entries entirely. |
Crypto markets tend to have higher baseline kurtosis than traditional markets because of their 24/7 nature, thin order books, and susceptibility to news-driven events. A kurtosis of 2-3 is relatively common for crypto on hourly timeframes. Calibrate your thresholds through backtesting on your specific pair.
Understanding Operators with Kurtosis
Each operator behaves differently with kurtosis. Because kurtosis is a risk/environment indicator, it is almost always used as a filter to gate entries and exits, not as a standalone signal.
< (Less Than) -- State-Based
What it does: The trigger is true on every candle where kurtosis is below the threshold. This detects periods when the return distribution has thin or normal tails -- a safe, predictable trading environment.
On the chart: Returns are well-behaved. There are no extreme outliers in the recent lookback window. Price moves are consistent and predictable.
[[actions.triggers]]
indicator = "kurt_60"
operator = "<"
target = "2.0"
timeframe = "1h"
Typical use: Safety filter for entries. Only enter new positions when kurtosis is low -- the environment is predictable and stop-losses are likely to function as intended. This protects against opening positions right before extreme events.
> (Greater Than) -- State-Based
What it does: The trigger is true on every candle where kurtosis is above the threshold. This detects periods when the return distribution has fat tails -- extreme moves are happening more often than expected.
On the chart: Price has been making sharp, unexpected moves. The recent return history includes large outliers -- spikes, crashes, or violent reversals.
[[actions.triggers]]
indicator = "kurt_60"
operator = ">"
target = "4.0"
timeframe = "1h"
Typical use: Risk management exit. When kurtosis spikes above 4, the market is in a dangerous state. Existing positions may need to be closed or reduced. Can also be used as a negative filter -- "do NOT enter when kurtosis > 4."
cross_below -- Event-Based
What it does: Fires once, at the exact candle where kurtosis transitions from above the threshold to below it. The previous candle had kurtosis >= the target, and the current candle has kurtosis < the target.
[[actions.triggers]]
indicator = "kurt_60"
operator = "cross_below"
target = "2.0"
timeframe = "1h"
Typical use: Detect the moment the market transitions from a fat-tail regime to a normal regime. The volatility storm has passed. This can signal that it is safe to resume systematic trading.
cross_above -- Event-Based
What it does: Fires once, at the exact candle where kurtosis transitions from below the threshold to above it. The previous candle had kurtosis <= the target, and the current candle has kurtosis > the target.
[[actions.triggers]]
indicator = "kurt_60"
operator = "cross_above"
target = "4.0"
timeframe = "1h"
Typical use: Detect the moment the market enters a fat-tail regime. Kurtosis has just spiked -- extreme moves have started. This is an early warning signal to tighten stops, reduce exposure, or exit positions entirely.
= (Equal) -- Not Recommended for Kurtosis
Why: Kurtosis produces floating-point values that are rarely exactly equal to any specific number. Use < or > instead.
- Use
<to identify safe trading environments -- low kurtosis means predictable markets. The most common kurtosis operator. - Use
>to detect dangerous environments -- high kurtosis means extreme moves are likely. Use for exits or as a negative filter. - Use
cross_below/cross_aboveto detect the exact moment a risk regime changes.
TOML Examples
Low Kurtosis Safe Entry
Enter long positions only when the market is in a predictable, low-kurtosis environment. Combined with a bullish trend filter, this ensures you are trading in calm conditions where systematic strategies perform best.
[[actions]]
type = "open_long"
amount = "100 USDC"
[[actions.triggers]]
indicator = "kurt_60"
operator = "<"
target = "2.0"
timeframe = "1h"
[[actions.triggers]]
indicator = "ema_20"
operator = ">"
target = "ema_50"
timeframe = "1h"
[[actions.triggers]]
indicator = "rsi_14"
operator = "<"
target = "40"
timeframe = "1h"
High Kurtosis Exit
Exit existing positions when kurtosis spikes above 4. The market is producing extreme moves and the risk of a catastrophic loss increases dramatically. This is a defensive risk management action.
[[actions]]
type = "sell"
amount = "100%"
[[actions.triggers]]
indicator = "kurt_60"
operator = "cross_above"
target = "4.0"
timeframe = "1h"
Full Distribution: Kurtosis + Skewness
The complete distribution picture. Buy when: (1) skewness is negative (crash has occurred), (2) kurtosis is low (extreme moves have stopped -- the storm has passed), and (3) RSI confirms recovery. This is the highest-conviction contrarian setup.
[[actions]]
type = "open_long"
amount = "100 USDC"
[[actions.triggers]]
indicator = "skew_60"
operator = "<"
target = "-0.8"
timeframe = "1h"
[[actions.triggers]]
indicator = "kurt_60"
operator = "<"
target = "2.0"
timeframe = "1h"
[[actions.triggers]]
indicator = "rsi_14"
operator = "cross_above"
target = "30"
timeframe = "1h"
Kurtosis Volatility Regime Filter
Use kurtosis as a volatility regime gate. Only enter DCA positions when the market is calm (low kurtosis) and price is at a discount to VWAP. This avoids accumulating during chaotic markets where prices can gap unpredictably.
[[actions]]
type = "open_long"
amount = "50 USDC"
[[actions.triggers]]
indicator = "kurt_100"
operator = "<"
target = "2.5"
timeframe = "4h"
[[actions.triggers]]
indicator = "price"
operator = "<"
target = "vwap"
timeframe = "4h"
[[actions.triggers]]
indicator = "rsi_14"
operator = "<"
target = "45"
timeframe = "4h"
max_count = 5
Tips
Kurtosis does not tell you which direction to trade -- it tells you whether the market is safe to trade at all. Low kurtosis means the market is well-behaved and your stop-losses, position sizes, and strategy assumptions are likely to hold. High kurtosis means the market is producing moves that violate normal assumptions. Use kurtosis to decide whether to trade, then use directional indicators (RSI, EMA, MACD) to decide how to trade.
Systematic trading strategies are typically developed and backtested under normal market conditions. When kurtosis is low, the market matches those conditions -- your strategies are operating within their design parameters. When kurtosis is high, the market has shifted to a regime your strategy was not designed for. Using kurtosis as a gate filter ensures your strategy only runs in the environment it was built for.
Kurtosis tells you how fat the tails are. Skewness tells you which direction the tail risk is. Together: high kurtosis + negative skew = active crash in progress (extreme downside moves). High kurtosis + positive skew = explosive rally with blow-off-top risk. Low kurtosis + negative skew = post-crash calm, high-probability bounce setup. The combination of both gives you the complete distribution shape.
When kurtosis exceeds 4, the market is in "fat tail" territory. This means: stop-losses may not execute at your target price (gaps and slippage), position sizing models underestimate risk, and "impossible" events become possible. During these regimes, reduce position sizes, widen stop-losses, or step aside entirely. The goal is capital preservation. You can always re-enter when kurtosis drops back to normal levels.
Autocorrelation -- Return Autocorrelation
Contents
- Format
- Understanding Autocorrelation Values
- Understanding Operators with Autocorrelation
- TOML Examples
- Tips
Overview
Autocorrelation measures the correlation of an asset's returns with their own lagged values over a rolling 100-candle window. At lag 1, it answers the question: "does this candle's return predict the next candle's return?" At lag 5, it asks: "does this candle's return predict the return 5 candles from now?"
The calculation is a standard Pearson correlation between two series: the return series returns[t] and its lagged copy returns[t - lag], computed over the most recent 100 candles. The result is a single number between -1 and +1, updated every candle as the rolling window advances.
This is the momentum validator -- the indicator that tells you whether momentum strategies have any edge in the current market. Before running any trend-following or momentum strategy, autocorrelation answers the fundamental question: is there exploitable serial dependence in returns, or is the market a random walk? Positive autocorrelation means today's direction predicts tomorrow's -- momentum strategies will work. Negative autocorrelation means today's direction predicts tomorrow will reverse -- mean reversion strategies will work. Near-zero autocorrelation means neither has an edge -- the market is noise.
Format
autocorr_{lag}
The parameter is lag, not period. Lag defines how many steps back in the return series the correlation is computed against. The rolling window for the correlation calculation is always a fixed 100 candles internally.
| Example | Lag | Use Case |
|---|---|---|
autocorr_1 | 1 | One-step momentum -- the primary signal. Does this candle predict the next? |
autocorr_2 | 2 | Two-step -- captures slightly longer persistence patterns |
autocorr_5 | 5 | Medium-horizon -- momentum at the 5-candle scale |
autocorr_10 | 10 | Longer-horizon -- structural momentum that persists across many candles |
Lag range: 1 to 50. Recommended: 1, 2, 5, 10.
Value range: -1 to +1 (Pearson correlation coefficient).
Understanding Autocorrelation Values
| Autocorrelation Range | Interpretation |
|---|---|
| Below -0.2 | Strong mean reversion -- today's direction strongly predicts tomorrow will reverse. Mean-reversion strategies have a significant edge. Statistically significant. |
| -0.2 to -0.1 | Weak mean reversion -- some tendency to reverse, but the signal is marginal. Momentum strategies should be avoided. |
| -0.1 to 0.1 | Random walk zone -- no exploitable serial dependence. Neither momentum nor mean-reversion strategies have a reliable edge. This is noise, not signal. |
| 0.1 to 0.2 | Weak momentum -- some tendency to persist, but the signal is marginal. Trend-following can work but with reduced confidence. |
| Above 0.2 | Strong momentum -- today's direction strongly predicts tomorrow will continue. Trend-following and momentum strategies have a significant edge. Statistically significant. |
Statistical significance for a 100-candle window is |autocorrelation| > 2/sqrt(100) = 0.2. Values between -0.1 and 0.1 are almost certainly noise. Values between 0.1 and 0.2 (or -0.1 and -0.2) are suggestive but not statistically significant -- use them with caution and combine with other confirming indicators.
Understanding Operators with Autocorrelation
Each operator behaves differently with autocorrelation. Because autocorrelation is a regime filter (it describes the market's current statistical structure, not trading direction), it is almost always used in combination with directional triggers.
> (Greater Than) -- State-Based
What it does: The trigger is true on every candle where autocorrelation is above the threshold.
On the chart: The market is exhibiting momentum behavior. Returns are positively correlated with their lagged values -- moves tend to continue. This trigger stays active for as long as the momentum regime persists.
[[actions.triggers]]
indicator = "autocorr_1"
operator = ">"
target = "0.1"
timeframe = "1d"
Typical use: "Only run momentum strategies when autocorrelation confirms momentum is real." This is the primary use case -- gate your trend-following entries behind an autocorrelation check so you do not trade momentum in a random or mean-reverting market.
< (Less Than) -- State-Based
What it does: The trigger is true on every candle where autocorrelation is below the threshold.
On the chart: The market is exhibiting mean-reverting behavior. Returns are negatively correlated with their lagged values -- moves tend to reverse. This trigger stays active for as long as the mean-reversion regime persists.
[[actions.triggers]]
indicator = "autocorr_1"
operator = "<"
target = "-0.1"
timeframe = "1d"
Typical use: "Only run mean-reversion strategies when autocorrelation confirms reversion is real." Use this to gate fade-the-move entries. When autocorrelation is negative, buying dips and selling rips has a statistical edge.
cross_above -- Event-Based
What it does: Fires once, at the exact candle where autocorrelation transitions from below the threshold to above it. The previous candle had autocorrelation <= the target, and the current candle has autocorrelation > the target.
[[actions.triggers]]
indicator = "autocorr_1"
operator = "cross_above"
target = "0.1"
timeframe = "1d"
Typical use: Detect the moment the market shifts into a momentum regime. The market was random or mean-reverting and has just started exhibiting return persistence. This signals the beginning of a trend-friendly environment -- a good time to activate momentum strategies.
cross_below -- Event-Based
What it does: Fires once, at the exact candle where autocorrelation transitions from above the threshold to below it. The previous candle had autocorrelation >= the target, and the current candle has autocorrelation < the target.
[[actions.triggers]]
indicator = "autocorr_1"
operator = "cross_below"
target = "0"
timeframe = "1d"
Typical use: Detect the moment the market exits a momentum regime. Autocorrelation was positive (trending) and has dropped to zero or negative -- momentum is dying. This is an exit signal for trend-following positions, warning that the directional persistence that justified your trade is gone.
= (Equal) -- Not Recommended for Autocorrelation
Why: Autocorrelation produces floating-point values calculated to many decimal places. Exact equality will almost never be true. Use > or < instead.
- Use
>to validate momentum strategies -- "only trade trends when autocorrelation confirms persistence." This is the most common operator. - Use
<to validate mean-reversion strategies -- "only fade moves when autocorrelation confirms reversion." - Use
cross_above/cross_belowto detect regime transitions -- the exact moment the market shifts between momentum and mean-reversion.
TOML Examples
Momentum Validated Entry
Only enter a momentum trade when autocorrelation confirms that returns are persisting AND ROC shows positive momentum. This prevents trading momentum in random-walk markets where trend strategies bleed to death from noise.
[[actions]]
type = "open_long"
amount = "100 USDC"
[[actions.triggers]]
indicator = "autocorr_1"
operator = ">"
target = "0.1"
timeframe = "1d"
[[actions.triggers]]
indicator = "roc_10"
operator = ">"
target = "3"
timeframe = "1d"
Mean Reversion Validated Dip Buy
Fade a sharp dip only when autocorrelation confirms the market is in a mean-reverting regime. When autocorrelation is negative, oversold conditions are more likely to reverse rather than continue lower.
[[actions]]
type = "open_long"
amount = "100 USDC"
[[actions.triggers]]
indicator = "autocorr_1"
operator = "<"
target = "-0.1"
timeframe = "1d"
[[actions.triggers]]
indicator = "rsi_14"
operator = "<"
target = "30"
timeframe = "4h"
Exit on Regime Change
Exit a trending position when autocorrelation drops below -0.05, signaling that momentum is ending and the market may be shifting to mean-reversion. This exits before a full reversal rather than waiting for price-based stop losses.
[[actions]]
type = "sell"
amount = "100%"
[[actions.triggers]]
indicator = "autocorr_1"
operator = "cross_below"
target = "-0.05"
timeframe = "1d"
Multi-Lag Momentum Confirmation
Require positive autocorrelation at both lag 1 and lag 5. When momentum is present at multiple horizons, the trend is structurally stronger and more likely to persist. A single-lag signal can be noise; multi-lag agreement is conviction.
[[actions]]
type = "open_long"
amount = "100 USDC"
[[actions.triggers]]
indicator = "autocorr_1"
operator = ">"
target = "0.1"
timeframe = "1d"
[[actions.triggers]]
indicator = "autocorr_5"
operator = ">"
target = "0.1"
timeframe = "1d"
[[actions.triggers]]
indicator = "roc_10"
operator = ">"
target = "2"
timeframe = "1d"
Combined with Hurst for Double Confirmation
Use Hurst exponent for long-term regime classification and autocorrelation for short-term persistence confirmation. Hurst > 0.55 says the market is structurally trending. Autocorrelation > 0.1 says returns are currently persisting. Both together give the highest-confidence momentum signal.
[[actions]]
type = "open_long"
amount = "100 USDC"
[[actions.triggers]]
indicator = "hurst"
operator = ">"
target = "0.55"
timeframe = "1d"
[[actions.triggers]]
indicator = "autocorr_1"
operator = ">"
target = "0.1"
timeframe = "1d"
[[actions.triggers]]
indicator = "ema_20"
operator = ">"
target = "ema_50"
timeframe = "1d"
Tips
Before running any momentum, trend-following, or breakout strategy, check autocorrelation first. If autocorr_1 is near zero or negative, your momentum strategy has no statistical edge -- it is trading noise. This single filter can prevent months of slow losses from running trend strategies in a trendless market. Gate every momentum entry behind autocorr_1 > 0.1 as a minimum.
Lag 1 is the most important -- it captures the immediate one-step persistence that most short-term strategies exploit. Lag 5 and lag 10 reveal whether momentum extends to longer horizons. When autocorr_1, autocorr_5, and autocorr_10 are all positive, you have momentum at every scale -- a structurally strong trend. When only lag 1 is positive but lag 5 is near zero, momentum is short-lived and your holding period should be short.
Hurst exponent and autocorrelation are complementary. Hurst measures the long-term memory structure of the price series (is the market fundamentally trending or mean-reverting?). Autocorrelation measures the short-term persistence of returns (are current moves continuing?). Hurst is slow-moving and stable; autocorrelation is responsive and fast. Use Hurst for strategy selection and autocorrelation for entry timing.
Academic research consistently shows that momentum in cryptocurrency markets is SHORT-LIVED compared to equities. For altcoins, momentum effects typically last 1--4 weeks before reversing. BTC has somewhat longer momentum persistence. This means: (1) use daily or 4-hour timeframes for reliable autocorrelation signals, (2) do not assume momentum will last indefinitely, and (3) always have an exit trigger based on autocorrelation declining -- when autocorr_1 drops toward zero, the momentum window is closing.
The statistical significance threshold for a 100-candle window is approximately |autocorrelation| > 0.2. Values between -0.1 and 0.1 are almost certainly random noise -- do not build strategies around them. Values between 0.1 and 0.2 are suggestive but not conclusive. Only values beyond 0.2 give you high confidence that the serial dependence is real and exploitable.
Operators Reference
Every technical trigger in Botmarley compares an indicator to a target using an operator. There are five operators, and choosing the right one is critical to how your strategy behaves.
[[actions.triggers]]
indicator = "rsi_14" # left side
operator = "<" # comparison
target = "30" # right side
Botmarley always reads left-to-right: indicator operator target. The trigger is true when the statement indicator operator target evaluates to true on the current candle.
The Five Operators
> -- Greater Than
Type: State-based
The trigger is true on every candle where the indicator value is greater than the target. It remains true for as long as the condition holds.
# True on every candle where RSI is above 70
[[actions.triggers]]
indicator = "rsi_14"
operator = ">"
target = "70"
If RSI stays above 70 for ten consecutive candles, this trigger is active on all ten. The action associated with this trigger can fire multiple times unless you limit it with max_count.
When to use: Continuous conditions, zone detection, and filters. "Only enter when the macro trend is bullish" (sma_50 > sma_200), "sell when RSI is overbought" (rsi_14 > 70).
< -- Less Than
Type: State-based
The trigger is true on every candle where the indicator value is less than the target. Like >, it fires continuously as long as the condition holds.
# True on every candle where RSI is below 30
[[actions.triggers]]
indicator = "rsi_14"
operator = "<"
target = "30"
If price stays below the lower Bollinger Band for five candles, the trigger fires on all five. Use max_count to limit it to a single firing per position.
When to use: Oversold detection (rsi_14 < 30), price below a band (price < bb_lower), negative momentum (roc_10 < -3).
= -- Equal
Type: State-based
The trigger is true when the indicator value exactly equals the target. This operator is only useful for indicators that output discrete integer values.
# True when TTM Trend is bullish
[[actions.triggers]]
indicator = "ttm_trend"
operator = "="
target = "1"
Indicators like RSI, SMA, EMA, MACD, and Bollinger Bands produce continuous floating-point values (e.g., 29.87, 30.12). A condition like rsi_14 = 30 will almost never be exactly true. Use < or > for these indicators instead.
When to use: TTM Trend (ttm_trend = 1 for bullish, ttm_trend = -1 for bearish). This is effectively the only practical use case for =.
cross_above -- Cross Above
Type: Event-based
The trigger fires once at the exact moment the indicator crosses from below to above the target. It requires two consecutive candles:
- Previous candle: indicator value <= target value
- Current candle: indicator value > target value
# Fires once when SMA(50) crosses above SMA(200) -- the "Golden Cross"
[[actions.triggers]]
indicator = "sma_50"
operator = "cross_above"
target = "sma_200"
timeframe = "1d"
After the crossing, the trigger does not fire again until the indicator drops back below the target and crosses above it again. This makes cross_above ideal for catching turning points.
Use cross_above instead of > when you want to catch the turning point rather than the sustained condition. A golden cross (sma_50 cross_above sma_200) fires once when the trend shifts bullish. Using sma_50 > sma_200 would fire on every candle where SMA(50) happens to be above SMA(200) -- potentially hundreds of candles.
When to use: Moving average crossovers (sma_50 cross_above sma_200), MACD signal crossovers (macd_line cross_above macd_signal), price crossing above a band (price cross_above bb_middle), zero-line crossings (macd_line cross_above 0).
cross_below -- Cross Below
Type: Event-based
The trigger fires once at the exact moment the indicator crosses from above to below the target. It requires two consecutive candles:
- Previous candle: indicator value >= target value
- Current candle: indicator value < target value
# Fires once when SMA(50) crosses below SMA(200) -- the "Death Cross"
[[actions.triggers]]
indicator = "sma_50"
operator = "cross_below"
target = "sma_200"
timeframe = "1d"
After the crossing, the trigger does not fire again until the indicator rises back above the target and crosses below it again.
When to use: Trend reversal exits (sma_50 cross_below sma_200), bearish MACD crossovers (macd_line cross_below macd_signal), price breaking below support (price cross_below bb_lower).
State-Based vs Event-Based
The most important distinction in Botmarley's operator system is between state-based and event-based operators.
| Type | Operators | Fires | Best for |
|---|---|---|---|
| State-based | >, <, = | Every candle where the condition is true | Filters, zones, continuous conditions |
| Event-based | cross_above, cross_below | Once at the moment of crossing | Entry signals, exit signals, trend shifts |
Why it matters
Consider RSI dropping below 30. With <, the trigger fires on every candle where RSI is below 30. If RSI stays oversold for 20 candles, the associated action can fire up to 20 times. With cross_below, the trigger fires once -- on the candle where RSI first drops below 30.
# STATE-BASED: fires on every candle where RSI < 30
[[actions.triggers]]
indicator = "rsi_14"
operator = "<"
target = "30"
# EVENT-BASED: fires once when RSI crosses below 30
[[actions.triggers]]
indicator = "rsi_14"
operator = "cross_below"
target = "30"
Neither is inherently better -- the right choice depends on your strategy:
- Use state-based when the condition is a prerequisite (e.g., "only enter during uptrends" with
sma_50 > sma_200). - Use event-based when you want a precise entry or exit signal (e.g., "enter when MACD crosses above signal").
Targets
The target field in a trigger accepts two types of values:
Numeric Targets
A fixed number, written as a string. Used for absolute thresholds.
target = "30" # RSI threshold
target = "0" # MACD zero-line
target = "-3" # Negative value (ROC below -3%)
target = "50000" # A specific price level
target = "500" # ATR threshold
Indicator Targets
Another indicator name. Both the indicator and target are evaluated on the same candle at the same timeframe. This enables indicator-vs-indicator comparisons.
target = "sma_200" # Compare against 200-period SMA
target = "ema_50" # Compare against 50-period EMA
target = "bb_upper" # Compare against upper Bollinger Band
target = "bb_lower" # Compare against lower Bollinger Band
target = "bb_middle" # Compare against middle Bollinger Band
target = "price" # Compare indicator against current price
target = "obv_sma_20" # Compare OBV against its SMA
target = "macd_signal" # Compare MACD line against signal line
When using an indicator as a target, the order matters. indicator = "sma_50" with target = "sma_200" and operator = ">" means "is SMA(50) greater than SMA(200)?" -- not the other way around. Botmarley always reads left-to-right.
Controlling State-Based Firing with max_count
State-based operators (>, <, =) fire on every candle where the condition holds. This can cause an action to execute many more times than intended. The max_count field limits how many times a trigger can fire per position.
[[actions.triggers]]
indicator = "rsi_14"
operator = "<"
target = "30"
max_count = 1 # Only fire once per position
Without max_count, a rsi_14 < 30 trigger would fire on every candle where RSI is below 30 -- potentially buying repeatedly. With max_count = 1, it fires once and then stays inactive for the remainder of the position.
max_count is especially important for DCA (Dollar Cost Averaging) actions. Each DCA level should typically have max_count = 1 so it only adds to the position once at each level, not repeatedly.
max_count has no effect on event-based operators (cross_above, cross_below) because crossovers inherently fire only once per crossing event.
Quick Reference
| Operator | Type | Fires | Example | Reads as |
|---|---|---|---|---|
> | State | Every matching candle | rsi_14 > 70 | "RSI is above 70" |
< | State | Every matching candle | price < bb_lower | "Price is below the lower band" |
= | State | Every matching candle | ttm_trend = 1 | "TTM Trend is bullish" |
cross_above | Event | Once at crossing | sma_50 cross_above sma_200 | "SMA 50 just crossed above SMA 200" |
cross_below | Event | Once at crossing | macd_line cross_below macd_signal | "MACD just crossed below signal" |
Price Change Trigger
The price_change trigger fires when the market price has moved by a specified percentage over a lookback window. It compares the current candle's close to a candle from N minutes ago. This trigger is global — it does not require an open position.
Use it for momentum entries ("buy after a 5% dip in the last 4 hours") or breakout detection ("price is up 3% over the last day").
For price changes relative to your position's entry price, see Position Price Change instead. price_change watches the market; pos_price_change watches your P&L.
TOML Syntax
[[actions.triggers]]
type = "price_change"
value = "-5%" # Required: ±N% threshold
timeframe = "1h" # Optional: candle size (default: 1m)
lookback = 24 # Optional: number of candles to look back (default: 1)
max_value = "-15%" # Optional: maximum allowed change (range cap)
max_count = 1 # Optional: max fires per position
Parameters
| Parameter | Type | Required | Default | Description |
|---|---|---|---|---|
type | string | Yes | — | Must be "price_change" |
value | string | Yes | — | Percentage threshold in "±N%" format |
timeframe | string | No | "1m" | Candle size for the lookback window |
lookback | integer | No | 1 | Number of timeframe-sized candles to look back |
max_value | string | No | — | Maximum change in "±N%" format (caps the range) |
max_count | integer | No | unlimited | Maximum times this trigger can fire per position |
How It Works
The engine computes a total lookback in 1-minute candles:
total_lookback = lookback × timeframe_in_minutes
timeframe | lookback | Total 1m candles | Real window |
|---|---|---|---|
"1h" | 1 (default) | 60 | 1 hour |
"1h" | 4 | 240 | 4 hours |
"1h" | 24 | 1440 | 24 hours |
"4h" | 6 | 1440 | 24 hours |
"1d" | 1 (default) | 1440 | 1 day |
"5m" | 12 | 60 | 1 hour |
When lookback is omitted, it defaults to 1 — meaning the window equals exactly one timeframe period. This is backwards-compatible with the original behavior.
The engine then calculates:
change_pct = (current_close - close_N_candles_ago) / close_N_candles_ago × 100
- Negative
value(e.g.,"-5%"): trigger fires whenchange_pct <= -5.0 - Positive
value(e.g.,"+3%"): trigger fires whenchange_pct >= 3.0
graph TD
A["Current candle close"] --> C{"Calculate % change<br/>over lookback window"}
B["Close from N candles ago<br/>(N = lookback × timeframe)"] --> C
C --> D{"change meets<br/>threshold?"}
D -->|Yes| E{"Within max_value<br/>range?"}
D -->|No| F["No action"]
E -->|Yes or no max_value| G["Trigger fires"]
E -->|No — too extreme| F
The value Format
The value field uses a "±N%" string format:
| Value | Meaning |
|---|---|
"-5%" | Price dropped at least 5% |
"-2.0%" | Price dropped at least 2% |
"+3%" | Price rose at least 3% |
"+1.5%" | Price rose at least 1.5% |
"3%" | Same as "+3%" (positive assumed) |
The lookback Parameter
The lookback parameter controls how many timeframe-sized candles to look back. Without it, the engine looks back exactly one timeframe period.
# Without lookback: compares to 1 hour ago
type = "price_change"
value = "-5%"
timeframe = "1h"
# With lookback: compares to 24 hours ago (24 × 1h)
type = "price_change"
value = "-5%"
timeframe = "1h"
lookback = 24
This is useful when you want a long lookback window but the timeframe options don't cover it directly. For example, "did the price drop 10% over the last 3 days?" can be expressed as:
type = "price_change"
value = "-10%"
timeframe = "1d"
lookback = 3
The max_value Parameter (Range Capping)
max_value caps how extreme the price change can be for the trigger to fire. It creates a range instead of a simple threshold — useful for avoiding "falling knife" entries.
# Fire when price drops between 5% and 15%
# (skip if it dropped MORE than 15% — that's a falling knife)
type = "price_change"
value = "-5%"
max_value = "-15%"
timeframe = "4h"
How it works:
- For negative thresholds:
valueis the minimum drop,max_valueis the maximum drop - For positive thresholds:
valueis the minimum rise,max_valueis the maximum rise
value | max_value | Fires when change is... |
|---|---|---|
"-5%" | "-15%" | Between -5% and -15% |
"-5%" | (none) | -5% or worse (no cap) |
"+3%" | "+10%" | Between +3% and +10% |
"+3%" | (none) | +3% or better (no cap) |
max_value works with all price-change family triggers: price_change, price_change_from_high, and price_change_from_low.
Valid Timeframes
The timeframe field accepts: 1m, 5m, 15m, 1h, 4h, 1d.
When omitted, the trigger uses 1m — meaning it compares the current close to the close 1 minute ago. This is rarely useful on its own. In practice, you almost always want a larger timeframe.
Examples
Buy After a 5% Dip Over 4 Hours
[[actions]]
type = "open_long"
amount = "100 USDC"
[[actions.triggers]]
type = "price_change"
value = "-5%"
timeframe = "4h"
Buy After a 10% Dip Over 24 Hours (With Lookback)
[[actions]]
type = "open_long"
amount = "200 USDC"
[[actions.triggers]]
type = "price_change"
value = "-10%"
timeframe = "1h"
lookback = 24
Sell After a 3% Rise Over 1 Hour
[[actions]]
type = "sell"
amount = "100%"
[[actions.triggers]]
type = "price_change"
value = "+3%"
timeframe = "1h"
DCA Entry on Hourly Dip (Fire Once)
[[actions]]
type = "buy"
amount = "100 USDC"
average_price = true
[[actions.triggers]]
type = "price_change"
value = "-3%"
timeframe = "1h"
max_count = 1
Buy the Dip — But Not the Crash (Range Cap)
# Enter on 5-15% dips over 4 hours, skip if it's a free fall
[[actions]]
type = "open_long"
amount = "100 USDC"
[[actions.triggers]]
type = "price_change"
value = "-5%"
max_value = "-15%"
timeframe = "4h"
Combine with Technical Indicator
# Buy when price dropped 3% in the last hour AND RSI is oversold
[[actions]]
type = "open_long"
amount = "100 USDC"
[[actions.triggers]]
type = "price_change"
value = "-3%"
timeframe = "1h"
[[actions.triggers]]
indicator = "rsi_14"
operator = "<"
target = "30"
timeframe = "1h"
Tips
price_change is a global market signal. It works whether or not you have an open position. This makes it ideal for entry triggers that watch for market-wide dips or rallies.
Use lookback when standard timeframes don't cover the window you need. timeframe = "1h" with lookback = 24 gives you a 24-hour window calculated from hourly candle boundaries.
max_value is your safety net. In volatile markets, a 5% dip might be normal — but a 30% crash could signal something fundamentally wrong. Use max_value to filter out extreme moves.
Without a timeframe, price_change compares to just 1 minute ago, which is extremely noisy. Always set a timeframe for meaningful signals.
Related Triggers
| Trigger | What It Measures |
|---|---|
| Price Change from High | % drop from the highest price in a lookback window |
| Price Change from Low | % rise from the lowest price in a lookback window |
| Position Price Change | % change from your entry price |
| Trailing Stop | % drop from position's peak price |
| Consecutive Candles | Streaks of red or green candles |
Price Change from High
The price_change_from_high trigger fires when the current price has dropped by a specified percentage from the highest price within a lookback window. It is a global trigger — no open position is required.
Use it to detect dip-from-peak opportunities: "price is down 5% from its high over the last 24 hours."
This trigger measures the drop from a recent high in the market, not from your position's peak. For position-relative peak tracking, see Trailing Stop instead.
TOML Syntax
[[actions.triggers]]
type = "price_change_from_high"
value = "-5%" # Required: drop threshold (always negative)
timeframe = "1h" # Optional: candle size (default: 1m)
lookback = 24 # Optional: number of candles to scan (default: 24)
max_value = "-15%" # Optional: maximum allowed drop (range cap)
max_count = 1 # Optional: max fires per position
Parameters
| Parameter | Type | Required | Default | Description |
|---|---|---|---|---|
type | string | Yes | — | Must be "price_change_from_high" |
value | string | Yes | — | Drop threshold in "-N%" format (always negative) |
timeframe | string | No | "1m" | Candle size for the lookback window |
lookback | integer | No | 24 | Number of timeframe-sized candles to scan |
max_value | string | No | — | Maximum drop in "-N%" format (range cap) |
max_count | integer | No | unlimited | Maximum times this trigger can fire per position |
How It Works
- Compute the lookback window:
total_candles = lookback × timeframe_in_minutes - Find the highest close in that window
- Calculate the drop:
change_pct = (current_close - highest_close) / highest_close × 100 - Fire if
change_pct <= threshold(and withinmax_valuerange if set)
graph TD
A["Scan last N candles<br/>(lookback × timeframe)"] --> B["Find highest close"]
B --> C["Calculate % drop<br/>from high to current"]
C --> D{"Drop meets<br/>threshold?"}
D -->|Yes| E{"Within max_value<br/>range?"}
D -->|No| F["No action"]
E -->|Yes or no max_value| G["Trigger fires"]
E -->|No — too extreme| F
Example Calculation
With timeframe = "1h", lookback = 24, value = "-5%":
- Window: last 24 × 60 = 1440 one-minute candles (24 hours)
- Highest close in window: $50,000
- Current close: $47,000
- Change: ($47,000 - $50,000) / $50,000 × 100 = -6.0%
- -6.0% ≤ -5.0% → trigger fires
The value Format
The value must be negative (you're measuring a drop from a high):
| Value | Meaning |
|---|---|
"-5%" | Price dropped at least 5% from the window's high |
"-2.5%" | Price dropped at least 2.5% from the window's high |
"-10%" | Price dropped at least 10% from the window's high |
Examples
Buy When Price Drops 5% from 24h High
[[actions]]
type = "open_long"
amount = "100 USDC"
[[actions.triggers]]
type = "price_change_from_high"
value = "-5%"
timeframe = "1h"
lookback = 24
Buy the Dip — But Not the Crash
# Enter when price drops 5-15% from the 4h high window
# Skip if the drop exceeds 15% (falling knife protection)
[[actions]]
type = "open_long"
amount = "100 USDC"
[[actions.triggers]]
type = "price_change_from_high"
value = "-5%"
max_value = "-15%"
timeframe = "1h"
lookback = 4
Combine with RSI for Confirmation
[[actions]]
type = "open_long"
amount = "150 USDC"
# Price dropped 3% from 12h high
[[actions.triggers]]
type = "price_change_from_high"
value = "-3%"
timeframe = "1h"
lookback = 12
# AND RSI confirms oversold
[[actions.triggers]]
indicator = "rsi_14"
operator = "<"
target = "35"
timeframe = "1h"
Short-Window Scalping (5m candles, 12-candle window)
[[actions]]
type = "open_long"
amount = "50 USDC"
[[actions.triggers]]
type = "price_change_from_high"
value = "-2%"
timeframe = "5m"
lookback = 12
max_count = 1
Tips
The default lookback of 24 candles works well with timeframe = "1h" — giving you a 24-hour window. Adjust both parameters to fit your trading timeframe.
Use max_value for falling knife protection. If the price dropped 30% from the high, it might be a fundamental breakdown rather than a buying opportunity.
This trigger fires based on candle closes, not intra-candle wicks. The "highest close" is the highest closing price in the window, not the highest wick.
Related Triggers
| Trigger | What It Measures |
|---|---|
| Price Change from Low | % rise from the lowest price in a lookback window |
| Price Change | % change over a fixed lookback period |
| Trailing Stop | % drop from position's peak (requires open position) |
| Position Price Change | % change from your entry price |
Price Change from Low
The price_change_from_low trigger fires when the current price has risen by a specified percentage from the lowest price within a lookback window. It is a global trigger — no open position is required.
Use it to detect recovery-from-bottom signals: "price has bounced 3% off its low over the last 12 hours."
This trigger measures the rise from a recent low in the market, not from your position's entry price. For position-relative tracking, see Position Price Change instead.
TOML Syntax
[[actions.triggers]]
type = "price_change_from_low"
value = "3%" # Required: rise threshold (always positive)
timeframe = "1h" # Optional: candle size (default: 1m)
lookback = 12 # Optional: number of candles to scan (default: 24)
max_value = "15%" # Optional: maximum allowed rise (range cap)
max_count = 1 # Optional: max fires per position
Parameters
| Parameter | Type | Required | Default | Description |
|---|---|---|---|---|
type | string | Yes | — | Must be "price_change_from_low" |
value | string | Yes | — | Rise threshold in "N%" format (always positive) |
timeframe | string | No | "1m" | Candle size for the lookback window |
lookback | integer | No | 24 | Number of timeframe-sized candles to scan |
max_value | string | No | — | Maximum rise in "N%" format (range cap) |
max_count | integer | No | unlimited | Maximum times this trigger can fire per position |
How It Works
- Compute the lookback window:
total_candles = lookback × timeframe_in_minutes - Find the lowest close in that window
- Calculate the rise:
change_pct = (current_close - lowest_close) / lowest_close × 100 - Fire if
change_pct >= threshold(and withinmax_valuerange if set)
graph TD
A["Scan last N candles<br/>(lookback × timeframe)"] --> B["Find lowest close"]
B --> C["Calculate % rise<br/>from low to current"]
C --> D{"Rise meets<br/>threshold?"}
D -->|Yes| E{"Within max_value<br/>range?"}
D -->|No| F["No action"]
E -->|Yes or no max_value| G["Trigger fires"]
E -->|No — too extreme| F
Example Calculation
With timeframe = "1h", lookback = 12, value = "3%":
- Window: last 12 × 60 = 720 one-minute candles (12 hours)
- Lowest close in window: $45,000
- Current close: $46,800
- Change: ($46,800 - $45,000) / $45,000 × 100 = +4.0%
- +4.0% ≥ +3.0% → trigger fires
The value Format
The value must be positive (you're measuring a rise from a low):
| Value | Meaning |
|---|---|
"3%" | Price rose at least 3% from the window's low |
"5%" | Price rose at least 5% from the window's low |
"1.5%" | Price rose at least 1.5% from the window's low |
Examples
Buy After 3% Bounce from 12h Low
[[actions]]
type = "open_long"
amount = "100 USDC"
[[actions.triggers]]
type = "price_change_from_low"
value = "3%"
timeframe = "1h"
lookback = 12
Confirm Reversal — Not a Dead Cat Bounce
# Enter on a 5% bounce, but skip if it bounced more than 20%
# (might be too late / overbought)
[[actions]]
type = "open_long"
amount = "100 USDC"
[[actions.triggers]]
type = "price_change_from_low"
value = "5%"
max_value = "20%"
timeframe = "1h"
lookback = 24
Combine with Volume Confirmation
[[actions]]
type = "open_long"
amount = "150 USDC"
# Price bounced 3% from 6h low
[[actions.triggers]]
type = "price_change_from_low"
value = "3%"
timeframe = "1h"
lookback = 6
# AND volume is above average (confirmation)
[[actions.triggers]]
indicator = "volume_sma_20"
operator = ">"
target = "volume_sma_50"
timeframe = "1h"
Short-Window Recovery (5m candles)
[[actions]]
type = "open_long"
amount = "50 USDC"
[[actions.triggers]]
type = "price_change_from_low"
value = "1.5%"
timeframe = "5m"
lookback = 24
max_count = 1
Tips
price_change_from_low is a momentum confirmation trigger. A price bouncing off a low with strength suggests buying interest. Combine it with volume or RSI triggers for higher confidence entries.
Use max_value to avoid chasing. If the price already bounced 20% from the low, the easy gains may already be captured.
Like all price triggers, this fires based on candle closes, not intra-candle wicks. The "lowest close" is the lowest closing price in the window.
Related Triggers
| Trigger | What It Measures |
|---|---|
| Price Change from High | % drop from the highest price in a lookback window |
| Price Change | % change over a fixed lookback period |
| Position Price Change | % change from your entry price |
| Trailing Take-Profit | Locks in profit as price moves up |
Position Price Change Trigger
The pos_price_change trigger fires based on the price change relative to your open position's average entry price. It only activates when you have an open position. Use it for take-profit and stop-loss logic.
For market-wide price movement (no position required), see Price Change instead. pos_price_change watches your P&L; price_change watches the market.
TOML Syntax
[[actions.triggers]]
type = "pos_price_change"
value = "-2%" # Required: ±N% from entry price
max_count = 1 # Optional: max fires per position
Parameters
| Parameter | Type | Required | Default | Description |
|---|---|---|---|---|
type | string | Yes | — | Must be "pos_price_change" |
value | string | Yes | — | Percentage threshold from entry price in "±N%" format |
max_count | integer | No | unlimited | Maximum times this trigger can fire per position |
pos_price_change does not support the timeframe field. It always compares the current price to the position's entry price, regardless of candle size.
How It Works
The engine calculates the percentage change from the position's average entry price:
change_pct = (current_close - entry_price) / entry_price * 100
- Positive
value(e.g.,"2%"): fires when the position is profitable by at least 2% - Negative
value(e.g.,"-2%"): fires when the position is losing by at least 2%
graph TD
A["Current candle close"] --> C{Calculate % from entry}
B["Position entry price<br/>(average if DCA'd)"] --> C
C --> D{"change meets<br/>threshold?"}
D -->|Yes| E["Trigger fires"]
D -->|No| F["No action"]
Average Price with DCA
When average_price = true is set on buy actions, the entry price is recalculated as a weighted average after each DCA buy. This means the trigger threshold shifts with each additional purchase.
For example, if you enter at $100 and DCA at $96, your average entry becomes ~$98. A pos_price_change of "2%" now fires at ~$99.96 instead of $102.
The value Format
| Value | Meaning |
|---|---|
"2%" | Position is up at least 2% from entry |
"+5%" | Position is up at least 5% from entry |
"-2%" | Position is down at least 2% from entry |
"-4%" | Position is down at least 4% from entry |
Examples
Simple Take-Profit at +2%
[[actions]]
type = "sell"
amount = "100%"
[[actions.triggers]]
type = "pos_price_change"
value = "2%"
Simple Stop-Loss at -5%
[[actions]]
type = "sell"
amount = "100%"
[[actions.triggers]]
type = "pos_price_change"
value = "-5%"
Layered DCA: Buy More on Dips
A classic DCA pattern — buy more as the position drops, each level firing once:
# DCA Level 1: buy more at -2%
[[actions]]
type = "buy"
amount = "100 USDC"
average_price = true
[[actions.triggers]]
type = "pos_price_change"
value = "-2%"
max_count = 1
# DCA Level 2: buy more at -4%
[[actions]]
type = "buy"
amount = "200 USDC"
average_price = true
[[actions.triggers]]
type = "pos_price_change"
value = "-4%"
max_count = 1
# DCA Level 3: buy more at -6%
[[actions]]
type = "buy"
amount = "300 USDC"
average_price = true
[[actions.triggers]]
type = "pos_price_change"
value = "-6%"
max_count = 1
Always use max_count = 1 on DCA levels. Without it, the trigger fires repeatedly as price oscillates around the threshold, causing unintended double-buys.
Full Strategy: Entry + DCA + Take-Profit
[meta]
name = "Position Price DCA"
description = "RSI entry with layered DCA and profit target"
max_open_positions = 5
[[actions]]
type = "open_long"
amount = "100 USDC"
[[actions.triggers]]
indicator = "rsi_14"
operator = "<"
target = "30"
timeframe = "1d"
[[actions]]
type = "buy"
amount = "100 USDC"
average_price = true
[[actions.triggers]]
type = "pos_price_change"
value = "-2%"
max_count = 1
[[actions]]
type = "buy"
amount = "500 USDC"
average_price = true
[[actions.triggers]]
type = "pos_price_change"
value = "-4%"
max_count = 1
[[actions]]
type = "sell"
amount = "100%"
[[actions.triggers]]
type = "pos_price_change"
value = "2%"
Tips
pos_price_change is evaluated per-position in multi-position strategies. If you have max_open_positions = 5, each position independently tracks its own entry price and fires its own DCA/TP/SL triggers.
Remember that DCA changes the average entry price. After buying more at a lower price, your take-profit target shifts closer to the current price. This is by design — it's the whole point of averaging down.
Related Triggers
| Trigger | What It Measures |
|---|---|
| Price Change | Global market price movement (no position needed) |
| Trailing Stop | % drop from position's peak price |
| Trailing Take-Profit | Dynamic TP that follows price up, exits on retrace |
| Time in Position | Duration-based exit |
Trailing Stop Trigger
The trailing_stop trigger fires when the price drops a specified percentage from the highest price reached since the position was opened. It locks in profits during uptrends by selling when momentum reverses.
Unlike a fixed stop-loss (pos_price_change with a negative value), a trailing stop moves up as the price rises. It only looks down from the peak — never up.
TOML Syntax
[[actions.triggers]]
type = "trailing_stop"
value = "-3%" # Required: always negative (drop from peak)
Parameters
| Parameter | Type | Required | Default | Description |
|---|---|---|---|---|
type | string | Yes | — | Must be "trailing_stop" |
value | string | Yes | — | Percentage drop from peak in "-N%" format (always negative) |
max_count | integer | No | unlimited | Maximum times this trigger can fire per position |
trailing_stop does not support the timeframe field. It tracks the peak price across all candles since position entry.
How It Works
- When a position opens, the engine starts tracking the highest close price since entry
- On every candle, if the new close is higher than the tracked peak, the peak is updated
- The engine calculates:
drop_pct = (current_close - peak_price) / peak_price * 100 - When
drop_pct <= threshold(e.g., -3%), the trigger fires
graph TD
A["Track peak price<br/>since position entry"] --> B["New candle close"]
B --> C{"New close ><br/>peak?"}
C -->|Yes| D["Update peak"]
C -->|No| E{"Drop from peak<br/>meets threshold?"}
D --> F["Continue"]
E -->|Yes| G["Trigger fires"]
E -->|No| F
Visual Example
Imagine you enter at $100, the price rises to $110 (new peak), then drops:
| Price | Peak | Drop from Peak | -3% trigger |
|---|---|---|---|
| $100 | $100 | 0% | — |
| $105 | $105 | 0% | — |
| $110 | $110 | 0% | — |
| $108 | $110 | -1.8% | — |
| $107 | $110 | -2.7% | — |
| $106.70 | $110 | -3.0% | Fires |
The trailing stop at -3% would NOT have fired at $106.70 with a fixed stop-loss from entry ($100). The trailing mechanism locks in the gains from the $100 → $110 run.
The value Format
The value must be negative (it represents a drop):
| Value | Meaning |
|---|---|
"-2%" | Sell when price drops 2% from peak |
"-3%" | Sell when price drops 3% from peak |
"-5%" | Sell when price drops 5% from peak |
"-0.5%" | Very tight trailing stop (0.5% from peak) |
Examples
Basic Trailing Stop
[[actions]]
type = "sell"
amount = "100%"
[[actions.triggers]]
type = "trailing_stop"
value = "-4%"
Trailing Stop + DCA Strategy
Combine a trailing stop with DCA levels for a complete loss-prevention system:
[meta]
name = "Trend-Safe Trailing Stop"
description = "BB+RSI entry, DCA on dips, trailing stop locks profits"
max_open_positions = 1
# Entry: Bollinger Band + RSI filter
[[actions]]
type = "open_long"
amount = "100 USDC"
[[actions.triggers]]
indicator = "bb_lower"
operator = ">"
target = "price"
timeframe = "1h"
[[actions.triggers]]
indicator = "rsi_14"
operator = "<"
target = "40"
timeframe = "1d"
# DCA at -5%
[[actions]]
type = "buy"
amount = "100 USDC"
average_price = true
[[actions.triggers]]
type = "pos_price_change"
value = "-5%"
[[actions.triggers]]
indicator = "rsi_14"
operator = "<"
target = "35"
timeframe = "1h"
# Take profit at +3%
[[actions]]
type = "sell"
amount = "100%"
[[actions.triggers]]
type = "pos_price_change"
value = "3%"
# Trailing stop: sell when price drops 4% from peak
[[actions]]
type = "sell"
amount = "100%"
[[actions.triggers]]
type = "trailing_stop"
value = "-4%"
# Time exit: free stuck capital after 7 days
[[actions]]
type = "sell"
amount = "100%"
[[actions.triggers]]
type = "time_in_position"
value = "7d"
Tips
Choose your trailing stop percentage based on the asset's typical volatility. A -2% trailing stop on BTC during a volatile week will trigger constantly. A -5% trailing stop gives more room for normal price swings.
Trailing stops and fixed take-profits (pos_price_change) work well together. The take-profit catches quick gains, while the trailing stop captures extended runs. Whichever fires first wins.
Trailing stops can fire during flash wicks (sudden price drops that recover quickly). In highly volatile markets, consider a wider percentage to avoid premature exits.
Related Triggers
| Trigger | What It Measures |
|---|---|
| Position Price Change | Fixed % from entry price (stop-loss/take-profit) |
| Trailing Take-Profit | More flexible trailing with activation threshold + tolerance |
| Time in Position | Duration-based exit (pairs well with trailing stop) |
Consecutive Candles Trigger
The consecutive_candles trigger fires when a specified number of candles in a row are all the same color (red/bearish or green/bullish). It detects short-term momentum patterns — a streak of red candles often precedes a bounce, while a streak of green candles confirms a breakout.
TOML Syntax
[[actions.triggers]]
type = "consecutive_candles"
value = "3_red" # Required: {count}_{direction}
timeframe = "5m" # Required: candle size for counting
Parameters
| Parameter | Type | Required | Default | Description |
|---|---|---|---|---|
type | string | Yes | — | Must be "consecutive_candles" |
value | string | Yes | — | Pattern: "{count}_{direction}" |
timeframe | string | Yes | — | Candle size for consecutive counting |
max_count | integer | No | unlimited | Maximum times this trigger can fire per position |
The value Format
The value follows the pattern {count}_{direction}:
| Value | Meaning |
|---|---|
"3_red" | 3 consecutive bearish (close < open) candles |
"3_green" | 3 consecutive bullish (close >= open) candles |
"5_red" | 5 consecutive bearish candles |
"5_green" | 5 consecutive bullish candles |
- Red/bearish: candle close < candle open
- Green/bullish: candle close >= candle open
How It Works
The engine groups 1-minute candles into the specified timeframe, then checks if the last N grouped candles are all the same color.
For example, with timeframe = "5m" and value = "3_red":
- Group every 5 consecutive 1-minute candles into one 5-minute candle
- Check the last 3 of these 5-minute candles
- If all 3 have close < open (red), the trigger fires
graph TD
A["Group 1m candles<br/>into timeframe candles"] --> B["Check last N<br/>grouped candles"]
B --> C{"All same<br/>color?"}
C -->|Yes| D["Trigger fires"]
C -->|No| E["No action"]
Valid Timeframes
The timeframe field accepts: 1m, 5m, 15m, 1h, 4h, 1d.
The timeframe determines the candle size used for consecutive counting. "3_red" on "5m" means three consecutive 5-minute red candles (15 minutes of selling). "3_red" on "1h" means three consecutive hourly red candles (3 hours of selling).
Examples
Buy After 3 Consecutive Red 5m Candles
A classic dip-buying pattern — three red candles in a row often precede a bounce:
[[actions]]
type = "open_long"
amount = "100 USDC"
[[actions.triggers]]
type = "consecutive_candles"
value = "3_red"
timeframe = "5m"
Combine with ROC for Sharp Dip Detection
[[actions]]
type = "open_long"
amount = "100 USDC"
[[actions.triggers]]
indicator = "roc_10"
operator = "<"
target = "-3"
timeframe = "5m"
[[actions.triggers]]
type = "consecutive_candles"
value = "3_red"
timeframe = "5m"
Breakout Confirmation with Green Candles
[[actions]]
type = "open_long"
amount = "100 USDC"
[[actions.triggers]]
type = "consecutive_candles"
value = "5_green"
timeframe = "1h"
[[actions.triggers]]
indicator = "sma_50"
operator = ">"
target = "sma_200"
timeframe = "1d"
Tips
Three consecutive red candles on 5-minute or 15-minute timeframes is a common dip-buying signal. It indicates short-term selling pressure that may be about to exhaust.
On higher timeframes (1h, 4h), even 3 consecutive red candles represents a significant trend. Make sure your strategy can handle the drawdown if the streak continues.
Pair consecutive_candles with an RSI or StochRSI confirmation for higher-quality entries. Three red candles alone do not guarantee a bounce — oversold confirmation makes the signal stronger.
Related Triggers
| Trigger | What It Measures |
|---|---|
| Price Change | Global % price movement over time |
| Next Candle | Candle-close scheduling and delay |
Time in Position Trigger
The time_in_position trigger fires when a position has been open for a specified duration. Use it as a safety net to free stuck capital when other exit triggers have not fired.
TOML Syntax
[[actions.triggers]]
type = "time_in_position"
value = "7d" # Required: duration string
Parameters
| Parameter | Type | Required | Default | Description |
|---|---|---|---|---|
type | string | Yes | — | Must be "time_in_position" |
value | string | Yes | — | Duration: "24h", "7d", or minutes as a number |
max_count | integer | No | unlimited | Maximum times this trigger can fire per position |
time_in_position does not support the timeframe field. Duration is absolute, not candle-dependent.
Duration Format
| Value | Duration |
|---|---|
"1h" | 1 hour (60 minutes) |
"24h" | 24 hours |
"7d" | 7 days |
"30d" | 30 days |
"60" | 60 minutes (numeric = minutes) |
The engine converts the duration to minutes internally and checks if the position has been open for at least that many 1-minute candles.
How It Works
- When a position opens, the engine records the entry tick (candle index)
- On every candle, it calculates:
minutes_open = current_tick - entry_tick - When
minutes_open >= duration_in_minutes, the trigger fires
graph TD
A["Position opens<br/>at tick N"] --> B["Each candle:<br/>elapsed = tick - N"]
B --> C{"elapsed >=<br/>duration?"}
C -->|Yes| D["Trigger fires"]
C -->|No| E["Continue waiting"]
E --> B
Examples
Close After 7 Days
A safety exit that frees capital stuck in a position that is not moving:
[[actions]]
type = "sell"
amount = "100%"
[[actions.triggers]]
type = "time_in_position"
value = "7d"
Close After 24 Hours
For shorter-term strategies or scalping:
[[actions]]
type = "sell"
amount = "100%"
[[actions.triggers]]
type = "time_in_position"
value = "24h"
Complete Strategy with Time Exit
Time exits pair well with other exit triggers. The first one to fire wins:
[meta]
name = "Time-Protected DCA"
max_open_positions = 1
# Entry
[[actions]]
type = "open_long"
amount = "100 USDC"
[[actions.triggers]]
indicator = "rsi_14"
operator = "<"
target = "30"
timeframe = "1h"
# Take profit at +3%
[[actions]]
type = "sell"
amount = "100%"
[[actions.triggers]]
type = "pos_price_change"
value = "3%"
# Trailing stop at -4% from peak
[[actions]]
type = "sell"
amount = "100%"
[[actions.triggers]]
type = "trailing_stop"
value = "-4%"
# Time exit: close after 7 days no matter what
[[actions]]
type = "sell"
amount = "100%"
[[actions.triggers]]
type = "time_in_position"
value = "7d"
Tips
A time_in_position exit is your safety net. It prevents capital from being locked in a position that never hits its take-profit or stop-loss. A 7-day time exit is a good default for swing strategies.
In backtesting, time_in_position helps ensure positions close before the end of your data range. Without it, positions open near the end of your backtest data may never close, skewing results.
time_in_position fires regardless of the position's profitability. If your position is up 10% after 7 days, the time exit still sells at 100%. If you want to only force-close losing positions, combine it with a pos_price_change trigger in the same action (AND logic).
Related Triggers
| Trigger | What It Measures |
|---|---|
| Position Price Change | Fixed % from entry price |
| Trailing Stop | % drop from peak price |
| Next Candle | Candle-close scheduling |
Trailing Take-Profit / DCA Trigger
The pos_price_change_follow trigger is a dynamic exit (or entry) that activates when price reaches a threshold from the position entry, then fires when price retraces by a tolerance amount. Use it for trailing take-profits that ride momentum before exiting, or trailing DCA that buys on a bounce after a dip.
TOML Syntax
[[actions.triggers]]
type = "pos_price_change_follow"
value = "3%" # Required: activation threshold from entry
tolerance = "-0.5%" # Required: retrace tolerance to trigger
Parameters
| Parameter | Type | Required | Default | Description |
|---|---|---|---|---|
type | string | Yes | — | Must be "pos_price_change_follow" |
value | string | Yes | — | Activation threshold: "±N%" from entry price |
tolerance | string | Yes | — | Retrace tolerance: how far price must pull back after activation |
max_count | integer | No | unlimited | Maximum times this trigger can fire per position |
pos_price_change_follow does not support the timeframe field. It tracks price relative to the position entry, like pos_price_change.
How It Works
This trigger has two phases:
Phase 1: Activation
The trigger activates when the position's P&L reaches the value threshold:
- Positive
value(e.g.,"3%"): activates when position is up 3% from entry - Negative
value(e.g.,"-10%"): activates when position is down 10% from entry
Phase 2: Retrace and Fire
Once activated, the trigger tracks the extreme price (highest for positive, lowest for negative) and fires when price retraces from that extreme by the tolerance amount:
- Negative
tolerance(e.g.,"-0.5%"): fires when price drops 0.5% from the tracked peak - Positive
tolerance(e.g.,"1%"): fires when price rises 1% from the tracked low
graph TD
A["Position P&L<br/>reaches threshold"] --> B["Phase 1: Activated"]
B --> C["Track extreme price<br/>(highest or lowest)"]
C --> D{"Price retraces<br/>by tolerance?"}
D -->|Yes| E["Trigger fires"]
D -->|No| F["Update extreme<br/>if new high/low"]
F --> D
Trailing Take-Profit Example
With value = "3%" and tolerance = "-0.5%":
- Position opens at $100
- Price rises to $103 → activation (up 3% from entry)
- Price continues to $108 (tracked peak = $108)
- Price drops to $107.46 → that's -0.5% from $108 → trigger fires
The trailing take-profit rode the run from $103 to $108, then exited on a small retrace. A fixed take-profit at 3% would have sold at $103 and missed the extra 5%.
Trailing DCA Example
With value = "-10%" and tolerance = "1%":
- Position opens at $100
- Price drops to $90 → activation (down 10% from entry)
- Price continues dropping to $85 (tracked low = $85)
- Price rises to $85.85 → that's +1% from $85 → trigger fires
Instead of buying at exactly -10%, the trailing DCA waited for the price to show signs of recovery (bouncing 1% from the local bottom) before adding capital.
Examples
Trailing Take-Profit: Sell on Retrace from Profit
[[actions]]
type = "sell"
amount = "100%"
[[actions.triggers]]
type = "pos_price_change_follow"
value = "3%"
tolerance = "-0.5%"
Trailing DCA: Buy on Bounce After Deep Dip
[[actions]]
type = "buy"
amount = "100%"
average_price = true
[[actions.triggers]]
type = "pos_price_change_follow"
value = "-10%"
tolerance = "1%"
Full Strategy: Multi-Signal Entry + Trailing Exit
[meta]
name = "StochRSI Trailing"
description = "StochRSI extreme entry + trailing take-profit exit"
max_open_positions = 1
# Entry: StochRSI deeply oversold
[[actions]]
type = "open_long"
amount = "100 USDC"
[[actions.triggers]]
indicator = "stoch_rsi_14"
operator = "<"
target = "20"
timeframe = "15m"
[[actions.triggers]]
indicator = "rsi_14"
operator = "<"
target = "35"
timeframe = "15m"
# Exit: trailing take-profit
[[actions]]
type = "sell"
amount = "100%"
[[actions.triggers]]
type = "pos_price_change_follow"
value = "3%"
tolerance = "-0.5%"
# DCA: trailing buy after deep dip shows recovery
[[actions]]
type = "buy"
amount = "100%"
average_price = true
[[actions.triggers]]
type = "pos_price_change_follow"
value = "-10%"
tolerance = "1%"
Choosing the Right Parameters
| Use Case | value | tolerance | Behavior |
|---|---|---|---|
| Tight trailing TP | "2%" | "-0.2%" | Quick exit after small gain |
| Wide trailing TP | "5%" | "-1%" | Rides larger runs, accepts bigger retrace |
| DCA on bounce | "-10%" | "1%" | Buys after deep dip shows 1% recovery |
| DCA on slight bounce | "-5%" | "0.5%" | Buys after moderate dip with slight recovery |
Tips
pos_price_change_follow is more sophisticated than a plain trailing_stop. The trailing stop tracks from peak; pos_price_change_follow only activates after a threshold is reached and then has a separate tolerance for exit. This gives you more control over when trailing begins.
For trailing take-profits, use a small negative tolerance (e.g., "-0.5%"). For trailing DCA buys, use a small positive tolerance (e.g., "1%"). The tolerance sign depends on which direction you are watching for a retrace.
If your tolerance is too tight (e.g., "-0.1%"), normal price fluctuations will trigger the exit almost immediately after activation. Give enough room for the price to breathe.
Related Triggers
| Trigger | What It Measures |
|---|---|
| Trailing Stop | Simple trailing from peak (no activation threshold) |
| Position Price Change | Fixed % from entry price |
| Time in Position | Duration-based exit |
Next Candle Trigger
The next_candle trigger fires when a candle closes at the specified timeframe. It introduces a scheduling element — instead of reacting immediately, the action waits for a candle boundary.
Use it for:
- Scheduled accumulation: buy on every 4-hour candle close
- Signal confirmation: wait for the current candle to close before acting on other triggers
- Time-paced execution: space out actions by candle intervals
TOML Syntax
[[actions.triggers]]
type = "next_candle"
timeframe = "4h" # Optional: candle size (default: 1m)
max_count = 5 # Optional: max fires per position
Parameters
| Parameter | Type | Required | Default | Description |
|---|---|---|---|---|
type | string | Yes | — | Must be "next_candle" |
timeframe | string | No | "1m" | Candle size to wait for |
max_count | integer | No | unlimited | Maximum times this trigger can fire per position |
How It Works
The engine evaluates on every 1-minute candle. When the current tick aligns with a candle boundary for the specified timeframe, the trigger fires.
For example, with timeframe = "4h":
- The trigger fires on every candle that falls on a 4-hour boundary (every 240th 1-minute candle)
- Between boundaries, the trigger evaluates to
false
graph TD
A["Every 1m candle"] --> B{"On timeframe<br/>boundary?"}
B -->|Yes| C["Trigger fires"]
B -->|No| D["No action"]
When no timeframe is specified, the trigger fires on every 1-minute candle — effectively on every evaluation tick.
Valid Timeframes
| Timeframe | Fires Every |
|---|---|
"1m" | Every candle (every evaluation) |
"5m" | Every 5 minutes |
"15m" | Every 15 minutes |
"1h" | Every hour |
"4h" | Every 4 hours |
"1d" | Every day |
Examples
Scheduled Accumulation: Buy Every 4 Hours
[[actions]]
type = "buy"
amount = "25 USDC"
average_price = true
[[actions.triggers]]
type = "next_candle"
timeframe = "4h"
max_count = 5
This buys $25 every 4 hours, up to 5 times per position. Total additional investment: $125.
Signal Confirmation: RSI + Wait for Candle Close
When combined with other triggers (AND logic), next_candle acts as a "wait for confirmation" gate:
[[actions]]
type = "open_long"
amount = "100 USDC"
# Signal: RSI oversold on 1h candles
[[actions.triggers]]
indicator = "rsi_14"
operator = "<"
target = "30"
timeframe = "1h"
# Confirmation: wait for 1h candle to close
[[actions.triggers]]
type = "next_candle"
timeframe = "1h"
Both triggers must be true simultaneously. The action only fires when the hourly candle closes AND RSI is below 30 at that moment.
EMA Crossover with Candle Confirmation
[[actions]]
type = "open_long"
amount = "100 USDC"
# EMA fast crosses above EMA slow
[[actions.triggers]]
indicator = "ema_9"
operator = "cross_above"
target = "ema_21"
timeframe = "1h"
# Wait for hourly candle close
[[actions.triggers]]
type = "next_candle"
timeframe = "1h"
Daily DCA (Buy Every Day)
[[actions]]
type = "buy"
amount = "50 USDC"
average_price = true
[[actions.triggers]]
type = "next_candle"
timeframe = "1d"
Tips
Using next_candle with the same timeframe as your technical indicators makes backtest results more realistic. In live trading, you cannot act on a candle that has not closed yet — next_candle enforces that discipline.
max_count is essential for accumulation patterns. Without it, a next_candle trigger on "4h" would keep buying every 4 hours indefinitely. Set max_count to limit total accumulation per position.
All triggers in an action use AND logic. When next_candle is combined with other triggers, both must be true at the same moment — the candle boundary must coincide with the other conditions being met. If RSI dips below 30 mid-candle but recovers before the candle close, the combined trigger does not fire.
Related Triggers
| Trigger | What It Measures |
|---|---|
| Time in Position | Duration-based exit (time since entry) |
| Consecutive Candles | Streaks of red/green candles |
| Price Change | Global price movement over time |
Timeframes
Timeframes determine which candle interval is used to calculate an indicator's value. Botmarley supports multi-timeframe analysis, allowing you to combine signals from different time resolutions within a single strategy.
What Are Timeframes?
A timeframe defines the duration of each candle used for indicator calculation. A 1h candle aggregates 60 minutes of price action into a single open/high/low/close bar; a 1d candle aggregates an entire day.
Different timeframes reveal different aspects of the market:
| Timeframe | Perspective | Best For |
|---|---|---|
1m | Micro-scale | Precise entry timing, scalping |
5m | Short-term | Short-term momentum, dip detection |
15m | Intra-day | Day trading signals |
1h | Medium-term | Swing trading, trend confirmation |
4h | Extended | Macro trend direction |
1d | Long-term | Major trend identification |
Available Timeframes
Botmarley supports six timeframes:
1m-- 1-minute candles5m-- 5-minute candles15m-- 15-minute candles1h-- 1-hour candles4h-- 4-hour candles1d-- 1-day (daily) candles
Default Timeframe
If you omit the timeframe field from a trigger, it defaults to the base candle timeframe (typically 1m). This means the indicator is calculated on 1-minute candles:
# No timeframe specified -- uses the default (1m)
[[actions.triggers]]
indicator = "rsi_14"
operator = "<"
target = "30"
To explicitly use a different timeframe, add the timeframe field:
# RSI calculated on 1-hour candles
[[actions.triggers]]
indicator = "rsi_14"
operator = "<"
target = "30"
timeframe = "1h"
The timeframe field is optional on all trigger types -- Technical, PriceChange, and NextCandle. When omitted, the trigger evaluates against the default candle interval.
How Multi-Timeframe Works
Botmarley always fetches and stores 1-minute candles as the base data. Higher timeframes are computed from 1-minute data by aggregating candles:
flowchart TD
A["1m Candles<br/>(Source Data)"] --> B["5m Candles<br/>(5 x 1m aggregated)"]
A --> C["15m Candles<br/>(15 x 1m aggregated)"]
A --> D["1h Candles<br/>(60 x 1m aggregated)"]
A --> E["4h Candles<br/>(240 x 1m aggregated)"]
A --> F["1d Candles<br/>(1440 x 1m aggregated)"]
B --> G["Calculate Indicators<br/>on 5m candles"]
C --> H["Calculate Indicators<br/>on 15m candles"]
D --> I["Calculate Indicators<br/>on 1h candles"]
E --> J["Calculate Indicators<br/>on 4h candles"]
F --> K["Calculate Indicators<br/>on 1d candles"]
style A fill:#4a9eff,color:#fff
This means:
- You do not need separate data downloads for each timeframe.
- All timeframes are derived from the same underlying 1-minute data.
- Indicators on higher timeframes use fewer data points but represent longer periods of market action.
Using Timeframes in Triggers
Single-Timeframe Strategy
Most simple strategies use a single timeframe (or the default):
[meta]
name = "Simple_RSI"
[[actions]]
type = "open_long"
amount = "100 USDC"
[[actions.triggers]]
indicator = "rsi_14"
operator = "<"
target = "30"
# No timeframe -- uses default 1m candles
Multi-Timeframe Strategy
The real power comes from combining multiple timeframes. A common pattern is to use a higher timeframe for trend direction and a lower timeframe for entry timing:
[meta]
name = "Multi_TF_Trend_Entry"
description = "Use 1h RSI for trend, 5m for entry timing"
max_open_positions = 2
# ENTRY: 1h RSI oversold + 5m StochRSI extremely oversold
[[actions]]
type = "open_long"
amount = "100 USDC"
# Higher timeframe: confirms oversold on the 1h chart
[[actions.triggers]]
indicator = "rsi_14"
operator = "<"
target = "35"
timeframe = "1h"
# Lower timeframe: precise entry on the 5m chart
[[actions.triggers]]
indicator = "stoch_rsi_14"
operator = "<"
target = "10"
timeframe = "5m"
# EXIT: +3% profit
[[actions]]
type = "sell"
amount = "100%"
[[actions.triggers]]
type = "pos_price_change"
value = "3%"
Use higher timeframes (1h, 4h, 1d) to identify the trend direction or overall market condition. Use lower timeframes (1m, 5m, 15m) for precise entry and exit timing. This approach reduces false signals because you are aligning short-term actions with the longer-term trend.
Timeframe Mixing Within an Action
Within a single action, different triggers can use different timeframes. Since triggers are AND-combined, ALL must be true simultaneously:
[[actions]]
type = "open_long"
amount = "100 USDC"
# Trigger 1: Daily uptrend confirmed
[[actions.triggers]]
indicator = "sma_50"
operator = ">"
target = "sma_200"
timeframe = "1d"
# Trigger 2: Hourly RSI oversold
[[actions.triggers]]
indicator = "rsi_14"
operator = "<"
target = "40"
timeframe = "1h"
# Trigger 3: 5-minute momentum dip
[[actions.triggers]]
indicator = "roc_10"
operator = "<"
target = "-3"
timeframe = "5m"
This action fires only when ALL three conditions are true at the same time:
- The daily trend is bullish (SMA 50 above SMA 200)
- The hourly RSI shows an oversold condition
- The 5-minute momentum shows a sharp dip
Timeframes with Non-Technical Triggers
The timeframe field also works with price_change and next_candle triggers:
price_change with timeframe
A price change trigger with a timeframe evaluates the percentage change over that candle interval:
[[actions.triggers]]
type = "price_change"
value = "-3%"
timeframe = "1h"
This triggers when price drops 3% within the 1-hour window.
next_candle with timeframe
A next_candle trigger with a timeframe waits for the next candle close on that specific interval:
[[actions.triggers]]
type = "next_candle"
timeframe = "4h"
This triggers on every 4-hour candle close.
Some trigger types like pos_price_change and trailing_stop do not use timeframes because they measure changes relative to the position entry price, which is time-independent.
Choosing the Right Timeframe
Here is a guide to help you select timeframes for different purposes:
| Purpose | Recommended Timeframe | Why |
|---|---|---|
| Trend identification | 1d or 4h | Filters out noise, shows the big picture |
| Swing trading entries | 1h or 4h | Balanced between speed and reliability |
| Scalping entries | 1m or 5m | Fast signals for quick trades |
| Dip detection | 5m or 15m | Catches intra-day price drops |
| Volume confirmation | 1h | Smooths out minute-level volume spikes |
| Moving average crossovers | 1d | Daily crossovers are more meaningful |
Using very short timeframes (1m) for everything will generate many signals, but most may be noise. Using very long timeframes (1d) for everything may cause you to miss opportunities. The best strategies combine both.
Position Management
Position management is how Botmarley tracks your open trades, controls how many positions can be open at once, and handles adding to or exiting positions. Good position management is often the difference between a profitable strategy and a losing one.
What Is a Position?
A position is an active trade. When a strategy's open_long action fires, Botmarley creates a new position that tracks:
| Field | Description |
|---|---|
| Entry price | The price at which the position was opened |
| Quantity | How much of the asset was bought |
| Total cost | The total USDC (or other currency) spent |
| Current P&L | The unrealized profit or loss based on current price |
| Open time | When the position was created |
A position remains open until a sell action with amount = "100%" fires, or until all of the position has been sold through partial sells.
flowchart LR
A["open_long<br/>Creates Position"] --> B["Position Open<br/>Tracking P&L"]
B --> C["buy (DCA)<br/>Adds to Position"]
C --> B
B --> D["sell 50%<br/>Partial Exit"]
D --> B
B --> E["sell 100%<br/>Full Exit"]
E --> F["Position Closed"]
style A fill:#22c55e,color:#fff
style E fill:#ef4444,color:#fff
style F fill:#6b7280,color:#fff
max_open_positions
The max_open_positions field in the [meta] section controls how many positions can be open simultaneously. This is your primary tool for controlling capital exposure.
How It Works
[meta]
name = "Conservative Strategy"
max_open_positions = 1
| Setting | Behavior |
|---|---|
max_open_positions = 1 | Only one position at a time. New open_long triggers are ignored until the current position is fully closed. |
max_open_positions = 3 | Up to three positions can be open simultaneously. The fourth open_long trigger is ignored. |
| Omitted (no setting) | Unlimited positions. Every open_long trigger opens a new position. |
Running with unlimited positions (no max_open_positions) can be dangerous. In a sharp market downturn, the bot could open many positions rapidly, using up all available capital. Always set a limit unless you have a specific reason not to.
Choosing a Limit
| Style | Recommended | Why |
|---|---|---|
| Conservative | 1 | One trade at a time. Full focus on quality. |
| Moderate | 2-3 | Allows some diversification across entries. |
| Aggressive | 5+ | Many concurrent positions. Higher capital risk. |
Example:
[meta]
name = "Single Position Focus"
max_open_positions = 1
# This strategy opens at most one position.
# Even if the entry trigger fires again, no new position is created
# until the current one is fully closed.
DCA -- Dollar-Cost Averaging
DCA is a technique where you buy more of an asset as the price drops, lowering your average entry price. In Botmarley, DCA is implemented using buy actions with average_price = true.
Why Use DCA?
Without DCA, if you buy at $50,000 and the price drops to $48,000, you need the price to return to $50,000 to break even. With DCA, you buy more at $48,000, which lowers your average entry price so you break even at a lower price.
DCA in Practice
Here is how a two-level DCA strategy works:
flowchart TD
A["open_long: Buy $100 at $50,000<br/>Entry Price = $50,000"] --> B{"Price drops 2%<br/>to $49,000?"}
B -- "Yes" --> C["buy: Add $200 at $49,000<br/>average_price = true<br/>New Entry = $49,333"]
B -- "No" --> D{"Price rises 3%<br/>from entry?"}
C --> E{"Price drops 4%<br/>to $48,000?"}
E -- "Yes" --> F["buy: Add $300 at $48,000<br/>average_price = true<br/>New Entry = $48,500"]
E -- "No" --> D
F --> D
D -- "Yes" --> G["sell 100%<br/>Take Profit"]
style A fill:#22c55e,color:#fff
style C fill:#4a9eff,color:#fff
style F fill:#4a9eff,color:#fff
style G fill:#ef4444,color:#fff
Entry Price Recalculation
When average_price = true, the entry price is recalculated as a weighted average:
new_entry_price = total_cost / total_quantity
Step-by-step example:
| Step | Action | Price | Amount | Total Cost | Total Qty | Avg Entry |
|---|---|---|---|---|---|---|
| 1 | open_long | $50,000 | $100 | $100 | 0.002 BTC | $50,000 |
| 2 | buy (DCA) | $49,000 | $200 | $300 | 0.006082 BTC | $49,327 |
| 3 | buy (DCA) | $48,000 | $300 | $600 | 0.012332 BTC | $48,654 |
After all three buys, the average entry is $48,654 instead of $50,000. The position needs only a 0% (break-even) to $48,654 recovery instead of a full return to $50,000.
DCA works best in markets that tend to recover (mean reversion). It can amplify losses in a prolonged downtrend. Always pair DCA with a stop-loss to limit maximum exposure.
max_count for DCA Levels
Use max_count on trigger to limit how many times a DCA level fires per position. Without it, a DCA trigger could fire repeatedly if the price oscillates around the threshold.
[[actions]]
type = "buy"
amount = "200 USDC"
average_price = true
[[actions.triggers]]
type = "pos_price_change"
value = "-2%"
max_count = 1 # Only fire once per position
With max_count = 1, this DCA level triggers exactly once. Even if the price bounces above and back below -2%, it will not trigger again for the same position.
Position Tracking
While a position is open, Botmarley continuously tracks:
Entry Price
The price at which the position was opened (or the weighted average if DCA has been applied). This is the reference point for all pos_price_change triggers.
Current P&L (Profit & Loss)
Calculated as:
P&L (%) = (current_price - entry_price) / entry_price * 100
For example, if entry is $48,654 and current price is $50,000:
P&L = (50000 - 48654) / 48654 * 100 = +2.77%
Position Size
The total quantity of the asset held and the total cost basis. This is used by percentage-based sell amounts ("50%" sells half the quantity).
Selling: Partial vs. Full Exit
Partial Sell
Selling less than 100% of the position lets you take some profit while keeping exposure:
# Sell half when profitable
[[actions]]
type = "sell"
amount = "50%"
[[actions.triggers]]
type = "pos_price_change"
value = "2%"
After this sell, 50% of the position remains open. The remaining position continues to be tracked with the same entry price.
Full Exit
Selling 100% closes the position entirely:
# Full exit on profit target
[[actions]]
type = "sell"
amount = "100%"
[[actions.triggers]]
type = "pos_price_change"
value = "5%"
After a full exit, the position is closed. The strategy's open_long action can now create a new position (subject to max_open_positions).
Scaling Out
You can combine multiple sell actions to scale out of a position gradually:
# Sell 30% at +2%
[[actions]]
type = "sell"
amount = "30%"
[[actions.triggers]]
type = "pos_price_change"
value = "2%"
# Sell 50% at +4%
[[actions]]
type = "sell"
amount = "50%"
[[actions.triggers]]
type = "pos_price_change"
value = "4%"
# Sell remaining 100% at +6%
[[actions]]
type = "sell"
amount = "100%"
[[actions.triggers]]
type = "pos_price_change"
value = "6%"
Percentage sells are relative to the current position size, not the original. If you sell 50% and then 50% again, you have sold 75% of the original position (50% + 50% of the remaining 50%).
Complete DCA Strategy Example
Here is a full strategy that demonstrates position management in action -- it enters on a Bollinger Band touch, DCA buys at -2%, -4%, and -6%, and exits at +3% profit or -10% stop-loss:
[meta]
name = "BB DCA with Stop Loss"
description = "Bollinger Band entry, 3-level DCA, profit target, and hard stop-loss"
max_open_positions = 1
# ENTRY: Price touches lower Bollinger Band
[[actions]]
type = "open_long"
amount = "100 USDC"
average_price = false
[[actions.triggers]]
indicator = "price"
operator = "<"
target = "bb_lower"
timeframe = "1h"
# DCA LEVEL 1: Buy more at -2% from entry
[[actions]]
type = "buy"
amount = "100 USDC"
average_price = true
[[actions.triggers]]
type = "pos_price_change"
value = "-2%"
max_count = 1
# DCA LEVEL 2: Buy more at -4% from entry
[[actions]]
type = "buy"
amount = "200 USDC"
average_price = true
[[actions.triggers]]
type = "pos_price_change"
value = "-4%"
max_count = 1
# DCA LEVEL 3: Buy more at -6% from entry
[[actions]]
type = "buy"
amount = "300 USDC"
average_price = true
[[actions.triggers]]
type = "pos_price_change"
value = "-6%"
max_count = 1
# TAKE PROFIT: Sell everything at +3%
[[actions]]
type = "sell"
amount = "100%"
[[actions.triggers]]
type = "pos_price_change"
value = "3%"
# STOP LOSS: Cut losses at -10%
[[actions]]
type = "sell"
amount = "100%"
[[actions.triggers]]
type = "pos_price_change"
value = "-10%"
How this plays out:
- Price drops below the lower Bollinger Band on the 1h chart -- the bot buys $100.
- If price continues dropping 2% from entry, the bot buys another $100 and averages the entry price down.
- If it drops 4% from entry, another $200 is added. At 6%, another $300.
- Maximum total investment: $100 + $100 + $200 + $300 = $700.
- If price recovers 3% from the (averaged) entry price, everything is sold for profit.
- If price drops 10% from entry without recovery, the stop-loss fires and cuts losses.
Notice the increasing DCA amounts ($100, $100, $200, $300). This is called pyramid DCA -- you invest more at lower prices where the risk-reward is better. The largest buy happens at the deepest dip.
Strategy Examples
This page contains four complete, working strategies with line-by-line explanations. You can use these as starting points for your own strategies -- copy the TOML, modify the parameters, and backtest to see how they perform on your target pair.
1. RSI Scalper
A simple momentum strategy that buys when RSI signals oversold conditions and sells in two stages as price recovers.
Concept: RSI below 30 indicates extreme selling pressure. Statistically, price tends to bounce after reaching oversold levels. This strategy captures that bounce by entering at RSI < 30 and exiting in two steps: partial at RSI > 50 (neutral) and full at RSI > 70 (overbought).
Full TOML
[meta]
name = "RSI_Scalper"
# ENTRY: Buy when RSI drops below 30 (oversold)
[[actions]]
type = "open_long"
amount = "100 USDC"
[[actions.triggers]]
indicator = "rsi_14"
operator = "<"
target = "30"
# PARTIAL EXIT: Sell 50% when RSI recovers to neutral
[[actions]]
type = "sell"
amount = "50%"
[[actions.triggers]]
indicator = "rsi_14"
operator = ">"
target = "50"
# FULL EXIT: Sell remaining when RSI reaches overbought
[[actions]]
type = "sell"
amount = "100%"
[[actions.triggers]]
indicator = "rsi_14"
operator = ">"
target = "70"
Line-by-Line Explanation
[meta] -- Strategy metadata. No max_open_positions set, so only one position at a time by default behavior of the entry trigger.
Action 1 -- Entry:
type = "open_long"-- Creates a new position.amount = "100 USDC"-- Buys $100 worth of the asset.- Trigger:
rsi_14 < 30-- RSI with a 14-period lookback drops below 30. This is the classic oversold signal.
Action 2 -- Partial Exit:
type = "sell"-- Sells part of the existing position.amount = "50%"-- Sells half. This locks in partial profit while leaving room for more upside.- Trigger:
rsi_14 > 50-- RSI recovers to neutral territory. The worst of the selling is over.
Action 3 -- Full Exit:
type = "sell"-- Sells the rest.amount = "100%"-- Exits completely.- Trigger:
rsi_14 > 70-- RSI reaches overbought. The bounce is likely exhausted.
This strategy has no stop-loss. For production use, add a stop-loss action (e.g., sell 100% at pos_price_change of -5%). Without a stop-loss, the bot holds through any drawdown waiting for RSI to recover.
Strengths and Weaknesses
| Strength | Weakness |
|---|---|
| Simple and easy to understand | No stop-loss -- can hold losing positions |
| Works well in ranging markets | Performs poorly in strong downtrends |
| Two-stage exit captures more gain | RSI can stay below 30 for extended periods |
2. Bollinger Bounce DCA
A mean-reversion strategy that enters when price touches the lower Bollinger Band, uses DCA to average down on continued dips, and exits on recovery.
Concept: Bollinger Bands measure volatility. When price drops below the lower band, it is statistically "extended" and tends to revert toward the middle band. This strategy exploits that tendency with DCA to handle cases where price continues to drop after the initial entry.
Full TOML
[meta]
name = "BB_Bounce_DCA"
description = "Enter at BB lower, DCA at -2% and -4%, exit at +3%"
max_open_positions = 3
# ENTRY: Price drops below the lower Bollinger Band
[[actions]]
type = "open_long"
amount = "100 USDC"
average_price = false
[[actions.triggers]]
indicator = "price"
operator = "<"
target = "bb_lower"
# DCA LEVEL 1: Position drops 2% -- buy more
[[actions]]
type = "buy"
amount = "100 USDC"
average_price = true
[[actions.triggers]]
type = "pos_price_change"
value = "-2%"
max_count = 1
# DCA LEVEL 2: Position drops 4% -- buy even more
[[actions]]
type = "buy"
amount = "200 USDC"
average_price = true
[[actions.triggers]]
type = "pos_price_change"
value = "-4%"
max_count = 1
# TAKE PROFIT: Exit at +3% from averaged entry
[[actions]]
type = "sell"
amount = "100%"
[[actions.triggers]]
type = "pos_price_change"
value = "3%"
# STOP LOSS: Cut losses at -8%
[[actions]]
type = "sell"
amount = "100%"
[[actions.triggers]]
type = "pos_price_change"
value = "-8%"
Line-by-Line Explanation
[meta]:
max_open_positions = 3-- allows up to 3 simultaneous positions. If the entry trigger fires while 3 positions are open, it is ignored.
Action 1 -- Entry:
price < bb_lower-- current price is below the lower Bollinger Band. This means price is at least 2 standard deviations below the 20-period mean.average_price = false-- this is the initial entry, no averaging needed.
Action 2 -- DCA Level 1:
type = "buy"-- adds to the existing position.average_price = true-- recalculates entry price as a weighted average.pos_price_change = "-2%"-- fires when price drops 2% below the entry price.max_count = 1-- only triggers once per position, preventing repeated buys if price oscillates.
Action 3 -- DCA Level 2:
- Same logic as Level 1, but fires at -4% with a larger amount ($200). The increasing amounts at deeper dips is pyramid DCA -- more capital deployed where risk-reward improves.
Action 4 -- Take Profit:
pos_price_change = "3%"-- sell everything when price is 3% above the (averaged) entry. Thanks to DCA, the averaged entry is lower than the original entry, making this target easier to reach.
Action 5 -- Stop Loss:
pos_price_change = "-8%"-- if price drops 8% from entry without recovery, cut losses.
The stop-loss at -8% means the maximum loss per position (before DCA) is 8% of $100 = $8. With DCA, total capital at risk is $100 + $100 + $200 = $400, but the averaged entry brings the stop-loss trigger closer to the deeper DCA levels.
3. MACD Crossover
A trend-following strategy that enters on a MACD bullish crossover and exits on a bearish crossover, with DCA and a fixed take-profit target.
Concept: When the MACD line crosses above its signal line, it indicates bullish momentum is increasing. When it crosses below, momentum is fading. This strategy rides the momentum wave.
Full TOML
[meta]
name = "MACD_Crossover"
description = "Enter on MACD bullish cross, DCA on dips, exit on bearish cross or profit"
max_open_positions = 3
# ENTRY: MACD line crosses above signal line on 1h chart
[[actions]]
type = "open_long"
amount = "100 USDC"
[[actions.triggers]]
indicator = "macd_line"
operator = "cross_above"
target = "macd_signal"
timeframe = "1h"
# DCA LEVEL 1: Buy more if price dips 2%
[[actions]]
type = "buy"
amount = "100 USDC"
average_price = true
[[actions.triggers]]
type = "pos_price_change"
value = "-2%"
max_count = 1
# DCA LEVEL 2: Buy more if price dips 4%
[[actions]]
type = "buy"
amount = "200 USDC"
average_price = true
[[actions.triggers]]
type = "pos_price_change"
value = "-4%"
max_count = 1
# TAKE PROFIT: Exit at +3%
[[actions]]
type = "sell"
amount = "100%"
[[actions.triggers]]
type = "pos_price_change"
value = "3%"
# EXIT ON BEARISH CROSS: MACD line crosses below signal
[[actions]]
type = "sell"
amount = "100%"
[[actions.triggers]]
indicator = "macd_line"
operator = "cross_below"
target = "macd_signal"
timeframe = "1h"
Line-by-Line Explanation
Action 1 -- Entry:
macd_line cross_above macd_signalon1h-- this is the classic MACD bullish crossover. It occurs when the difference between the 12-period and 26-period EMAs starts increasing, signaling that short-term momentum is turning bullish.timeframe = "1h"-- using hourly candles filters out noise. A 1-minute MACD crossover is common and often meaningless; a 1-hour crossover is a stronger signal.
Actions 2 & 3 -- DCA:
- Same pyramid DCA pattern as the previous example. If the crossover was a false signal and price drops, DCA lowers the average entry.
max_count = 1prevents repeated buys.
Action 4 -- Take Profit:
pos_price_change = "3%"-- exits with profit regardless of MACD state.
Action 5 -- Bearish Exit:
macd_line cross_below macd_signalon1h-- the opposite crossover. Momentum has shifted from bullish to bearish.- This acts as a dynamic stop-loss -- instead of a fixed percentage, you exit when the momentum signal that got you in reverses.
The MACD crossover strategy has two exit conditions: a fixed profit target (+3%) and a dynamic momentum reversal (bearish cross). Whichever happens first closes the position. This is a good pattern -- you take profit when available, but cut losses when the thesis breaks.
Strengths and Weaknesses
| Strength | Weakness |
|---|---|
| Follows momentum -- rides trends | MACD can whipsaw in ranging/choppy markets |
| Dynamic exit based on momentum shift | Crossovers lag -- entry/exit is never at the top/bottom |
| DCA mitigates false signal entries | 1h timeframe means slower reaction to fast moves |
4. Multi-Timeframe Trend Follower
An advanced strategy that uses daily moving averages for trend direction, hourly RSI for timing, 5-minute momentum for precise entry, and a trailing stop for exits.
Concept: This strategy only enters in confirmed uptrends (daily SMA golden cross), waits for hourly oversold conditions, and times the entry using 5-minute momentum dips. The trailing stop locks in profits on runs while allowing the position to grow.
Full TOML
[meta]
name = "Multi_TF_Trend_Follower"
description = "Daily trend filter + hourly RSI + 5m entry + trailing stop exit"
max_open_positions = 1
# ENTRY: Three-layer confirmation
# Layer 1: Daily uptrend (SMA 50 > SMA 200 = golden cross)
# Layer 2: Hourly RSI oversold (< 40)
# Layer 3: 5-minute sharp dip (ROC < -3)
[[actions]]
type = "open_long"
amount = "100 USDC"
average_price = false
[[actions.triggers]]
indicator = "sma_50"
operator = ">"
target = "sma_200"
timeframe = "1d"
[[actions.triggers]]
indicator = "rsi_14"
operator = "<"
target = "40"
timeframe = "1h"
[[actions.triggers]]
indicator = "roc_10"
operator = "<"
target = "-3"
timeframe = "5m"
# DCA: Buy more if price drops 5%, but only if RSI confirms oversold
[[actions]]
type = "buy"
amount = "100 USDC"
average_price = true
[[actions.triggers]]
type = "pos_price_change"
value = "-5%"
[[actions.triggers]]
indicator = "rsi_14"
operator = "<"
target = "35"
timeframe = "1h"
# TAKE PROFIT: +5% fixed target
[[actions]]
type = "sell"
amount = "100%"
[[actions.triggers]]
type = "pos_price_change"
value = "5%"
# TRAILING STOP: Sell when price drops 3% from its peak since entry
[[actions]]
type = "sell"
amount = "100%"
[[actions.triggers]]
type = "trailing_stop"
value = "-3%"
# TREND BREAK EXIT: Sell if the daily trend reverses (death cross)
[[actions]]
type = "sell"
amount = "100%"
[[actions.triggers]]
indicator = "sma_50"
operator = "cross_below"
target = "sma_200"
timeframe = "1d"
# STOP LOSS: Hard stop at -8%
[[actions]]
type = "sell"
amount = "100%"
[[actions.triggers]]
type = "pos_price_change"
value = "-8%"
Line-by-Line Explanation
[meta]:
max_open_positions = 1-- conservative, only one position at a time. Quality over quantity.
Action 1 -- Entry (3 triggers, ALL must be true):
- Trigger 1:
sma_50 > sma_200on1d-- the daily 50-period SMA is above the 200-period SMA. This is the "golden cross" -- the strongest trend confirmation in traditional technical analysis. It ensures we only buy in a macro uptrend. - Trigger 2:
rsi_14 < 40on1h-- hourly RSI is oversold. Even in an uptrend, price dips temporarily. This catches those dips. - Trigger 3:
roc_10 < -3on5m-- the 5-minute Rate of Change shows a sharp 3%+ dip in the last 10 candles. This is the precise "buy the dip" moment.
All three must be true simultaneously. This is a very selective entry that fires rarely but with high conviction.
Action 2 -- DCA with Confirmation:
pos_price_change = "-5%"ANDrsi_14 < 35on1h-- adds to the position only if price has dropped significantly AND the hourly RSI confirms oversold. The RSI confirmation prevents DCA during a trend break.
Action 3 -- Take Profit:
pos_price_change = "5%"-- exits with +5% profit. A higher target than the simpler strategies because the entry is more selective.
Action 4 -- Trailing Stop:
trailing_stop = "-3%"-- this is the key feature. A trailing stop tracks the highest price since entry and sells when price drops 3% from that peak. If price rises 10% and then drops 3%, the trailing stop fires with approximately +7% profit locked in.
Action 5 -- Trend Break Exit:
sma_50 cross_below sma_200on1d-- the daily death cross. If the macro trend that justified our entry reverses, exit immediately regardless of P&L.
Action 6 -- Hard Stop Loss:
pos_price_change = "-8%"-- absolute worst-case exit. If all other exits fail to trigger, this limits loss to 8%.
This strategy has four separate exit conditions. Whichever fires first closes the position:
- +5% profit target (ideal case)
- -3% trailing stop (locks in gains on a run)
- Daily death cross (trend reversal)
- -8% hard stop (absolute maximum loss)
Multiple exit conditions provide layered protection -- this is a hallmark of well-designed strategies.
Strengths and Weaknesses
| Strength | Weakness |
|---|---|
| Very selective -- high-quality entries | Fires infrequently; may miss opportunities |
| Multi-timeframe reduces false signals | Requires data on all timeframes |
| Trailing stop captures large moves | Complex -- harder to debug and optimize |
| Trend filter avoids buying in downtrends | Daily golden cross can be late to form |
Comparing the Strategies
| Strategy | Complexity | Entry Frequency | Risk Level | Best Market Condition |
|---|---|---|---|---|
| RSI Scalper | Low | High | Medium | Ranging / choppy |
| Bollinger Bounce DCA | Medium | Medium | Low-Medium | Mean-reverting |
| MACD Crossover | Medium | Medium | Medium | Trending |
| Multi-TF Trend Follower | High | Low | Low | Strong uptrend |
Start with the RSI Scalper or Bollinger Bounce DCA to learn how strategies work. Once you are comfortable, try the MACD Crossover. Graduate to the Multi-TF Trend Follower when you understand multi-timeframe analysis and trailing stops. Always backtest before going live.
Backtesting
Backtesting is the process of running a trading strategy against historical market data to see how it would have performed in the past. Instead of risking real money to find out whether your strategy works, you let Botmarley replay weeks or months of price history and apply your strategy rules to every candle, exactly as the live trading engine would.
The result is a detailed report: how much money you would have made or lost, how many trades fired, what your win rate was, and where the strategy struggled.
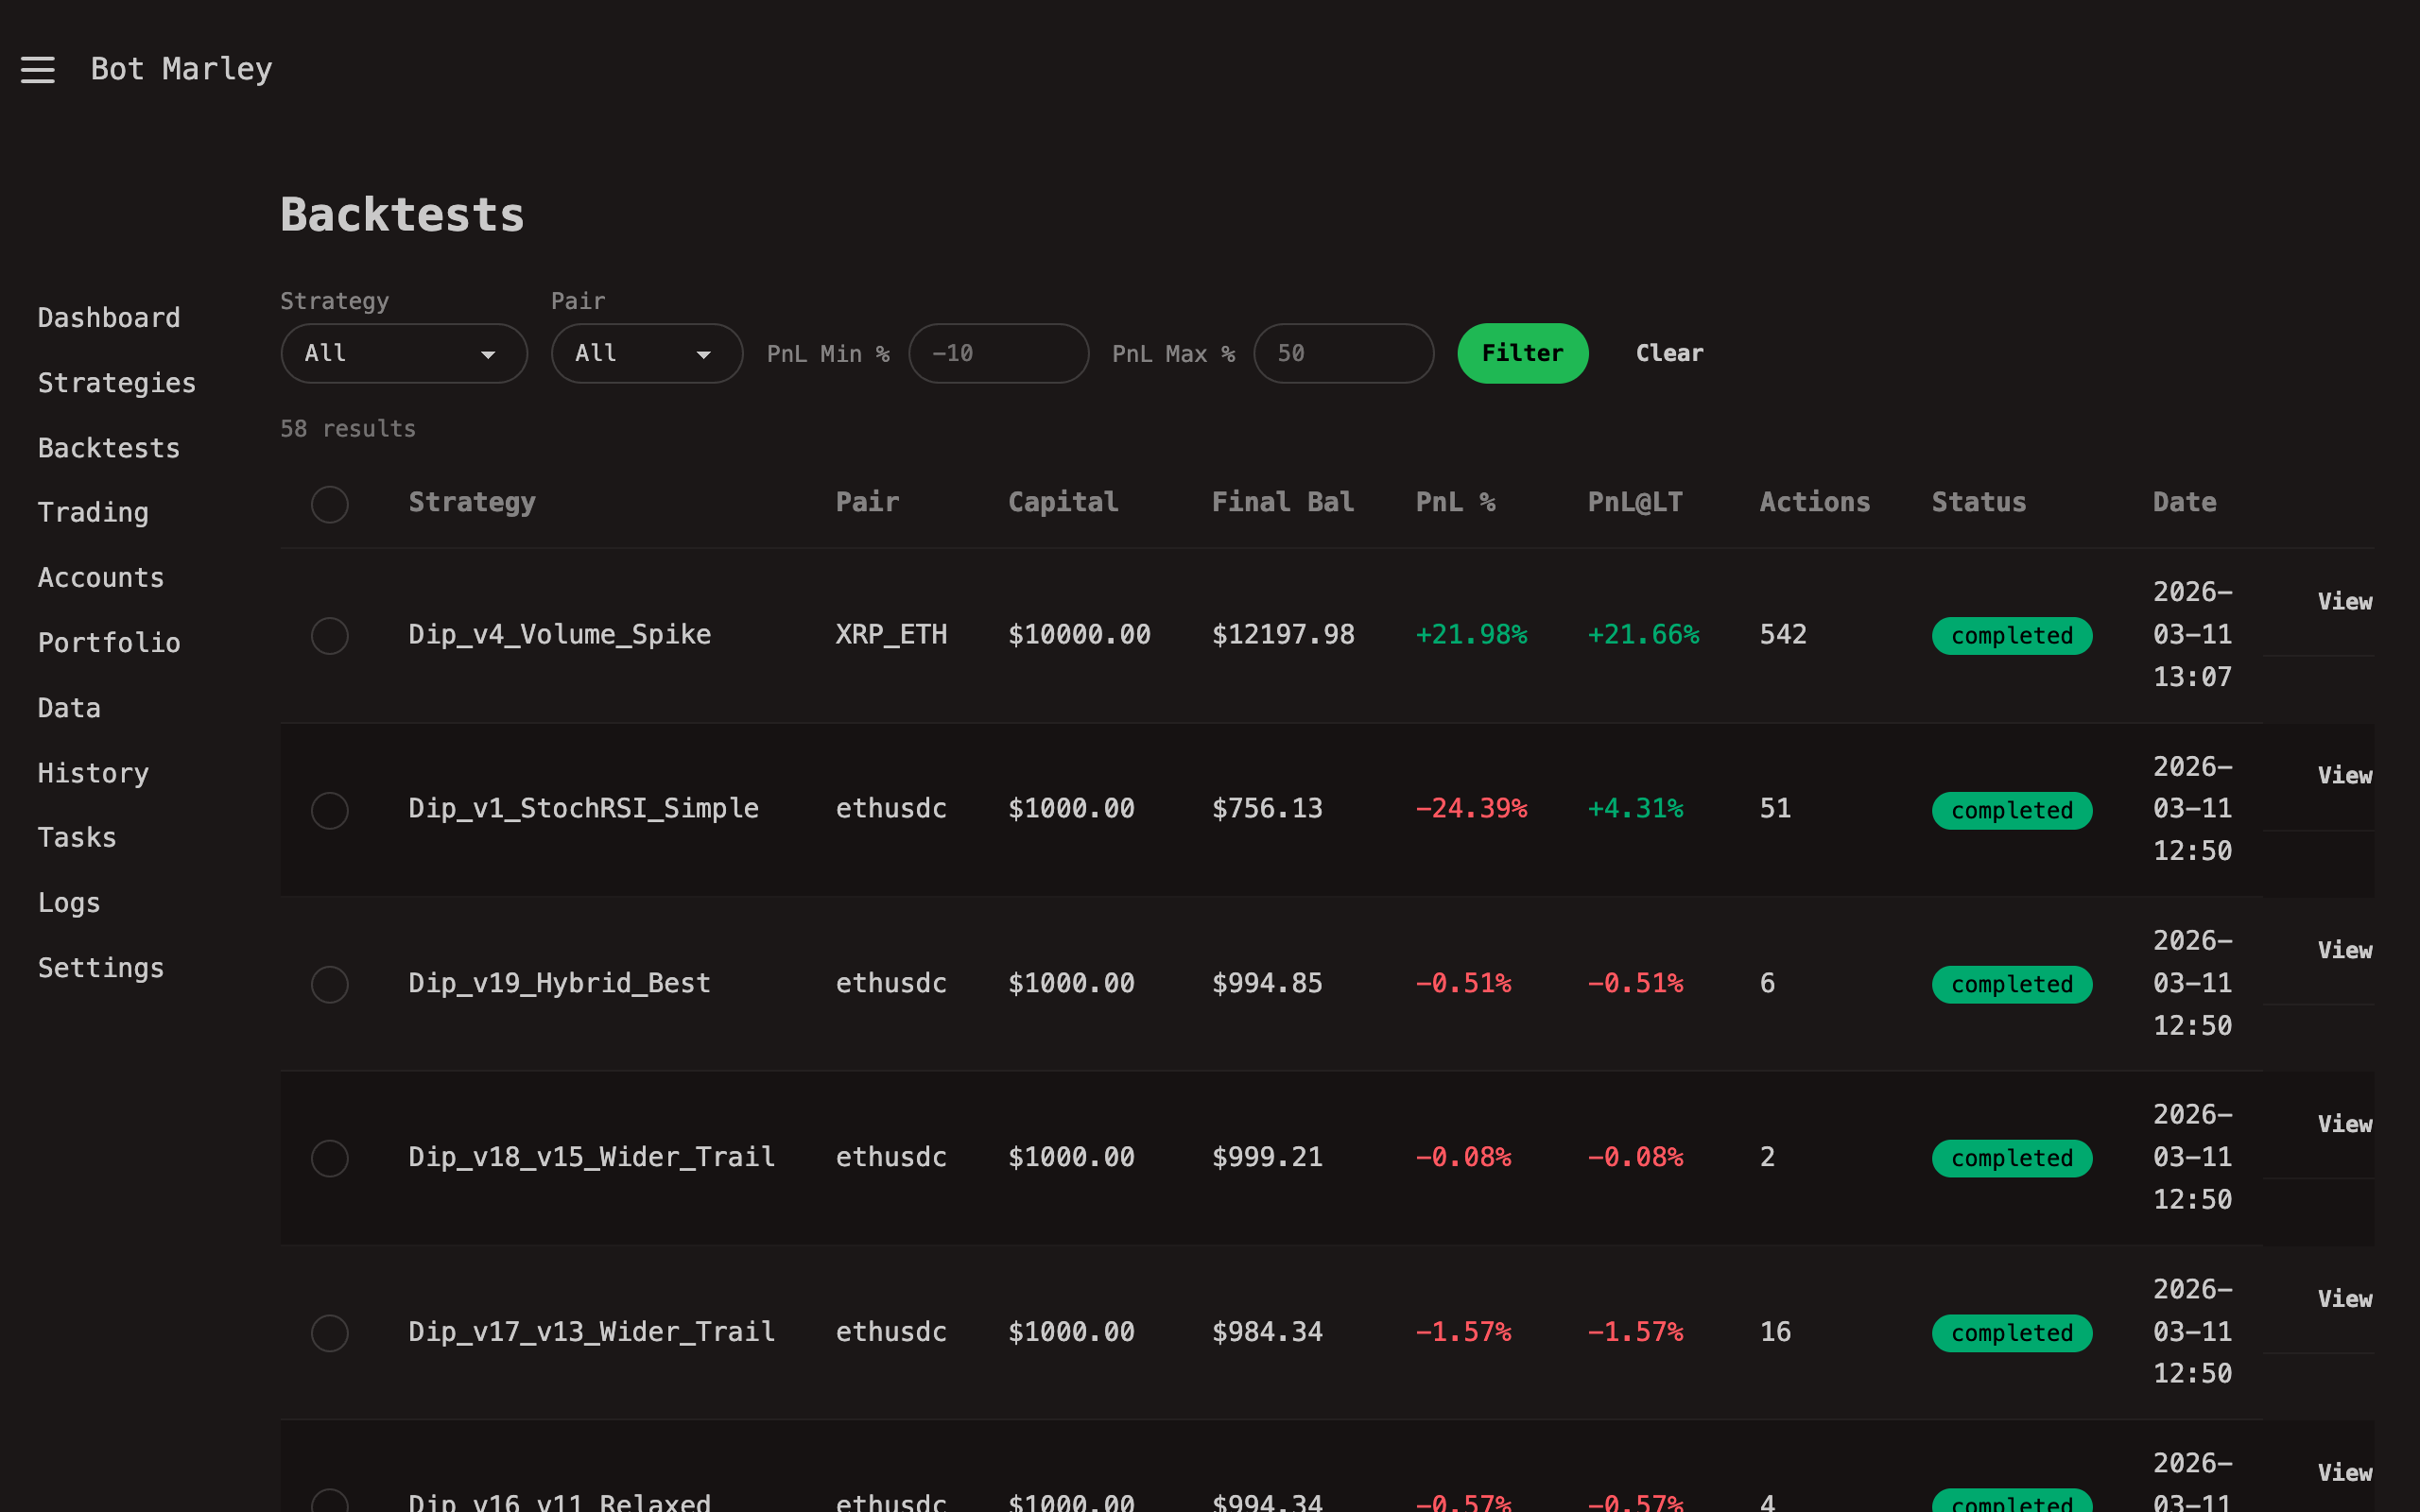
Why Backtesting Matters
Building a strategy based on intuition alone is gambling. Backtesting gives you evidence. Specifically, it lets you:
- Validate logic before risking capital. A strategy that sounds good on paper might produce terrible results when applied to actual price data. Backtesting exposes that before you lose money.
- Compare strategies objectively. Instead of guessing which of your three strategies is "better," you can run all three against the same data and compare the numbers.
- Tune parameters with feedback. If your RSI threshold is set to 30, what happens at 25 or 35? Backtesting lets you iterate quickly.
- Build confidence. Even a profitable strategy will have losing streaks. Seeing those drawdowns in a backtest prepares you for what live trading actually feels like.
How Botmarley Backtesting Works
Botmarley's backtest engine processes candles one at a time (tick-by-tick), evaluating your strategy rules at each step. The pipeline looks like this:
flowchart TD
A["Load historical candles<br/>(Arrow files on disk)"] --> B["Pre-compute indicator cache<br/>(RSI, SMA, MACD, etc.)"]
B --> C["Initialize portfolio<br/>(USD balance = initial capital)"]
C --> D["Process next candle"]
D --> E{"Evaluate triggers<br/>for each action"}
E -- "Trigger fired" --> F["Execute action<br/>(buy/sell, update portfolio)"]
E -- "No match" --> D
F --> G{"More candles?"}
G -- Yes --> D
G -- No --> H["Calculate summary metrics<br/>(PnL, win rate, fees, etc.)"]
H --> I["Save results to database"]
The engine follows a three-phase execution model:
-
Pre-computation phase. Before processing any candles, Botmarley calculates all indicator values (RSI, SMA, Bollinger Bands, MACD, etc.) for the entire candle history and stores them in a cache. This means each tick lookup during execution is instant -- the engine never recalculates an indicator mid-run.
-
Execution phase. The engine walks through every candle in order. At each tick, it evaluates every action in your strategy. If an action's triggers are satisfied, it executes (opens a position, buys more, or sells). The portfolio state updates immediately: USD balance goes down when buying, crypto balance goes up, and vice versa for sells.
-
Summary phase. After the last candle, the engine calculates final metrics: net PnL, win rate, trading fees, max drawdown, and more. Everything is saved to PostgreSQL along with the full action log.
The 0.1% Trading Fee
Every executed trade in a backtest incurs a simulated 0.1% fee on the trade amount. This fee is not deducted from your portfolio during execution -- it is calculated separately and subtracted from the net result at the end.
For example, if you buy $1,000 worth of BTC, the fee for that trade is $1.00. If you later sell all of it for $1,050, the sell fee is $1.05. Your net result (before fees) is +$50. Your final result (after fees) is $50 - $1.00 - $1.05 = $47.95.
The 0.1% rate is a simplified approximation of exchange fees. Actual fee schedules on Kraken and Binance vary by trading volume tier and maker/taker status, but 0.1% is a reasonable middle ground for most users.
Limitations of Backtesting
Backtesting is a powerful tool, but it has real limitations. Understanding these will save you from nasty surprises when you go live.
| Limitation | What it means |
|---|---|
| No slippage simulation | In a backtest, your order fills at the exact candle close price. In live trading, the actual fill price may be slightly different, especially during fast-moving markets. |
| No liquidity modeling | The backtest assumes your order size is small enough to fill completely. In reality, large orders on thin order books may only partially fill or move the price against you. |
| No latency | Backtests execute instantly. Live trading involves network round-trips to the exchange, which can introduce delays of hundreds of milliseconds to seconds. |
| Perfect information | The backtest "sees" the full candle (open, high, low, close) for each tick. In live trading, you only see the close price at the end of the candle interval. |
| Simplified fees | The flat 0.1% fee does not account for tiered fee schedules, funding rates, or other exchange-specific costs. |
Backtest vs. Live Trading
The backtest engine and the live trading engine share the same core evaluation logic -- the same trigger evaluation code, the same portfolio tracking, the same action execution. This means a strategy that "works" in backtesting will behave identically in live trading under ideal conditions.
The differences are:
| Aspect | Backtest | Live Trading |
|---|---|---|
| Data source | Arrow files on disk | Exchange REST API (polled every 60s) |
| Execution speed | Thousands of candles per second | One candle per poll interval |
| Order fills | Instant at candle close price | Exchange order book (may slip) |
| Fees | Simulated 0.1% flat | Actual exchange fee schedule |
| Portfolio | Simulated in memory | Paper (simulated) or Real (Kraken/Binance) |
| Risk | Zero | Paper = zero, Exchange = real money |
Past performance does not guarantee future results. A strategy that returned +40% in a backtest against last month's data may lose money next month. Markets change, volatility shifts, and conditions that produced your backtest profits may never repeat. Always treat backtest results as one input among many, not as a prediction.
Running a Backtest
This chapter walks you through running a backtest from start to finish. By the end, you will have a completed backtest result with PnL, trade markers on a chart, and a full action log.
Prerequisites
Before you can run a backtest, you need two things:
-
A strategy. You must have at least one strategy saved in the Strategy Editor. If you have not created one yet, see the Strategy Editor chapter.
-
Historical candle data. Botmarley runs backtests against Arrow files stored on disk. You must download historical data for the pair you want to test before running a backtest. See Downloading History for how to do this.
If you try to run a backtest without historical data for the selected pair and date range, the backtest will fail with an "insufficient data" error.
Step-by-Step: Running a Backtest
1. Navigate to the Strategy Editor
Open the Botmarley web interface at http://localhost:3000 and click Strategies in the sidebar. Find the strategy you want to test and click on it to open the detail page.
2. Click the "Backtest" Button
On the strategy detail page, you will see a Backtest button (or section). Clicking it opens the backtest configuration form.
3. Configure the Backtest
Fill in the backtest parameters:
| Parameter | Description | Example |
|---|---|---|
| Pair | The trading pair to test against. | BTC/USD, ETH/USD |
| Start date | The beginning of the historical period. | 2025-09-01 |
| End date | The end of the historical period. | 2025-10-01 |
| Initial capital (USD) | The starting balance for the simulated portfolio. | 1000 |
- Start with a 1-month range to get meaningful results without waiting too long.
- Make sure your downloaded historical data covers the entire date range. If you have data from Sept 15 to Oct 15 but set the start date to Sept 1, the backtest will only use data from Sept 15 onward.
- Avoid testing against extremely short periods (a few hours). Strategy triggers may not fire often enough to produce useful results.
- Use an amount that reflects what you would actually trade with. A strategy tested with $100,000 may behave differently than one tested with $500 because position sizes scale with capital.
- Common starting points: $1,000 for exploration, $10,000 for more realistic testing.
4. Submit and Wait
Click Run Backtest. Botmarley creates a background task for the backtest and adds it to the task queue. You will see a confirmation that the task has been queued.
The backtest runs asynchronously -- you do not need to keep the page open. The pipeline is:
flowchart LR
A["Click Run Backtest"] --> B["Task queued"]
B --> C["Task worker picks up task"]
C --> D["Engine processes candles"]
D --> E["Results saved to database"]
E --> F["Backtest appears on<br/>Backtests page"]
For a typical 1-month period (about 43,000 one-minute candles), the backtest completes in a few seconds to under 30 seconds, depending on your hardware and strategy complexity.
5. View the Results
Navigate to the Backtests page by clicking Backtests in the sidebar. You will see a table of all backtest runs, sorted by creation date. Your new backtest will appear at the top with a status of Completed (or Failed if something went wrong).
Click on the backtest row to open the full results page. See Understanding Results for a detailed breakdown of what you will find there.
What Happens Behind the Scenes
When you click Run Backtest, here is what Botmarley does internally:
- Validates the strategy TOML and parses it into the internal strategy format.
- Loads candle data from the Arrow files on disk for the selected pair and date range.
- Enqueues a
BacktestRuntask in the task queue with your configuration. - The task worker picks up the task, creates a
BacktestEngine, and callsBacktestEngine::run(). - The engine pre-computes all indicator values (RSI, SMA, Bollinger Bands, etc.) into a cache for fast lookups.
- The engine walks through every candle tick-by-tick, evaluating your triggers and executing actions when conditions are met.
- After the last candle, it calculates summary metrics (PnL, win rate, fees, etc.).
- Results and the full action log are saved to PostgreSQL.
- The task is marked complete, and the backtest appears on the Backtests page.
Troubleshooting
| Problem | Likely cause | Fix |
|---|---|---|
| Backtest status is "Failed" | Missing historical data for the pair/date range | Download history for that pair first |
| Zero trades executed | Strategy triggers never fired during the period | Check your trigger thresholds -- they may be too strict for the selected period |
| Backtest takes very long | Very large date range (several months of 1m data) | Try a shorter date range, or wait -- performance targets are under 30 seconds for one month |
| "Insufficient data" error | Date range extends beyond available Arrow data | Adjust dates to match your downloaded data |
Understanding Results
After a backtest completes, Botmarley saves a detailed results page with summary statistics, interactive charts, and a full action log. This chapter explains every piece of that page so you know exactly what you are looking at.
The Results Page Layout
The backtest detail page is organized into several sections:
- Summary statistics -- the headline numbers at the top.
- Price chart -- candlestick chart with buy/sell markers overlaid.
- Equity curve -- a line chart showing your portfolio value over time.
- Action log -- a table of every trade the strategy executed.
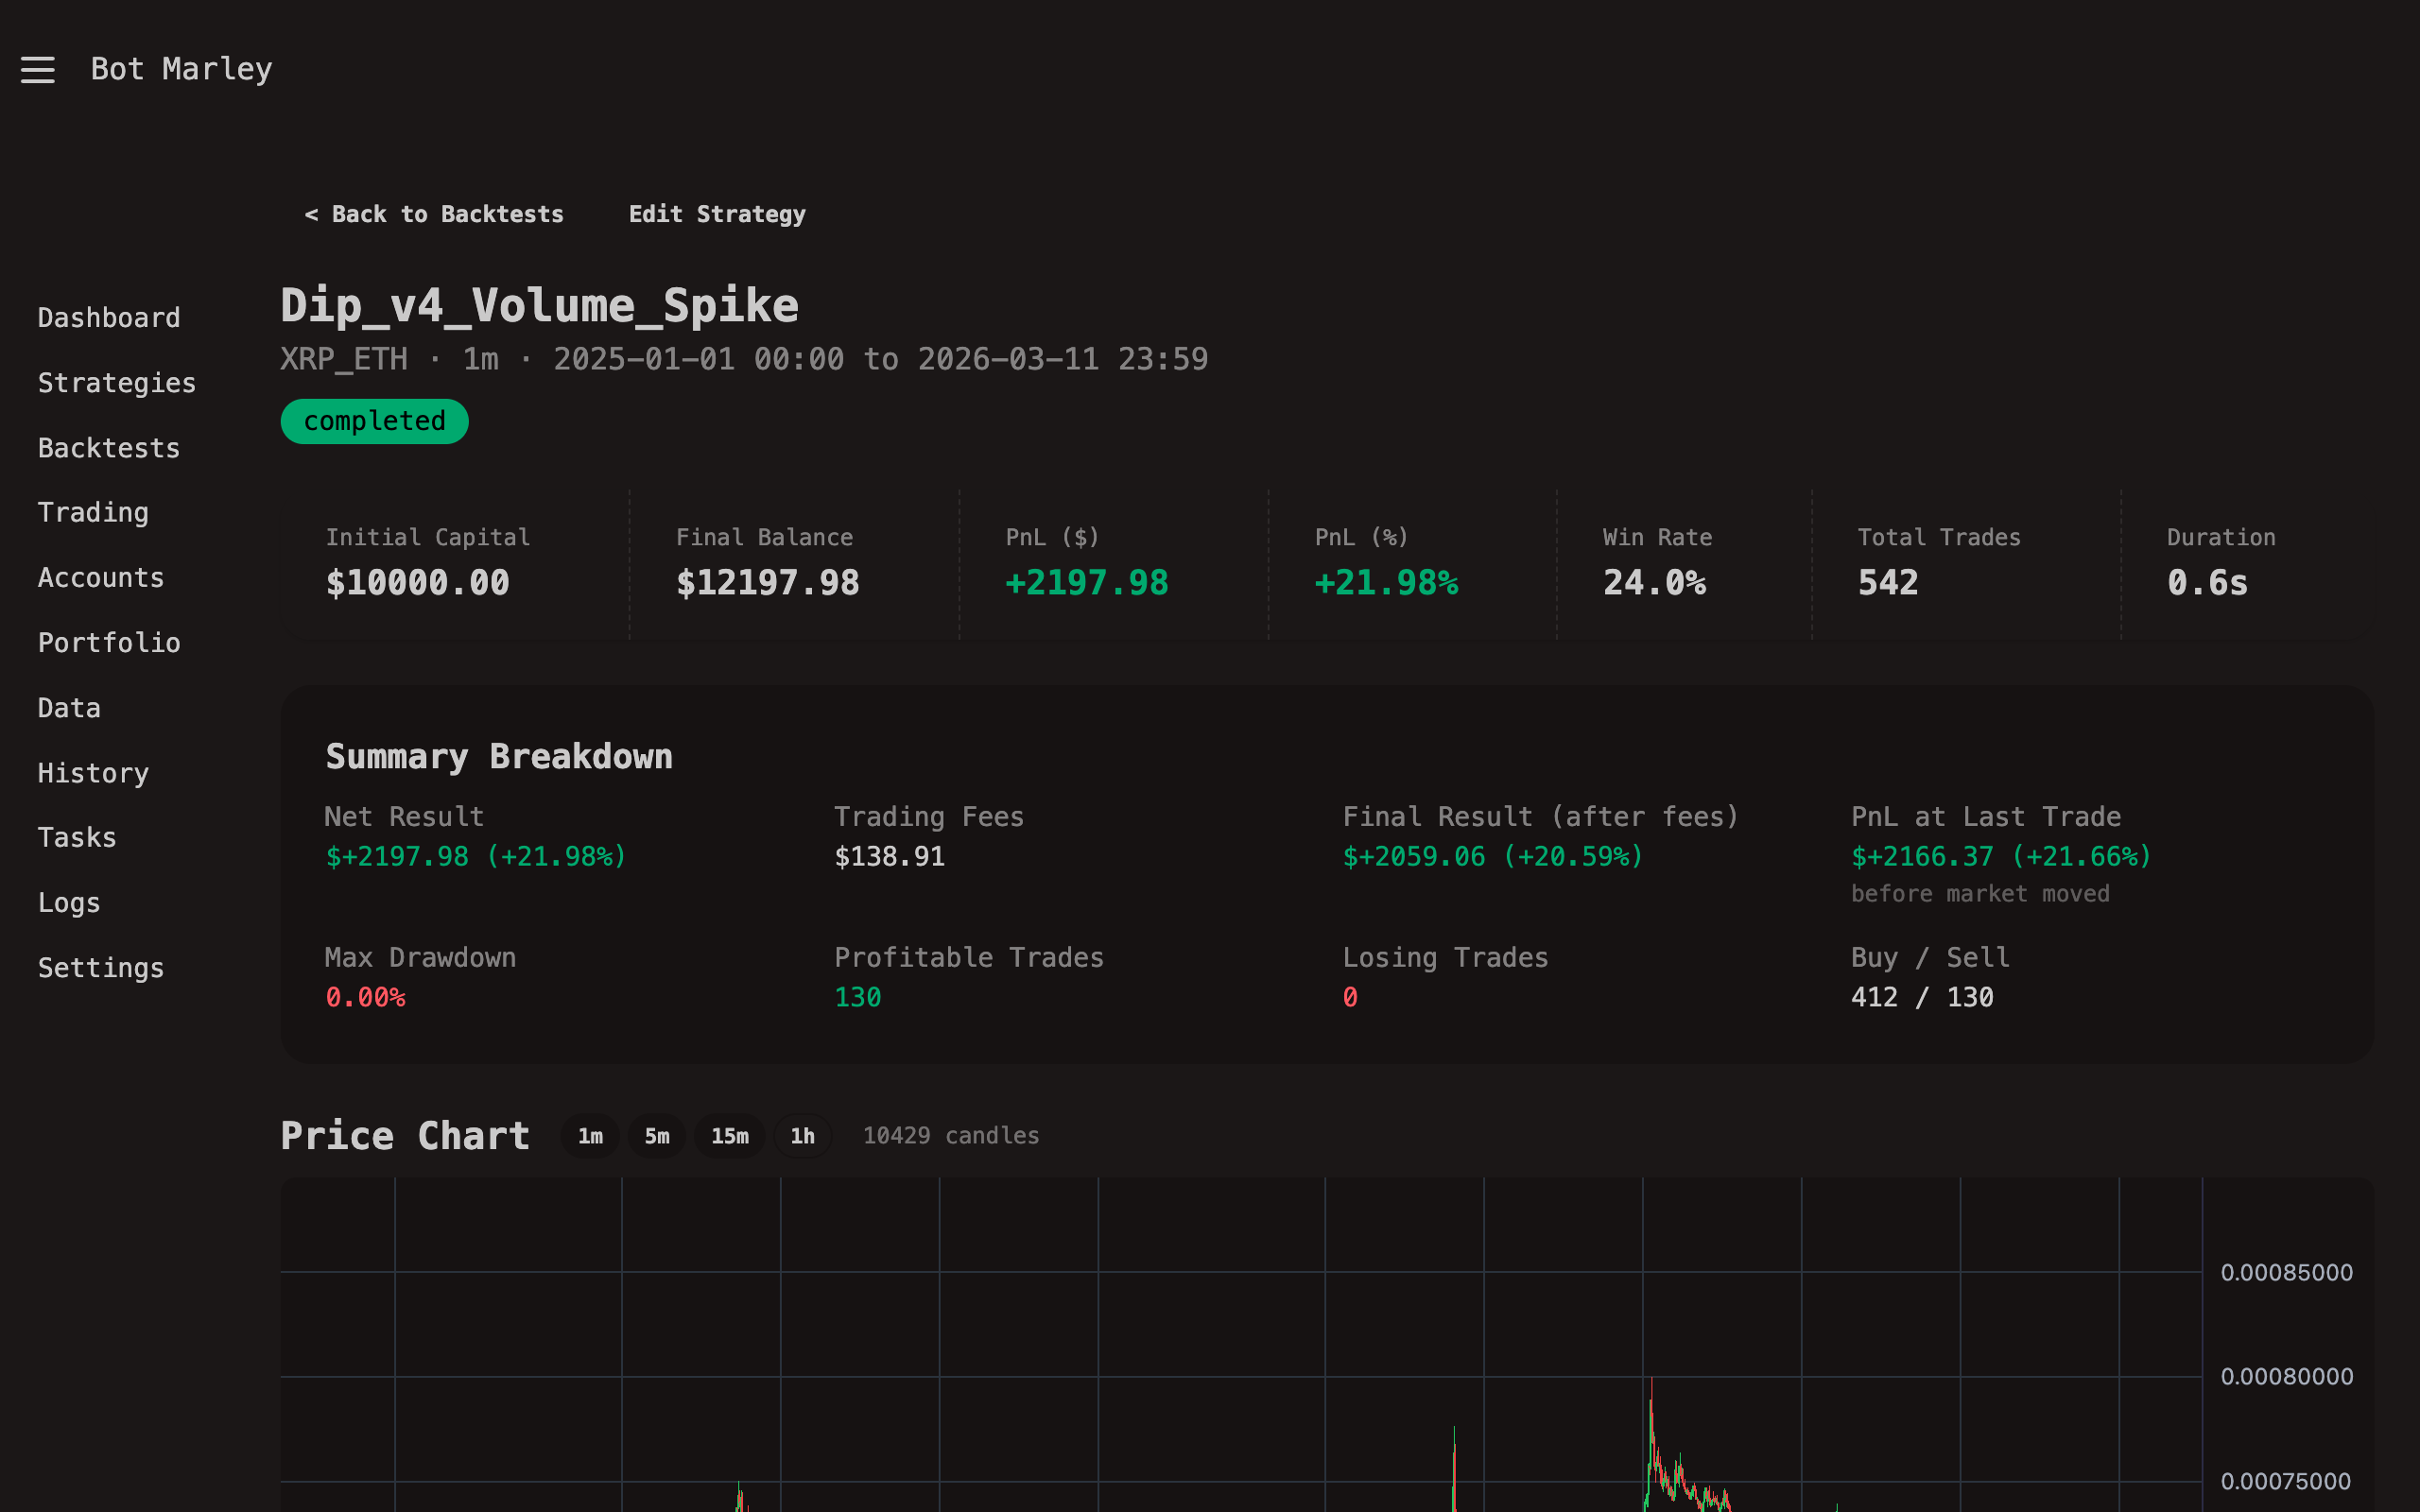
Summary Statistics
At the top of the results page, you will find a grid of key metrics. Here is what each one means:
| Metric | What it tells you |
|---|---|
| Net Result (USD) | The raw profit or loss: final portfolio value minus initial capital. This is calculated before fees. |
| Net Result (%) | Net result as a percentage of your initial capital. +15% means your portfolio grew by 15%. |
| Trading Fees (USD) | Total simulated fees across all executed trades (0.1% per trade). |
| Final Result (USD) | Net result minus trading fees. This is your true bottom line. |
| Final Result (%) | Final result as a percentage of initial capital. This is the number that matters most. |
| PnL at Last Trade | Portfolio value at the moment of the last executed trade, minus initial capital. Useful when the strategy ends with an open position -- the final result includes unrealized gains/losses from the last candle's close price, but PnL at last trade shows where you stood at the last actual trade. |
| Total Trades | Number of executed trade actions (buys + sells). |
| Profitable Trades | Trades where the realized PnL was positive (sell price > buy price). |
| Losing Trades | Trades where the realized PnL was negative. |
| Win Rate (%) | Percentage of profitable trades out of total trades. |
| Max Drawdown (%) | The largest peak-to-trough decline in portfolio value during the backtest. A drawdown of 12% means at some point your portfolio dropped 12% from its highest point. |
| Sharpe Ratio | A measure of risk-adjusted return. Higher is better. Values above 1.0 are generally considered good; above 2.0 is excellent. |
| Duration | How long the backtest engine took to run (in milliseconds). |
Max Drawdown and Sharpe Ratio are planned for a future release and may show as 0 or "N/A" in the current version.
How to Read These Numbers
- Positive Final Result means the strategy was profitable over the test period.
- Negative Final Result means it lost money.
- Win Rate alone does not tell the whole story. A strategy with a 30% win rate can still be very profitable if the average winning trade is much larger than the average losing trade.
- Net Result vs. Final Result: The gap between these two is your fee burden. If the difference is large relative to your profit, the strategy might be trading too frequently.
Price Chart
The price chart displays candlesticks for the backtest period with trade markers overlaid:
- Green upward arrows mark buy actions (open long and additional buys).
- Red downward arrows mark sell actions.
- Hovering over a marker shows the trade details (price, amount, trigger).
Timeframe Switching
By default, the chart aggregates candles to a readable timeframe. You can switch between:
| Timeframe | Candle duration | Best for |
|---|---|---|
| 1m | 1 minute | Short backtests (hours to a day), seeing exact entry/exit points |
| 5m | 5 minutes | Multi-day backtests, good balance of detail and overview |
| 15m | 15 minutes | Week-long backtests |
| 1h | 1 hour | Month-long backtests, big-picture view |
When you switch timeframes, the candles are re-aggregated and trade markers are snapped to the nearest candle. The underlying data does not change -- only the visual grouping.
Indicator Overlays
If your strategy uses technical indicators (RSI, SMA, Bollinger Bands, etc.), you can toggle them on and off using the indicator panel. Indicators are pre-computed and included in the chart data, so toggling is instant -- no server round-trip required.
- Price overlays (SMA, EMA, Bollinger Bands) render as lines on the main price chart.
- Separate pane indicators (RSI) render in a dedicated panel below the price chart.
Equity Curve
The equity curve is a line chart that plots your portfolio's total value (USD balance + crypto holdings valued at market price) at each point in time.
How to Interpret the Equity Curve
- Upward slope means the portfolio is growing.
- Downward slope means the portfolio is declining.
- Flat sections mean the strategy had no open positions (sitting in cash) or the market was moving sideways with no triggers firing.
- Sharp drops indicate significant losing trades or drawdown periods.
A healthy equity curve generally trends upward over time with manageable dips. An equity curve that rises steeply then crashes suggests the strategy was lucky during one period and then gave it all back.
Compare the equity curve to the raw price chart. If your equity curve closely mirrors the asset's price, your strategy might just be "buy and hold with extra steps." The value of a strategy is in doing better than simply holding the asset, or achieving similar returns with less risk (smaller drawdowns).
Action Log
Below the charts, you will find a table listing every trade action the strategy executed during the backtest. Each row contains:
| Column | Description |
|---|---|
| Tick | The candle index (0-based) where the action occurred. |
| Timestamp | The date and time of the candle. |
| Action | The type of action: open_long, buy, or sell. |
| Position # | Which position this action belongs to (for multi-position strategies). |
| Price | The candle close price at execution. |
| Amount (USD) | The dollar amount of the trade. |
| Amount (Crypto) | The crypto amount bought or sold. |
| Trigger | The trigger condition that caused this action (e.g., "RSI(14) < 30" or "Position price change +5%"). |
| Portfolio Balance | Total portfolio value (USD + crypto) after this action. |
| PnL (USD) | Realized profit or loss on this specific trade (for sells). Blank for buys. |
| Status | executed, skipped, or impossible. |
Action Statuses
- executed -- The action was carried out. Portfolio updated.
- skipped -- The trigger conditions were met, but the action was skipped for a reason (e.g.,
max_countreached, no open position to sell). - impossible -- The action could not execute (e.g., trying to buy with insufficient USD balance).
By default, only executed actions are shown. Enable Verbose Logging when running the backtest to also save skipped and impossible actions. This is useful for debugging why a strategy is not trading as expected.
Red Flags in Results
Not all positive results are good results. Watch out for these warning signs:
| Red flag | What it might mean |
|---|---|
| Very few trades (< 5) | The strategy triggers are too restrictive, or the date range is too short. The results may not be statistically meaningful. |
| Win rate below 30% | The strategy loses most of its trades. It can still be profitable if winners are large, but verify that the average winning trade significantly exceeds the average loser. |
| Max drawdown above 30% | The strategy has periods of severe loss. Ask yourself: could you tolerate watching your account drop by a third? |
| Final result is positive but PnL at last trade is negative | The profit came from an unrealized position at the end of the backtest (the last candle happened to be at a favorable price). This is fragile -- the price could have gone the other way. |
| Fees eat most of the profit | If trading fees are more than 20-30% of the net result, the strategy is overtrading. Consider widening trigger thresholds to trade less frequently. |
| Equity curve has a single spike | One lucky trade drove all the profit. Remove that trade mentally and ask if the strategy still makes sense. |
A backtest with zero trades is not a "safe" result -- it means your strategy never did anything. Check your trigger conditions and make sure the historical data covers a period where those conditions would actually occur.
Bulk Backtesting
When you have multiple strategies and want to find out which one performs best under the same market conditions, running them one at a time is tedious. Bulk backtesting lets you run the same configuration (pair, date range, initial capital) against multiple strategies in a single action.
What Bulk Backtesting Does
Bulk backtesting takes a list of strategies and enqueues an individual backtest task for each one, all sharing the same parameters:
- Same trading pair (e.g., BTC/USD)
- Same date range (e.g., Sept 1 to Oct 1)
- Same initial capital (e.g., $1,000)
Each strategy runs independently through the backtest engine, producing its own full result set (PnL, win rate, action log, charts). When all runs complete, you can compare them side by side on the Backtests page.
flowchart TD
A["Select strategies<br/>Strategy A, B, C"] --> B["Set shared config<br/>Pair, dates, capital"]
B --> C["Enqueue bulk task"]
C --> D["Task worker creates<br/>individual backtest tasks"]
D --> E["Strategy A<br/>backtest"]
D --> F["Strategy B<br/>backtest"]
D --> G["Strategy C<br/>backtest"]
E --> H["Results page:<br/>compare all runs"]
F --> H
G --> H
How to Run a Bulk Backtest
1. Navigate to the Strategies Page
Open the Strategies page from the sidebar. You will see a list of all saved strategies.
2. Select Multiple Strategies
Use the checkboxes next to each strategy to select the ones you want to test. You can select as many as you like.
3. Click "Bulk Backtest"
With strategies selected, click the Bulk Backtest button. A configuration form appears.
4. Configure the Shared Parameters
Fill in the same fields you would for a single backtest:
| Parameter | Description |
|---|---|
| Pair | The trading pair all strategies will be tested against. |
| Start date | Beginning of the test period. |
| End date | End of the test period. |
| Initial capital | Starting USD balance (same for all strategies). |
5. Submit
Click Start. Botmarley enqueues a BulkBacktest task, which in turn creates one BacktestRun task per selected strategy. You can monitor progress on the Tasks page.
Comparing Results
Once all backtests complete, navigate to the Backtests page. All runs from the bulk job will appear in the table. To compare effectively:
- Sort by Final Result (%) to rank strategies by profitability.
- Filter by pair if you have mixed results from different bulk runs.
- Look at win rate alongside PnL -- a high PnL with a low win rate means the strategy relies on a few big winners.
- Check total trades -- strategies with very different trade counts are hard to compare directly. A strategy with 3 trades and +10% is less reliable than one with 50 trades and +8%.
When comparing strategies, pay attention to consistency across different time periods. If Strategy A beats Strategy B on Sept data but loses on Oct data, neither has a clear edge. Run bulk backtests against multiple date ranges to build a fuller picture.
Use Cases
Strategy Selection
You have five strategy ideas. Run all five against the same 3-month period. Eliminate the ones that lose money or have unacceptable drawdowns. Shortlist the top performers for paper trading.
Parameter Optimization
Create multiple copies of the same strategy with different parameter values (e.g., RSI period 10, 14, 20). Bulk backtest all variants to find the parameter set that performs best for your target pair and timeframe.
Pair Comparison
If you want to test one strategy against multiple pairs, create the backtest runs individually (bulk backtesting uses a single pair). Then compare results across pairs on the Backtests page using the pair filter.
Bulk backtesting runs all selected strategies against the same pair. To test across multiple pairs, run separate bulk backtests for each pair.
Live Trading
Live trading is where your strategy meets the real market. Instead of replaying historical candles, Botmarley connects to your exchange (Kraken or Binance) in real time, fetches new candle data as it becomes available, evaluates your strategy triggers, and executes trades -- either simulated (Paper) or with real money (Binance account).
Live trading with a Binance account uses real money. Orders placed through the Binance API are real, irreversible market orders. Make sure you have thoroughly backtested and paper-traded your strategy before connecting it to a real exchange account. Start with small amounts.
Paper vs. Real Trading
Botmarley supports two modes of live trading, determined by which account you select when starting a session:
| Mode | Account type | Orders | Risk |
|---|---|---|---|
| Paper trading | Paper account | Simulated locally. No exchange API calls for orders. | Zero. No real money involved. |
| Real trading | Binance account | Placed on Binance via the signed REST API. | Real. Funds can be gained or lost. |
In both modes, the trading engine behaves identically: same candle fetching, same indicator calculation, same trigger evaluation, same action execution logic. The only difference is what happens when an action fires:
- Paper mode: The engine updates the simulated portfolio in memory and in the database. No exchange order is placed.
- Real mode: The engine sends a market order to Binance via the signed REST API, waits for confirmation, then updates the session state with the actual fill price and amount.
Always test a new strategy in Paper mode first. Run it for at least a few days to confirm it behaves as expected with live market data before switching to a real Binance account.
How the Trading Engine Works
The live trading engine runs as an async background task for each active session. Here is the cycle it repeats:
flowchart TD
A["Wait for poll interval<br/>(default: 60 seconds)"] --> B["Fetch latest candle(s)<br/>from Exchange REST API"]
B --> C["Append to candle buffer<br/>(rolling window of 500)"]
C --> D["Rebuild indicator cache<br/>(RSI, SMA, MACD, etc.)"]
D --> E{"Evaluate strategy<br/>triggers"}
E -- "Trigger fired" --> F["Execute action<br/>(Paper or Binance order)"]
E -- "No match" --> G["Update progress store<br/>(price, PnL, candle count)"]
F --> G
G --> H{"Check control<br/>channel"}
H -- "Continue" --> A
H -- "Pause" --> I["Enter paused state<br/>(wait for resume/stop)"]
H -- "Stop" --> J["Graceful shutdown<br/>(save state to DB)"]
Poll Interval
The engine fetches new candles at a configurable interval, defaulting to 60 seconds. This aligns with 1-minute candle data from the exchange. Each poll:
- Requests the latest OHLCV candle(s) from the exchange REST API (Kraken or Binance, based on the account type).
- Deduplicates against the existing buffer (avoids processing the same candle twice).
- Appends new candles to a rolling buffer (capped at 500 candles to manage memory).
Candle Buffer and Indicators
The engine maintains a rolling buffer of the most recent candles. After appending new data, it rebuilds the indicator cache. This ensures that indicators like RSI(14) or SMA(50) always have enough historical context to produce accurate values.
Trigger Evaluation
The engine uses the exact same evaluation code as the backtest engine. This means:
- Technical indicator triggers (RSI < 30, SMA crossover, etc.) work identically.
- Price change triggers, position-based triggers, and trailing stops all behave the same.
- Multi-position logic,
max_countlimits, and all other strategy features apply.
Order Execution
When a trigger fires:
- Paper account: Portfolio balances are updated in memory. The action is recorded in the database with status "executed."
- Binance account: A spot market order is sent to Binance via the signed REST API. The engine records the exchange's fill price and amount. If the order fails (insufficient balance, API error, etc.), the action is recorded with status "order_failed."
The Full Flow
Putting it all together, here is the complete data flow from market to database:
flowchart LR
Exchange["Exchange API<br/>(Kraken or Binance)"] -->|"REST: fetch candles"| Engine["Trading Engine"]
Engine -->|"Calculate"| Indicators["Indicator Cache<br/>(RSI, SMA, BB, MACD)"]
Indicators -->|"Evaluate"| Triggers["Strategy Triggers"]
Triggers -->|"Fire"| Execute["Execute Action"]
Execute -->|"Paper: update locally"| DB["PostgreSQL<br/>(session state)"]
Execute -->|"Binance: place order"| Exchange
Engine -->|"SSE events"| Browser["Your Browser<br/>(live updates)"]
Key Concepts
- Session. A single run of a strategy against a pair using a specific account. Each session has its own state: balance, PnL, action history, candle count.
- Progress store. An in-memory map of session progress, updated every poll cycle. The UI reads from this via SSE for real-time updates.
- Control channel. Each session has a
tokio::sync::watchchannel that the server uses to send pause, resume, and stop commands. The engine checks this channel after every poll cycle. - Strategy snapshot. When a session starts, the current strategy TOML is copied and stored with the session. This means editing the strategy later does not affect running sessions.
Trading Sessions
A trading session is a single run of a strategy. It begins when you click Start, runs continuously until you stop it (or it encounters an error), and maintains its own isolated state throughout its lifetime. This chapter covers every session lifecycle action: starting, pausing, resuming, stopping, and deleting.
Starting a Session
Step 1: Go to the Trading Page
Navigate to Trading in the sidebar. You will see a list of all sessions (active and stopped) and a form to start a new one.
Step 2: Select a Strategy
Choose the strategy you want to run from the dropdown. Only saved strategies appear here. If you need to create or edit a strategy first, visit the Strategy Editor.
Step 3: Select a Trading Pair
Choose the pair you want to trade, such as BTC/USD or ETH/USD. The available pairs are configured in Settings.
Step 4: Select an Account
Choose the account that the session will trade through:
- Paper account -- simulated trading, no real orders. Ideal for testing.
- Exchange account (Kraken or Binance) -- real exchange trading. Real order execution is currently supported for Binance accounts only. Orders are placed on Binance with real money.
Selecting a Binance account means the bot will place real orders with real funds. Make sure you have tested the strategy thoroughly in Paper mode first. (Kraken accounts support candle fetching and data sync, but real order execution is Binance only.)
Step 5: Set Initial Capital
Enter the starting USD balance for this session. For Paper accounts, this creates a simulated balance. For exchange accounts, this sets the budget the strategy will work with (it does not transfer funds -- your exchange account must already have sufficient balance).
Step 6: Start
Click Start. Botmarley will:
- Validate that the strategy, pair, and account exist.
- Take a snapshot of the current strategy TOML (so future edits do not affect this session).
- Enqueue a
TradingStarttask in the task queue. - The task worker spawns the trading engine as a background async task.
- The engine loads its initial candle buffer and begins polling for new data.
The session will appear in the session list with status Running.
Session Lifecycle
A trading session moves through a defined set of states:
stateDiagram-v2
[*] --> Running: Start
Running --> Paused: Pause
Paused --> Running: Resume
Running --> Stopped: Stop
Paused --> Stopped: Stop
Running --> Failed: Error
Running --> Running: Server restart (auto-recovery)
Paused --> Running: Server restart (auto-recovery)
Pausing a Session
Clicking Pause on a running session sends a pause command to the engine via its control channel. The engine:
- Finishes processing the current poll cycle (does not interrupt mid-evaluation).
- Enters a paused state -- it stops fetching new candles and evaluating triggers.
- Keeps the session state intact in memory and the database.
- Records a "paused" event in the session event log.
While paused:
- No new candles are fetched. The market continues to move, but the engine is not watching.
- No triggers are evaluated. Even if conditions are met, no trades execute.
- Existing positions remain open. Pausing does not close positions.
- The session appears as "Paused" in the UI with a Resume button.
Pausing is useful when you want to temporarily stop a strategy without losing its state -- for example, during scheduled exchange maintenance, before a major news event, or while you review recent trades.
Resuming a Session
Clicking Resume on a paused session sends a resume command. The engine:
- Exits the paused state.
- Fetches any candles that were produced while paused (backfills the gap).
- Resumes normal polling and trigger evaluation.
- Records a "resumed" event in the session event log.
The session continues exactly where it left off, with all positions, balances, and counters intact.
Stopping a Session
Clicking Stop sends a stop command. The engine performs a graceful shutdown:
- Finishes the current poll cycle.
- Saves the final session state to the database (balance, PnL, candle count, portfolio snapshot).
- Records a "stopped" event in the session event log.
- Exits the background task.
The session is marked as Stopped in the database. Stopped sessions cannot be resumed -- they are finished. Their data (action log, charts, PnL history) remains available for review on the session detail page.
Stopping a session does not close open positions. If you have open positions on an exchange account, you will need to manage them manually on the exchange after stopping the session.
Stop All
The Stop All button on the Trading page sends a stop command to every active (running or paused) session simultaneously. This is an emergency measure for situations where you want to halt all automated trading immediately.
Each session receives the stop command independently and performs the same graceful shutdown described above.
Deleting a Session
Deleting a session removes it from the database entirely:
- The session record is deleted.
- All associated trade actions are deleted.
- All session events are deleted.
This action is permanent and cannot be undone.
Deletion is irreversible. If you want to keep the session data for reference, stop the session instead of deleting it. Stopped sessions remain visible in the session list.
Only stopped or failed sessions can be deleted. You cannot delete a running or paused session -- stop it first.
Summary of Actions
| Action | What it does | Reversible? |
|---|---|---|
| Start | Creates a new session and begins trading | No (but you can stop it) |
| Pause | Temporarily halts evaluation; state preserved | Yes (resume) |
| Resume | Continues a paused session from where it left off | N/A |
| Stop | Gracefully ends the session permanently | No |
| Stop All | Stops all active sessions at once | No |
| Delete | Removes session and all its data from the database | No |
Monitoring
Once a trading session is running, Botmarley provides a real-time monitoring dashboard on the session detail page. This chapter explains every element of that page and how to use it effectively.
Accessing the Session Detail Page
Click on any session in the Trading session list to open its detail page. The URL follows the pattern:
http://localhost:3000/trading/session/{session-id}
The page updates automatically -- you do not need to refresh.
Real-Time Data via SSE
Botmarley uses Server-Sent Events (SSE) to push live updates from the server to your browser. When you open a session detail page, your browser establishes a persistent connection to the SSE endpoint:
/sse/trading/{session-id}
Through this connection, the server sends updates whenever the engine processes a new candle, executes a trade, or changes status. The UI components on the page listen for these events and update themselves instantly via HTMX partial swaps.
This means:
- No polling delays. You see changes within a second of them happening on the server.
- No manual refresh needed. The page stays current as long as you have it open.
- Low bandwidth. SSE sends only the data that changed, not the entire page.
Monitoring Elements
Current Price
The session displays the latest candle close price for the trading pair. This updates every poll cycle (default: every 60 seconds when a new candle arrives).
Balance and PnL
| Field | Description |
|---|---|
| Current Balance | Total portfolio value in USD (cash + crypto holdings valued at current price). |
| PnL (USD) | Absolute profit or loss: current balance minus initial capital. |
| PnL (%) | PnL as a percentage of initial capital. |
These values update after every candle is processed. During volatile markets, you will see them change with each tick.
Candles Processed
A counter showing how many candles the engine has evaluated since the session started. This gives you a sense of how long the session has been active and confirms that the engine is receiving data from the exchange.
Open Positions
Displays the number of currently open positions and their details:
- Position number (e.g., #1, #2 for multi-position strategies)
- Entry price -- the average price at which the position was opened
- Current value -- the position's value at the current market price
- Unrealized PnL -- how much the position would gain or lose if sold now
Trade Action History
A table of all executed trade actions for this session, ordered newest first. Each row shows:
| Column | Description |
|---|---|
| Time | When the action occurred. |
| Action | Type: open_long, buy, or sell. |
| Price | The execution price. |
| Amount | USD and crypto amounts. |
| Trigger | Which trigger condition caused the action. |
| PnL | Realized profit/loss (for sells). |
New actions appear at the top of the table automatically via SSE.
Strategy Trigger Status
Shows the current state of each trigger in your strategy:
- Whether the trigger condition is currently met or not.
- For technical indicators: the current indicator value (e.g., RSI = 42.3).
- For price-based triggers: how close the current price is to the trigger threshold.
This helps you understand what the strategy is "thinking" right now and anticipate when the next trade might fire.
Session Controls
At the top of the page, you will find buttons to control the session:
- Pause -- temporarily stop evaluation (available when running).
- Resume -- continue from pause (available when paused).
- Stop -- permanently end the session.
See Trading Sessions for details on each action.
Live Candlestick Chart
The session detail page includes an interactive candlestick chart powered by Lightweight Charts. The chart displays:
- Candlesticks showing OHLCV data for the session's trading pair.
- Buy markers (green arrows) at the exact candles where buy actions executed.
- Sell markers (red arrows) at sell action candles.
- Indicator overlays if the strategy uses technical indicators (togglable).
The chart updates in real time as new candles arrive. You can:
- Zoom in and out with the scroll wheel.
- Pan by clicking and dragging.
- Switch timeframes between 1m, 5m, 15m, and 1h for different levels of detail.
The 5-minute view is a good default for monitoring. It gives enough detail to see individual trades while keeping the chart readable over longer periods.
Tips for Monitoring During Volatile Markets
Volatile markets (high price swings, rapid moves) are when your strategy is most likely to trigger actions. Here are some practical tips:
-
Keep the session page open. SSE updates ensure you see trades the moment they happen. If you close the page and come back later, you might miss critical context about why a trade fired.
-
Watch the trigger status panel. During high volatility, indicators like RSI can swing rapidly between overbought and oversold zones. The trigger status panel shows you in real time how close the strategy is to firing.
-
Check open positions. If your strategy opens positions during a volatile period, monitor unrealized PnL closely. A position that is +5% can swing to -5% quickly.
-
Do not panic-stop. If the strategy is executing trades during a volatile period, that is what it is designed to do. Stopping the session mid-volatility may leave you with an unfavorable open position. If you are uncomfortable, pause the session instead -- this preserves state and lets you resume later.
-
Review the action log after the event. Once volatility subsides, scroll through the action history to understand what the strategy did and why. This is valuable feedback for refining triggers.
If you are running multiple sessions simultaneously, each one has its own SSE stream and monitoring page. You can open multiple browser tabs to monitor several sessions at once.
What Gets Persisted
Not everything you see on the monitoring page is stored permanently. Here is the breakdown:
| Data | Stored in DB? | Notes |
|---|---|---|
| Trade actions | Yes | Full action log with all details |
| Session state (balance, PnL, status) | Yes | Updated periodically |
| Session events (start, pause, resume, stop) | Yes | Timestamped audit trail |
| Candle buffer | No | In-memory only; refetched on restart |
| Indicator cache | No | Rebuilt from candle buffer each cycle |
| Progress store (current price, live PnL) | No | In-memory; reconstructed from DB on restart |
This means if the server restarts, you will not lose any trade history or session state, but the live monitoring data (current price, indicator values) will take one poll cycle to repopulate. See Session Recovery for details.
Session Recovery
Servers restart. Power goes out, operating systems update, processes crash. When Botmarley runs trading sessions that manage real money (or paper money you care about tracking), it needs to handle restarts gracefully. This chapter explains what happens when the server goes down and comes back up.
Automatic Recovery
When the Botmarley server starts, one of the first things it does is check the database for trading sessions that were active at the time of the last shutdown. Specifically, it looks for sessions with a status of Running or Paused.
For each session it finds, the server:
- Logs a
server_restartevent in the session's event history. This creates an audit trail so you can see exactly when gaps occurred. - Parses the strategy TOML snapshot stored when the session was originally started.
- Creates a new control channel (the mechanism used to send pause/resume/stop commands).
- Restores the portfolio state from the last saved snapshot in the database (positions, balances, fire counts).
- Spawns a new trading engine task that picks up where the previous one left off.
The entire process is automatic. You do not need to manually restart sessions after a server restart.
flowchart TD
A["Server starts"] --> B["Query DB for sessions<br/>with status Running or Paused"]
B --> C{"Sessions found?"}
C -- No --> D["Nothing to recover<br/>Normal startup continues"]
C -- Yes --> E["For each session:"]
E --> F["Log server_restart event"]
F --> G["Parse strategy TOML<br/>from stored snapshot"]
G --> H["Restore portfolio state<br/>from DB snapshot"]
H --> I["Spawn trading engine<br/>async task"]
I --> J["Engine backfills missed<br/>candles from exchange"]
J --> K["Normal operation resumes"]
Recovery is fully automatic. If your server restarts unexpectedly, just wait for it to come back up. Your trading sessions will resume on their own within seconds of the server starting.
What Gets Recovered
| Component | Recovery method |
|---|---|
| Session status | Read from database. Both "running" and "paused" sessions are recovered. Paused sessions resume as running. |
| Strategy rules | Parsed from the TOML snapshot stored at session creation time. This means the strategy used is the one that was active when the session started, not the current version of the strategy file. |
| Portfolio state | Deserialized from the last_portfolio_snapshot JSON field in the database. This includes USD balance, crypto balances, open positions, entry prices, and action fire counts. |
| Trade action history | Loaded from the database. All previously executed actions are intact. |
| Session events | All previous events (started, paused, resumed) remain in the database, plus the new server_restart event. |
| Counters | total_actions and candles_processed are restored from the database, preventing duplicate counting. |
What Does Not Recover
| Component | What happens instead |
|---|---|
| Candle buffer | The in-memory rolling buffer of recent candles is lost on shutdown. On recovery, the engine rebuilds it by fetching historical candles from the exchange API (Kraken or Binance, based on the account type) -- typically the last 12-24 hours of 1-minute data. This usually takes a few seconds. |
| Indicator cache | Rebuilt automatically from the refetched candle buffer. No data loss -- indicators are always recalculated from raw candle data. |
| Progress store | The in-memory progress map (current price, live PnL display) is empty on restart. It repopulates after the first poll cycle. |
| SSE connections | Browser SSE connections are dropped when the server stops. Browsers will automatically reconnect when the server comes back up. You may see a brief "connection lost" state in the UI. |
The Gap Period
Between the server stopping and restarting, the engine is not running. During this gap:
- No candles are fetched. The market continues to move, but Botmarley is not watching.
- No triggers are evaluated. Trading opportunities may be missed.
- Open positions remain open. If you have positions on the exchange, they persist on the exchange regardless of whether Botmarley is running.
When the engine resumes, it backfills missed candles from the exchange API. This means it fetches the candles that were produced during the downtime, appends them to the buffer, and processes them. However, the backfilled candles are processed in bulk -- triggers that might have fired at specific moments during the gap may not fire in the same way when processed after the fact.
For short gaps (a few minutes), the impact is negligible. For longer gaps (hours), you may miss trading signals that occurred during the downtime. The server_restart event in the session log tells you exactly when the gap happened, so you can review the price action during that period manually.
The server_restart Event
Every recovered session gets a server_restart event recorded in its event log. This event:
- Has a timestamp of when the server restarted (not when it shut down).
- Can include metadata about the recovery process (e.g., number of candles backfilled).
- Is visible in the session detail page's event history.
You can use this event to:
- Audit gaps -- know exactly when the bot was offline.
- Correlate missed opportunities -- compare the gap period's price action with what the strategy would have done.
- Monitor stability -- frequent
server_restartevents may indicate infrastructure issues.
Edge Cases
What if the strategy TOML snapshot is invalid?
If the stored TOML snapshot cannot be parsed (e.g., due to a bug in a previous version), the session is marked as Failed instead of being recovered. An error is logged explaining the parse failure. You will need to manually create a new session with the corrected strategy.
What if the portfolio snapshot is missing or corrupt?
If the last_portfolio_snapshot field is empty or cannot be deserialized, the engine starts with a fresh portfolio using the session's initial capital. This means positions tracked in the previous run are lost. A warning is logged so you can investigate.
What about exchange orders placed just before shutdown?
If the engine sent an order to the exchange and the server crashed before recording the result, there may be a discrepancy between the exchange account's actual balance and what Botmarley thinks the balance is. After recovery, check your exchange account balance manually to confirm alignment.
If you suspect a state mismatch between Botmarley and your exchange account after a crash, stop the session, verify your exchange balance, and start a new session. Do not continue trading with potentially incorrect state.
Market Data Overview
Market data is the foundation of everything Botmarley does. Every backtest, every live trading session, and every chart you view depends on accurate, well-organized historical price data. This chapter explains what market data is, how Botmarley stores it, and how data flows through the system.
What Is Market Data?
Market data in Botmarley means OHLCV candles -- structured snapshots of price activity over a fixed time period. Each candle captures five values:
| Field | Meaning | Example |
|---|---|---|
| Open | The price at the start of the period | 67,250.00 |
| High | The highest price during the period | 67,410.50 |
| Low | The lowest price during the period | 67,180.00 |
| Close | The price at the end of the period | 67,390.25 |
| Volume | The total amount traded during the period | 42.37 BTC |
A single candle tells you a story: where the price started, how far it moved in each direction, and where it ended up. Thousands of candles together reveal trends, patterns, and opportunities that strategies can exploit.
Botmarley always fetches and stores 1-minute candles as the base resolution. Larger timeframes (5m, 15m, 1h) are derived automatically by aggregating the 1-minute data. This means you only need to download once, and all timeframes are available immediately.
How Botmarley Stores Data
Botmarley stores candle data in Apache Arrow format -- a columnar, binary file format designed for high-performance analytics. Each trading pair gets its own directory with .arrow files inside.
~/.botmarley/data/
├── XBTUSD/
│ └── 1m.arrow ← all 1-minute candles for BTC/USD
├── ETHUSD/
│ └── 1m.arrow
├── SOLUSD/
│ └── 1m.arrow
└── ...
Why Apache Arrow?
You might wonder why Botmarley does not just use CSV or JSON files like many other tools. The answer comes down to performance and efficiency:
| Property | Arrow | CSV | JSON |
|---|---|---|---|
| Read speed | Extremely fast (memory-mapped) | Slow (must parse every line) | Slowest (must parse structure) |
| File size | Compact binary | Medium (text) | Large (text + keys) |
| Type safety | Columns are typed (f64, i64, timestamp) | Everything is a string | Mixed types |
| Column access | Read only the columns you need | Must read entire rows | Must read entire objects |
| Ideal for | Time-series data, analytics | Simple data exchange | API responses |
Arrow's columnar layout means that when Botmarley needs to calculate an indicator like EMA (which only requires the "close" column), it can read just that column without touching open, high, low, or volume data. For a dataset with millions of candles, this makes a significant difference.
You never need to interact with Arrow files directly. Botmarley handles reading and writing through the web interface and its internal engine. The files are mentioned here so you understand what is on disk and why.
Data Flow
Here is how market data moves through the system, from the exchange to your screen:
flowchart LR
Exchange["Exchange REST API<br/>(Kraken or Binance)"] -->|"Fetch 1m candles"| Download["History Sync<br/>(Task Queue)"]
Download -->|"Write .arrow"| Disk["Arrow Files<br/>~/.botmarley/data/"]
Disk -->|"Read"| Backtest["Backtest Engine"]
Disk -->|"Read"| Browser["Data Browser<br/>& Chart Viewer"]
Disk -->|"Read"| Indicators["Indicator<br/>Calculator"]
Disk -->|"Seed history"| Live["Live Trading<br/>Engine"]
Exchange -->|"WebSocket feed"| Live
style Exchange fill:#5865f2,color:#fff
style Disk fill:#f59e0b,color:#fff
- Fetch -- The History Sync page lets you download candles from either Kraken's or Binance's REST API. Botmarley fetches 1-minute candles going as far back as you configure.
- Store -- Downloaded candles are written to
.arrowfiles on disk, organized by trading pair. - Use -- Stored data is consumed by multiple parts of the system:
- Backtest engine reads Arrow files to simulate strategy execution against historical prices.
- Data browser renders candles in tables and interactive charts.
- Indicator calculator reads price data and computes technical indicators.
- Live trading engine loads recent history from Arrow files as a starting seed, then switches to a WebSocket feed for real-time data.
Data Freshness
When you download history for a pair, Botmarley records the last timestamp stored. The next time you sync that pair, it resumes from where it left off -- no duplicate downloads, no gaps. This incremental approach means:
- First sync may take a while (months of 1-minute candles add up).
- Subsequent syncs are fast -- only new candles since the last sync are fetched.
Botmarley does not automatically keep historical data up to date. You need to trigger a History Sync manually or set it up before running a backtest on recent data. Live trading sessions handle their own real-time data via WebSocket and do not depend on Arrow files being current.
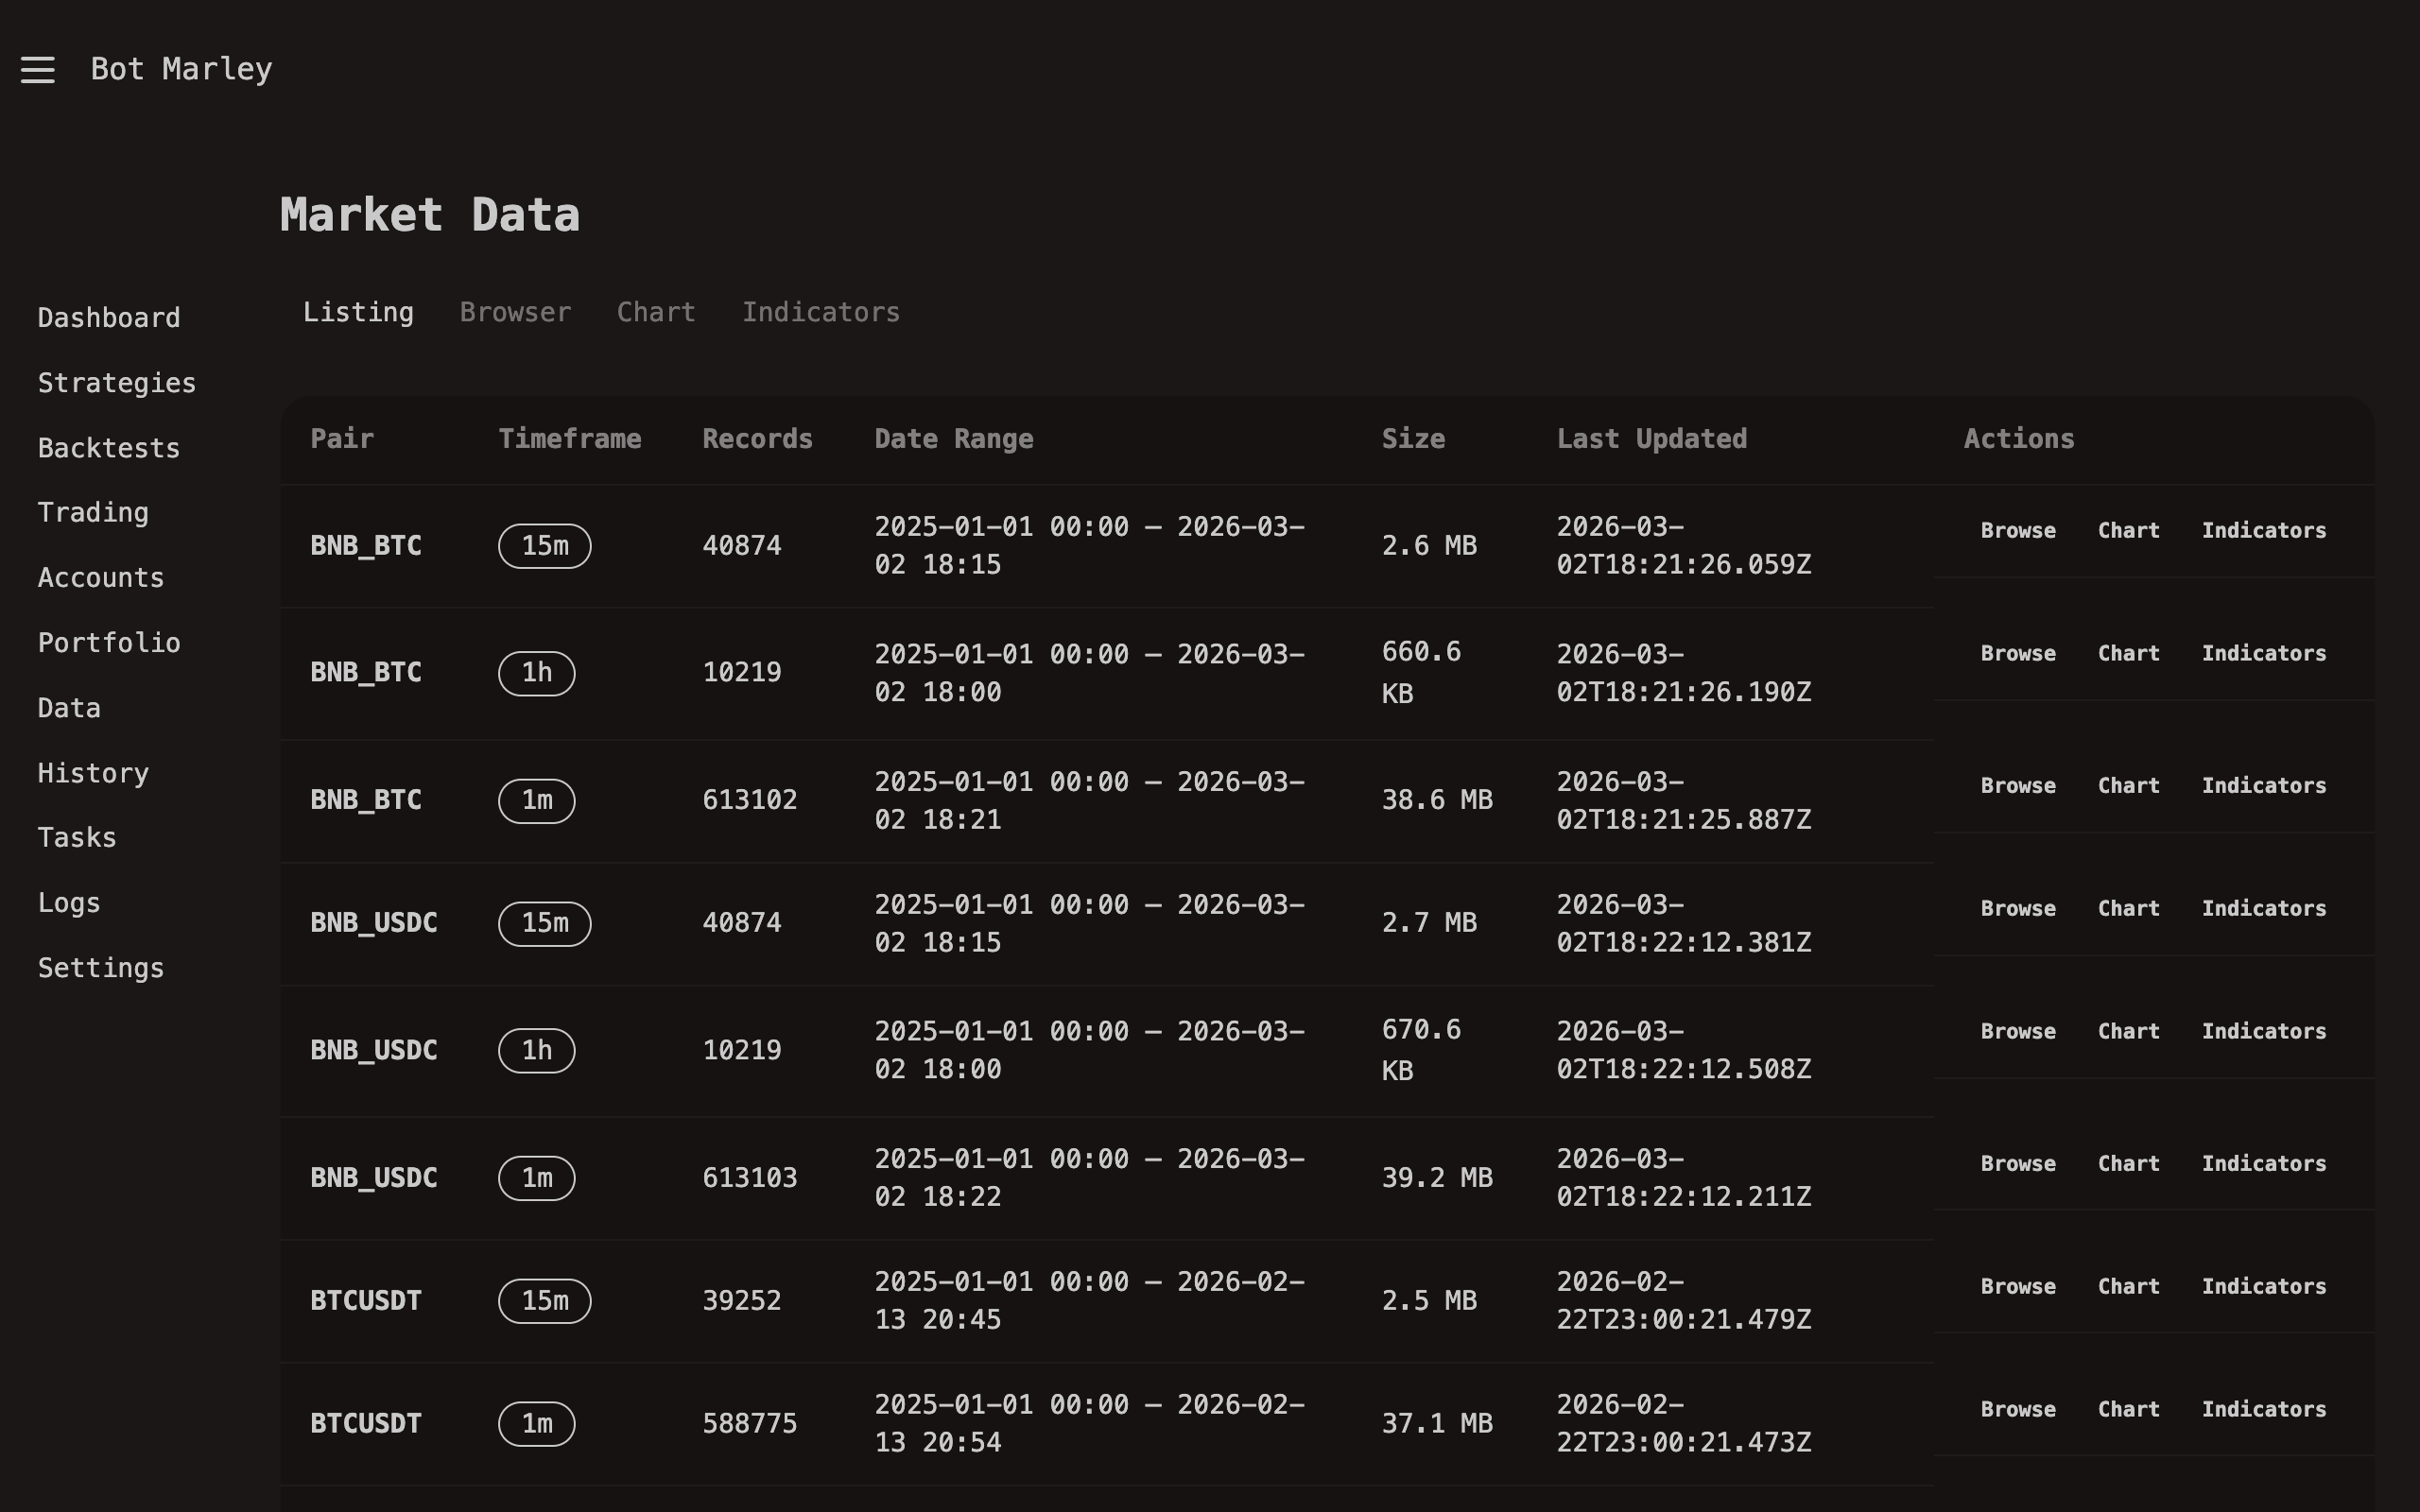
What's Next
- Downloading History -- how to fetch candle data from Kraken or Binance.
- Data Browser -- view and chart your stored data.
- Indicator Calculator -- run technical indicators on your data.
Downloading History
Before you can backtest a strategy or browse historical charts, you need candle data on disk. The History Sync page lets you download 1-minute candles from Kraken or Binance and store them as Arrow files.
The History Page
Navigate to /history in the sidebar. This page shows:
- A list of trading pairs available for download.
- The current sync status for each pair (last synced timestamp, number of candles stored).
- A Sync button to start downloading.
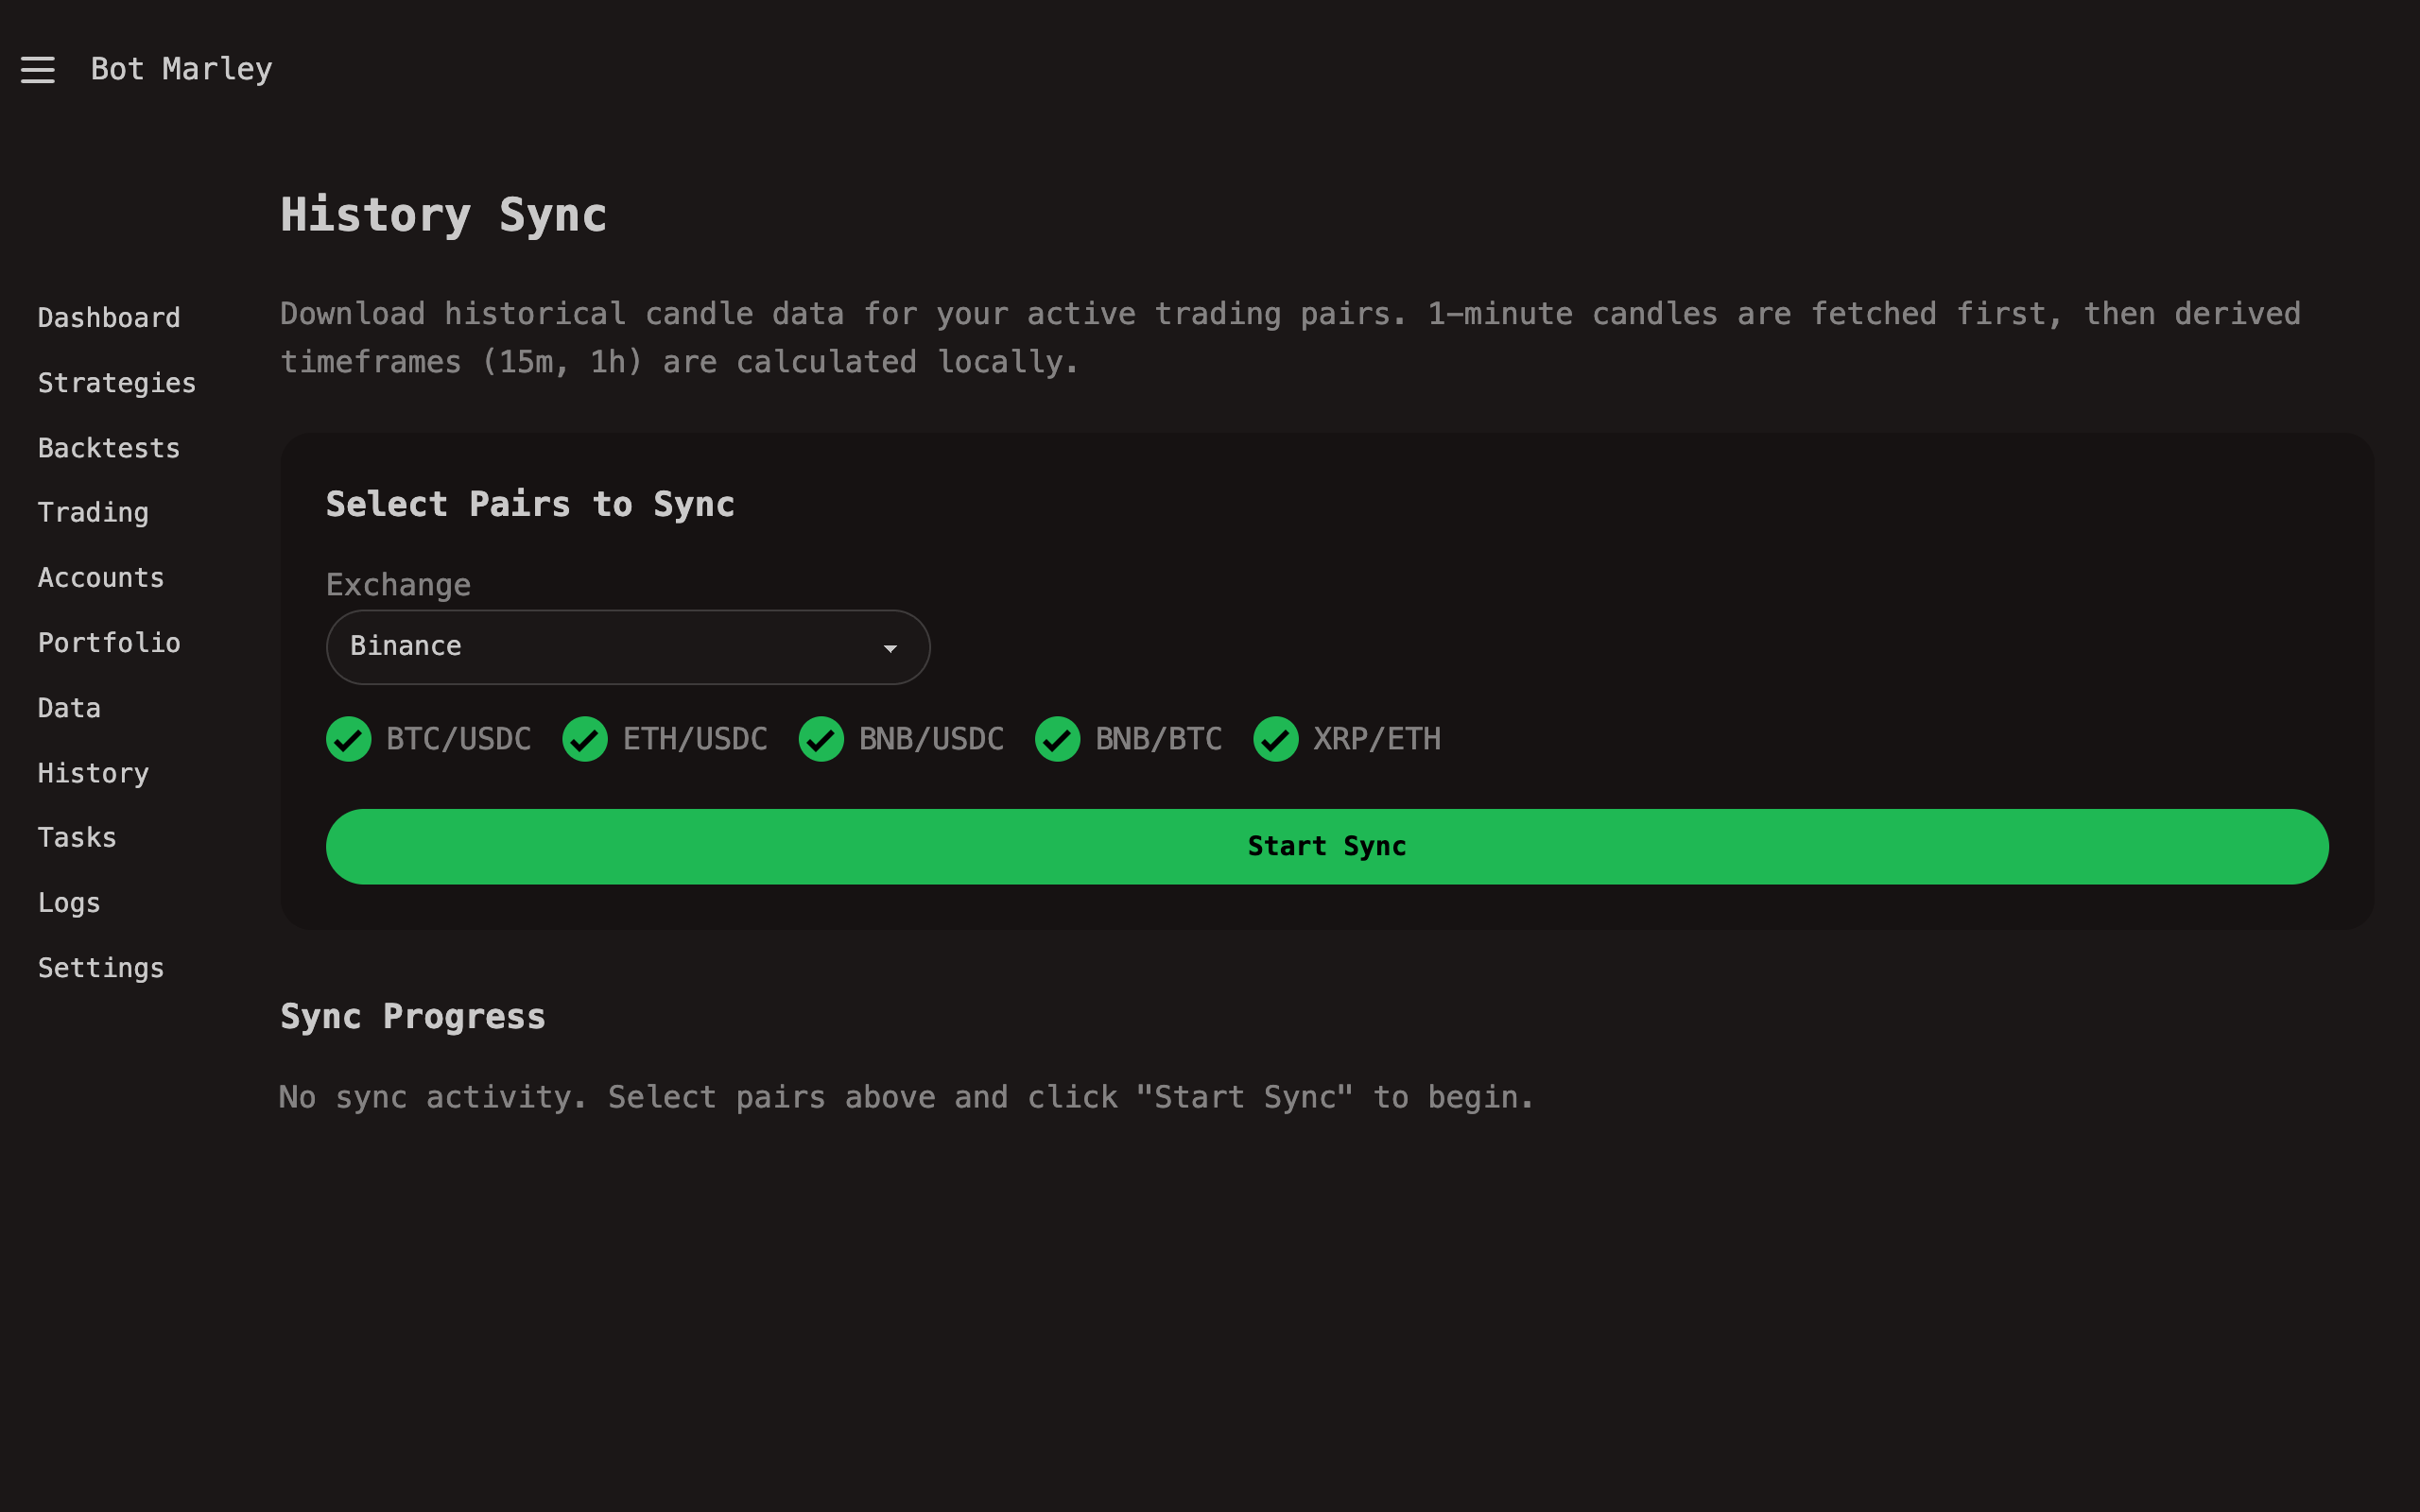
Step by Step: Downloading Candle Data
1. Select the Exchange
At the top of the History page, choose which exchange to fetch data from using the exchange radio buttons:
- Kraken -- uses the Kraken REST API (
/0/public/OHLC). Returns up to 720 candles per request. - Binance -- uses the Binance REST API (
/api/v3/klines). Returns up to 1000 candles per request.
2. Select Trading Pairs
Choose which pairs you want to download data for. Note that each exchange uses its own pair naming convention:
| Exchange | Pair | Description |
|---|---|---|
| Kraken | XBTUSD | Bitcoin / US Dollar |
| Kraken | ETHUSD | Ethereum / US Dollar |
| Kraken | SOLUSD | Solana / US Dollar |
| Kraken | XBTEUR | Bitcoin / Euro |
| Binance | BTCUSDC | Bitcoin / USDC |
| Binance | ETHUSDC | Ethereum / USDC |
| Binance | SOLUSDC | Solana / USDC |
| Binance | BTCUSDT | Bitcoin / Tether |
Only download pairs you actually plan to trade or backtest. Each pair consumes disk space and sync time. You can always add more pairs later.
Botmarley converts the user-friendly pair format internally. For example, "BTC/USD" becomes "XXBTZUSD" for Kraken and "BTC/USDC" becomes "BTCUSDC" for Binance. The History page handles this conversion automatically.
3. Click Sync
Click the Sync button next to a pair. This creates a HistorySync task in the Task Queue and begins downloading in the background.
4. Monitor Progress
The sync runs as a background task. You can monitor it in two ways:
- History page -- the status updates with a progress indicator showing how many candles have been fetched so far.
- Tasks page (
/tasks) -- the HistorySync task shows its current state (Pending, Running, Completed, or Failed).
The page auto-refreshes, so you do not need to manually reload.
What Gets Downloaded
Botmarley fetches 1-minute candles from the selected exchange's REST API. For Kraken, each API call returns up to 720 candles (12 hours of 1-minute data). For Binance, each call returns up to 1000 candles (roughly 16.5 hours). For a full history going back several months, Botmarley makes many sequential requests, paging backward through time.
Derived Timeframes
Once 1-minute data is on disk, Botmarley can compute larger timeframes automatically by aggregating the base candles:
| Derived Timeframe | How It Is Built |
|---|---|
| 5m | Every 5 consecutive 1m candles are merged |
| 15m | Every 15 consecutive 1m candles are merged |
| 1h | Every 60 consecutive 1m candles are merged |
flowchart LR
A["1m candles<br/>(stored on disk)"] --> B["5m<br/>(aggregated)"]
A --> C["15m<br/>(aggregated)"]
A --> D["1h<br/>(aggregated)"]
style A fill:#5865f2,color:#fff
The aggregation computes each derived candle as follows:
- Open = open of the first 1m candle in the group.
- High = maximum high across all 1m candles in the group.
- Low = minimum low across all 1m candles in the group.
- Close = close of the last 1m candle in the group.
- Volume = sum of volumes across all 1m candles in the group.
Derived timeframes are computed on the fly when needed -- they are not stored as separate files. This keeps storage requirements low while still supporting multi-timeframe strategies and analysis.
Storage Location
Downloaded candle data is stored in your Botmarley data directory:
~/.botmarley/data/
├── XBTUSD/
│ └── 1m.arrow
├── ETHUSD/
│ └── 1m.arrow
└── ...
The default base path is ~/.botmarley/data/. You can change this in Settings under the Data section.
Setting a Custom Start Date
By default, Botmarley downloads as much history as the exchange provides (which can go back several years for major pairs). If you want to limit the download to a specific date range:
- Go to Settings (
/settings). - Under Data Settings, find the History Start Date field.
- Enter the earliest date you want data for (e.g.,
2024-01-01). - Save settings.
The next time you run a History Sync, Botmarley will only fetch candles from that date onward. Candles already downloaded before that date are not deleted -- they remain on disk.
Incremental Downloads
Botmarley tracks the latest candle timestamp for each pair. When you click Sync again:
- If data exists on disk, only candles after the last stored timestamp are fetched.
- If no data exists, a full download starts from the configured start date (or from the earliest available on the exchange).
This makes subsequent syncs fast -- typically just a few seconds to catch up to the present.
Tips for Effective Data Management
Download at least 90 days of data for any pair you plan to backtest. Most indicators need a warm-up period (e.g., a 200-period EMA needs at least 200 candles before producing meaningful values), and short data ranges can lead to misleading backtest results.
Both Kraken and Binance rate-limit API requests. If you are downloading data for many pairs simultaneously, some sync tasks may take longer or temporarily pause while respecting rate limits. Botmarley handles this automatically -- just let the tasks run.
- Disk space: 1-minute candles for one year of a major pair like XBTUSD or BTCUSDC typically use around 50-100 MB in Arrow format. This is very modest by modern standards.
- Network: First syncs for pairs with years of history may take 10-30 minutes depending on your connection and the exchange's rate limits.
- Freshness: Remember to re-sync before running backtests if you want results that include recent market activity.
Troubleshooting
| Problem | Solution |
|---|---|
| Sync task stays "Pending" | Check that the task worker is running. See Task Queue. |
| Sync fails with "Rate limit" | Wait a few minutes and retry. Both Kraken and Binance impose request limits. |
| No data for a pair | Verify the pair name matches the exchange's naming convention. Kraken uses names like XBTUSD (not BTCUSD). Binance uses names like BTCUSDC (not BTC/USDC). |
| Very slow first sync | This is normal for pairs with years of history. Let it run to completion. |
Data Browser
The Data Browser lets you explore the candle data stored on disk. You can view raw OHLCV values in a table, render interactive charts, and inspect individual candles -- all from the web interface.
Accessing the Data Browser
Navigate to /data in the sidebar. The Data Browser page presents two main controls at the top:
- Pair selector -- choose which trading pair to view (e.g., XBTUSD, ETHUSD from Kraken, or BTCUSDC, ETHUSDC from Binance).
- Timeframe selector -- choose the candle resolution (1m, 5m, 15m, 1h).
You can only browse pairs that have been downloaded. If a pair does not appear in the selector, go to Downloading History and run a History Sync first.
Interactive Chart Viewer
The chart viewer uses Lightweight Charts (the same library used by TradingView) to render a professional candlestick chart. The chart supports:
- Pan and zoom -- click and drag to pan, scroll to zoom in/out on the time axis.
- Crosshair -- hover over any candle to see its exact OHLCV values in the legend area.
- Auto-fit -- the chart automatically scales the price axis to fit visible candles.
- Time navigation -- scroll left to see older data, right for more recent data.
The chart loads candle data directly from the server and renders it in the browser using vanilla JavaScript. No external services are contacted.
Use the scroll wheel to zoom into specific time ranges. This is especially useful when looking at 1-minute candles, where the full dataset may span months of data.
Candle Table
Below the chart, a table displays the raw candle data for the selected pair and timeframe. Each row represents one candle:
| Column | Description |
|---|---|
| Timestamp | The start time of the candle (UTC) |
| Open | Price at the start of the period |
| High | Highest price during the period |
| Low | Lowest price during the period |
| Close | Price at the end of the period |
| Volume | Total traded volume during the period |
The table is sorted by timestamp in descending order (newest first), so the most recent candles appear at the top.
Switching Timeframes
When you switch from one timeframe to another (e.g., from 1m to 1h), the chart and table reload with the new data. Remember that all timeframes larger than 1m are derived from the stored 1-minute candles:
flowchart LR
Store["1m.arrow on disk"] --> Derive["Server aggregation"]
Derive --> TF5["5m candles"]
Derive --> TF15["15m candles"]
Derive --> TF60["1h candles"]
TF5 --> Render["Chart + Table"]
TF15 --> Render
TF60 --> Render
style Store fill:#f59e0b,color:#fff
style Render fill:#22c55e,color:#fff
Switching timeframes does not require a new download -- the server reads the 1-minute Arrow file and computes the requested timeframe on the fly.
Practical Uses
The Data Browser is useful for several tasks:
- Visual verification after downloading history -- confirm that the data looks correct, with no obvious gaps or anomalies.
- Manual chart analysis -- look at price patterns, support/resistance levels, or significant moves before building a strategy.
- Debugging strategies -- after a backtest, switch to the Data Browser to see exactly what the candles looked like during a period where the strategy made unexpected trades.
- Comparing timeframes -- look at the same time period in 1m and 1h to understand how aggregation affects candle shapes and indicator values.
Very large datasets (years of 1-minute data) may take a moment to render in the chart. If performance is sluggish, switch to a larger timeframe like 15m or 1h for a smoother experience.
Indicator Calculator
The Indicator Calculator lets you compute technical indicators on your stored candle data and visualize them overlaid on the price chart. This is useful for exploring how an indicator behaves on a specific pair and timeframe before using it in a strategy.
What It Does
The calculator takes your stored candle data, applies a technical indicator formula, and displays the resulting values both as a line on the chart and in a data table. You can experiment with different indicator types and parameters without writing any strategy code.
Using the Calculator
Step 1: Select Your Data
Choose the inputs for the calculation:
| Setting | Description | Example |
|---|---|---|
| Pair | The trading pair to analyze | XBTUSD, BTCUSDC, etc. |
| Timeframe | The candle resolution to use | 1h |
| Date range | The time window to calculate over | 2024-06-01 to 2024-09-01 |
Make sure you have downloaded data for the selected pair and date range. The calculator works on locally stored Arrow files -- it does not fetch data from the exchange.
Step 2: Choose an Indicator
Select the indicator type and configure its parameters:
| Indicator | Parameters | Description |
|---|---|---|
| SMA (Simple Moving Average) | Period (e.g., 20) | Average of the last N closing prices |
| EMA (Exponential Moving Average) | Period (e.g., 12, 26) | Weighted average giving more weight to recent prices |
| RSI (Relative Strength Index) | Period (e.g., 14) | Momentum oscillator measuring overbought/oversold conditions |
| Bollinger Bands | Period (e.g., 20), Std Dev (e.g., 2.0) | Price envelope based on standard deviations from SMA |
| MACD | Fast (12), Slow (26), Signal (9) | Trend-following momentum indicator using EMA differences |
If you are new to indicators, start with SMA(20) or EMA(20) -- they are the simplest to interpret. The line follows the price trend, smoothing out noise. When price crosses above the line, it may signal an uptrend; when it crosses below, a downtrend.
Step 3: View the Results
After clicking calculate, the results appear in two forms:
Chart Overlay
The indicator is drawn directly on the price chart (or in a separate pane below the chart for oscillators like RSI and MACD):
- SMA and EMA appear as lines overlaid on the candlestick chart.
- Bollinger Bands appear as three lines (upper band, middle SMA, lower band) with the area between them shaded.
- RSI appears in a separate pane below the price chart with horizontal reference lines at 30 and 70.
- MACD appears in a separate pane with the MACD line, signal line, and histogram bars.
Data Table
A table shows the calculated indicator values alongside the candle data:
| Timestamp | Close | SMA(20) |
|---|---|---|
| 2024-08-15 14:00 | 58,420.50 | 58,195.30 |
| 2024-08-15 15:00 | 58,510.00 | 58,210.75 |
| ... | ... | ... |
Indicators require a warm-up period before producing meaningful values. For example, SMA(20) needs at least 20 candles of data before it can output its first value. The first N-1 rows will show blank or null values for the indicator -- this is expected behavior, not a bug.
Practical Examples
Exploring EMA Crossovers
To see how a golden cross / death cross strategy might work:
- Select a pair and timeframe (e.g., XBTUSD 1h).
- Add EMA(12) -- this is the fast line.
- Add EMA(26) -- this is the slow line.
- Look for points where the fast EMA crosses above the slow EMA (potential buy signals) or below it (potential sell signals).
Finding RSI Extremes
To identify oversold and overbought zones:
- Select a pair and timeframe.
- Add RSI(14).
- Look for periods where RSI drops below 30 (oversold -- potential buy opportunity) or rises above 70 (overbought -- potential sell opportunity).
Evaluating Bollinger Band Squeezes
To spot potential breakout setups:
- Select a pair and timeframe.
- Add Bollinger Bands(20, 2.0).
- Look for periods where the bands narrow significantly (a "squeeze"), which often precedes a large price move.
The indicator calculator is a sandbox for experimentation. Use it to build intuition about how indicators respond to different market conditions before committing those indicators to a strategy TOML file.
Settings
The Settings page (/settings) lets you configure application-wide options for Botmarley.
Accessing Settings
Navigate to Settings in the sidebar or go directly to http://localhost:3000/settings.
Configuration File
Botmarley stores its settings in a TOML configuration file. The location is determined by the BOTMARLEY_HOME environment variable, defaulting to ~/.botmarley/.
The primary settings file is settings.toml inside the Botmarley home directory.
Server Settings
| Setting | Default | Description |
|---|---|---|
server.host | 127.0.0.1 | IP address to bind to |
server.port | 3000 | Port to listen on |
Server settings require a restart to take effect. They can also be overridden with HOST and PORT environment variables.
Telegram Settings
Configure Telegram bot notifications for trade alerts:
| Setting | Default | Description |
|---|---|---|
telegram.enabled | false | Enable/disable Telegram bot |
telegram.bot_token | "" | Bot token from @BotFather |
telegram.allowed_username | "" | Your Telegram username (for access control) |
See Telegram Notifications for setup instructions.
Data Settings
| Setting | Description |
|---|---|
data.directory | Path where Arrow data files are stored |
data.extra_candles | Additional timeframes to compute from 1-minute data |
Editing Settings via UI
The Settings page provides a form-based interface for editing common settings. Changes are saved to the configuration file when you click Save.
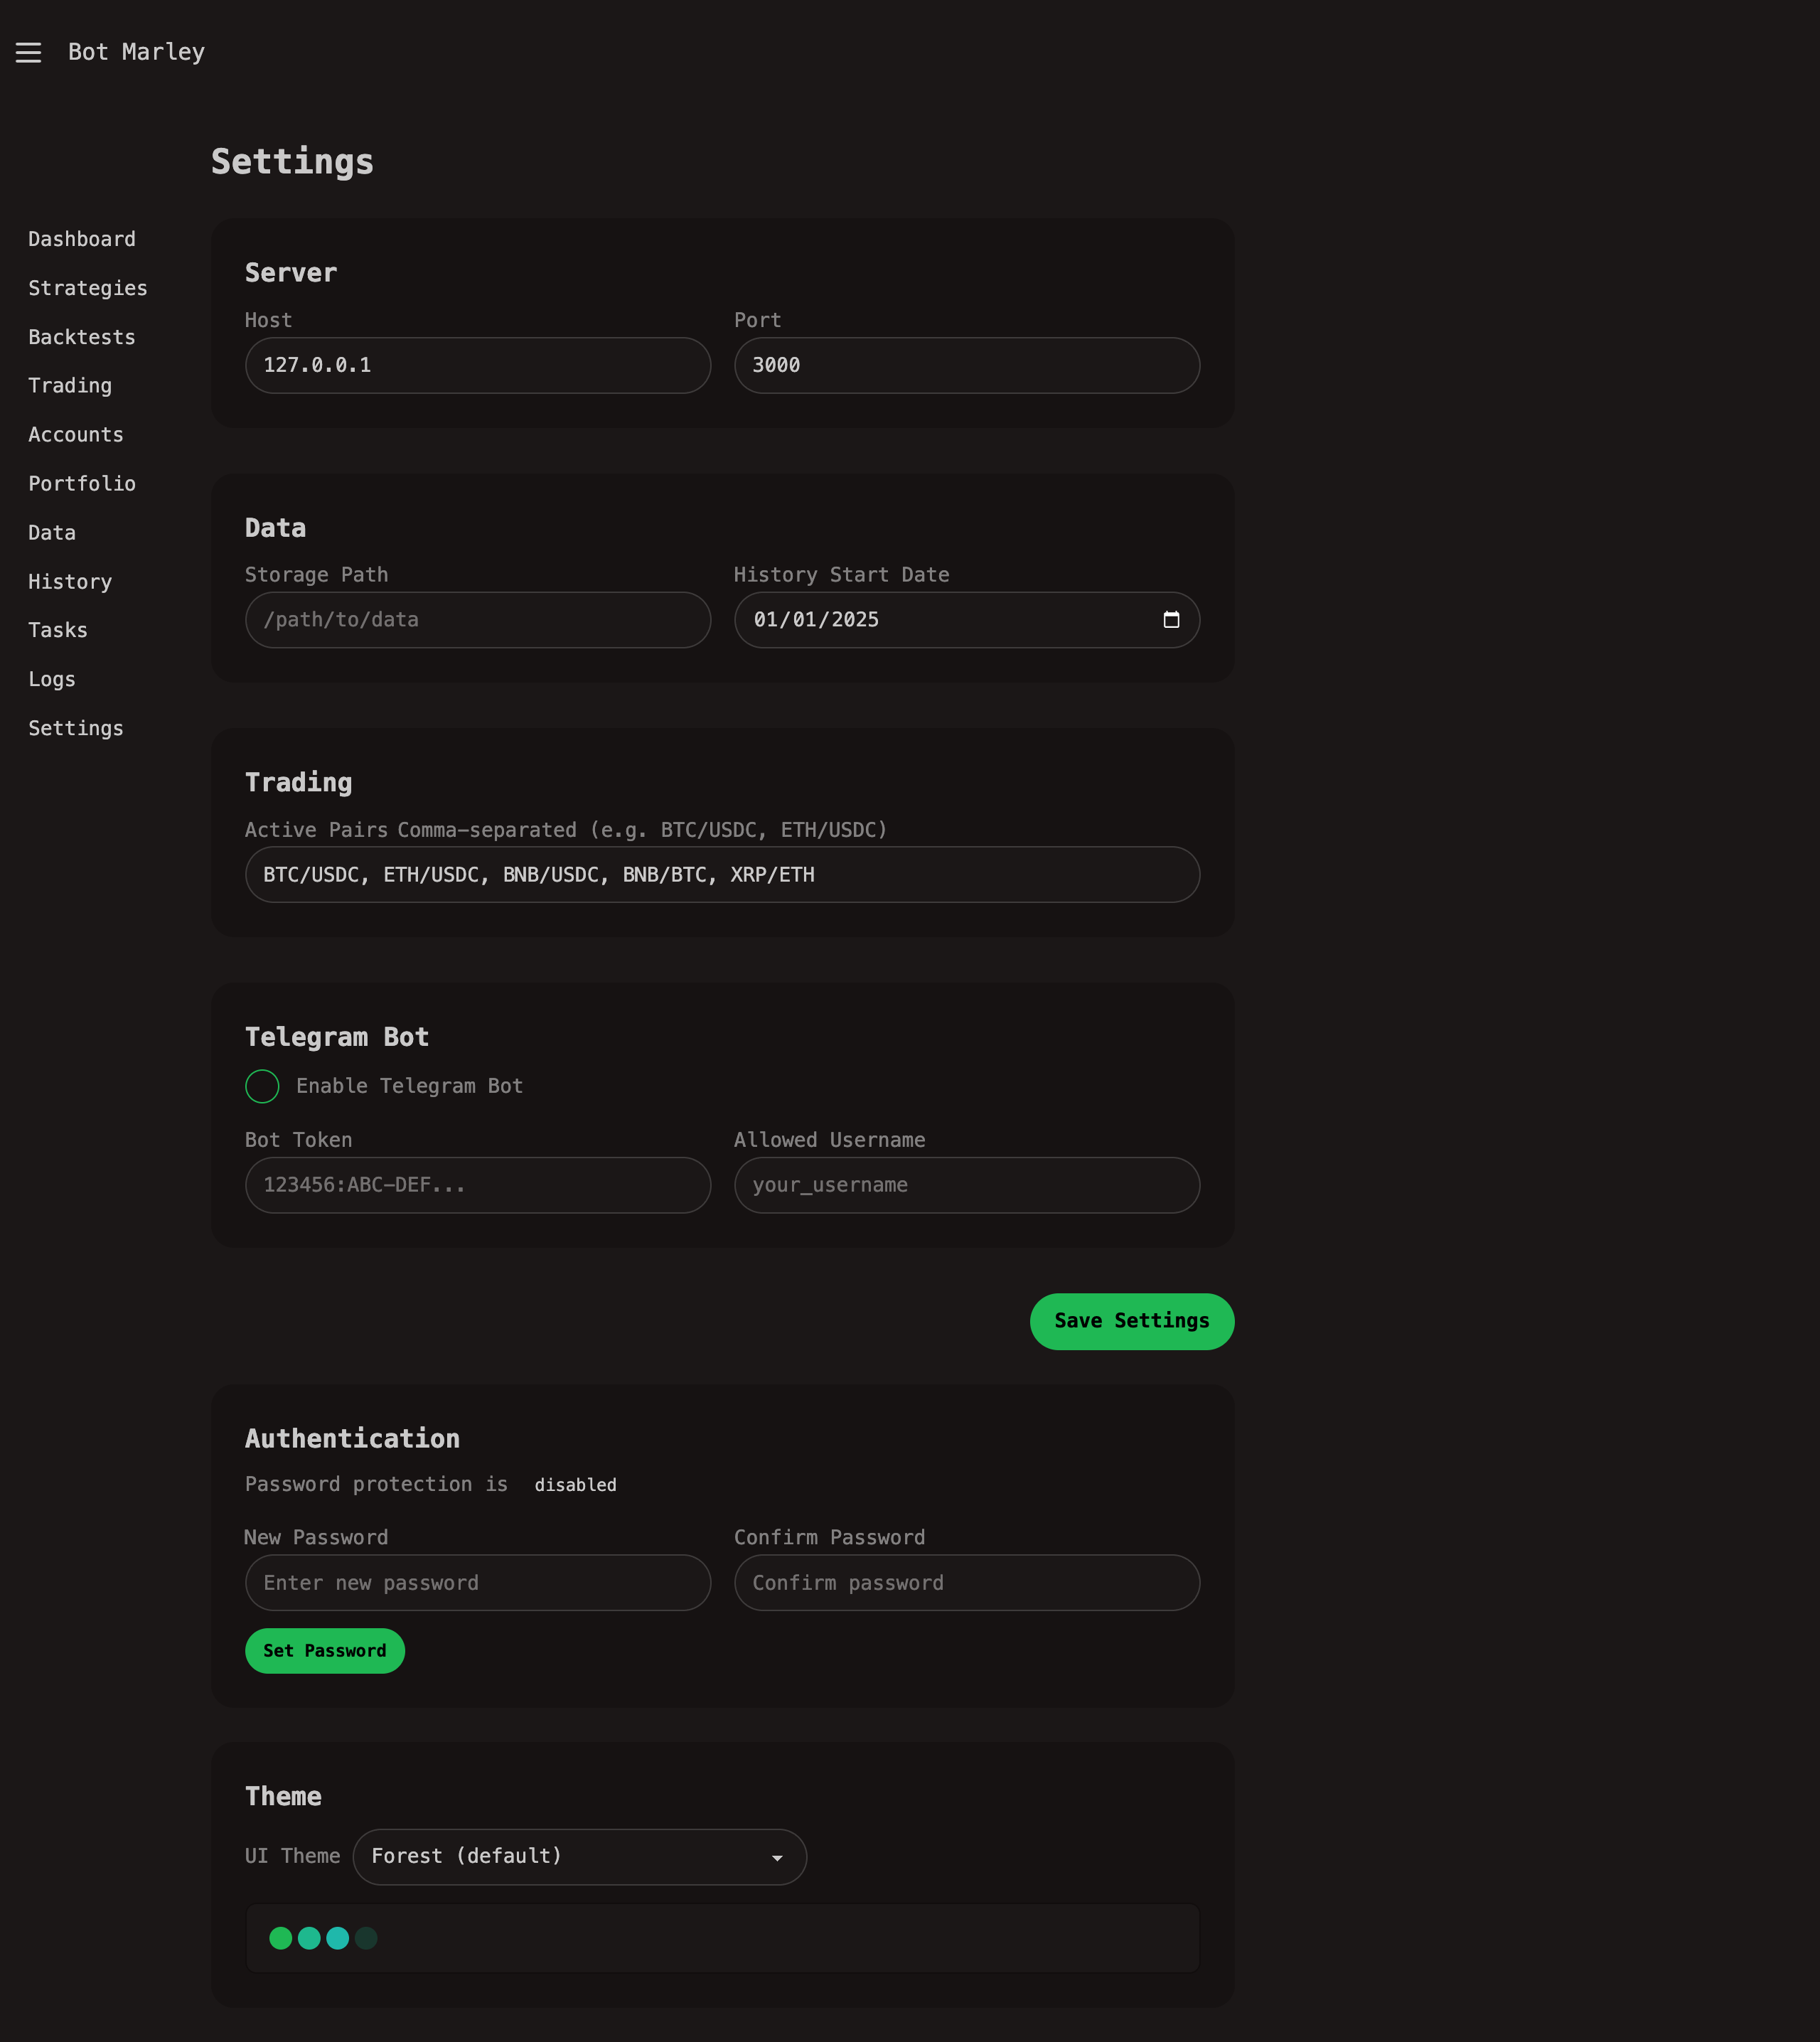
Editing Settings Manually
You can also edit settings.toml directly:
[server]
host = "0.0.0.0"
port = 3000
[telegram]
enabled = true
bot_token = "123456:ABC-DEF..."
allowed_username = "your_username"
If you edit settings manually while the server is running, you'll need to restart for changes to take effect.
Task Queue
Botmarley uses a background task queue to handle long-running operations without blocking the web interface. The Tasks page (/tasks) lets you monitor these background jobs.
How It Works
sequenceDiagram
participant U as User / Scheduler
participant Q as Task Queue (PostgreSQL)
participant W as Task Worker
participant E as Executor
U->>Q: Enqueue task
W->>Q: Poll for pending tasks
Q->>W: Return next task
W->>E: Execute task
E->>Q: Update status (completed/failed)
- Enqueue — user actions or scheduled jobs create tasks in the PostgreSQL queue
- Worker — a background worker polls for pending tasks
- Execute — the task executor runs the appropriate handler
- Complete — status is updated to
completedorfailed
Task Types
| Type | Description | Triggered By |
|---|---|---|
HistorySync | Download candle data from Kraken | User (Data page) |
Backtest | Run strategy against historical data | User (Backtest page) |
BulkBacktest | Run multiple backtests | User (Bulk backtest) |
PortfolioSync | Sync account balances and prices | Scheduler (hourly) or User |
IndicatorCalc | Calculate indicators on a dataset | User (Data page) |
Task Statuses
| Status | Meaning |
|---|---|
| Pending | Waiting in queue |
| Running | Currently being executed |
| Completed | Finished successfully |
| Failed | Encountered an error |
Task Priority
Tasks have priority levels that determine execution order:
| Priority | Used For |
|---|---|
| High | User-initiated actions (backtests, data downloads) |
| Normal | Scheduled background jobs |
| Low | Maintenance tasks |
Higher-priority tasks are picked up first by the worker.
Viewing Tasks
The Tasks page shows:
- Active tasks — currently running jobs with progress indicators
- Pending tasks — jobs waiting in the queue
- Recent completed — last finished tasks with results
- Failed tasks — jobs that encountered errors, with error details
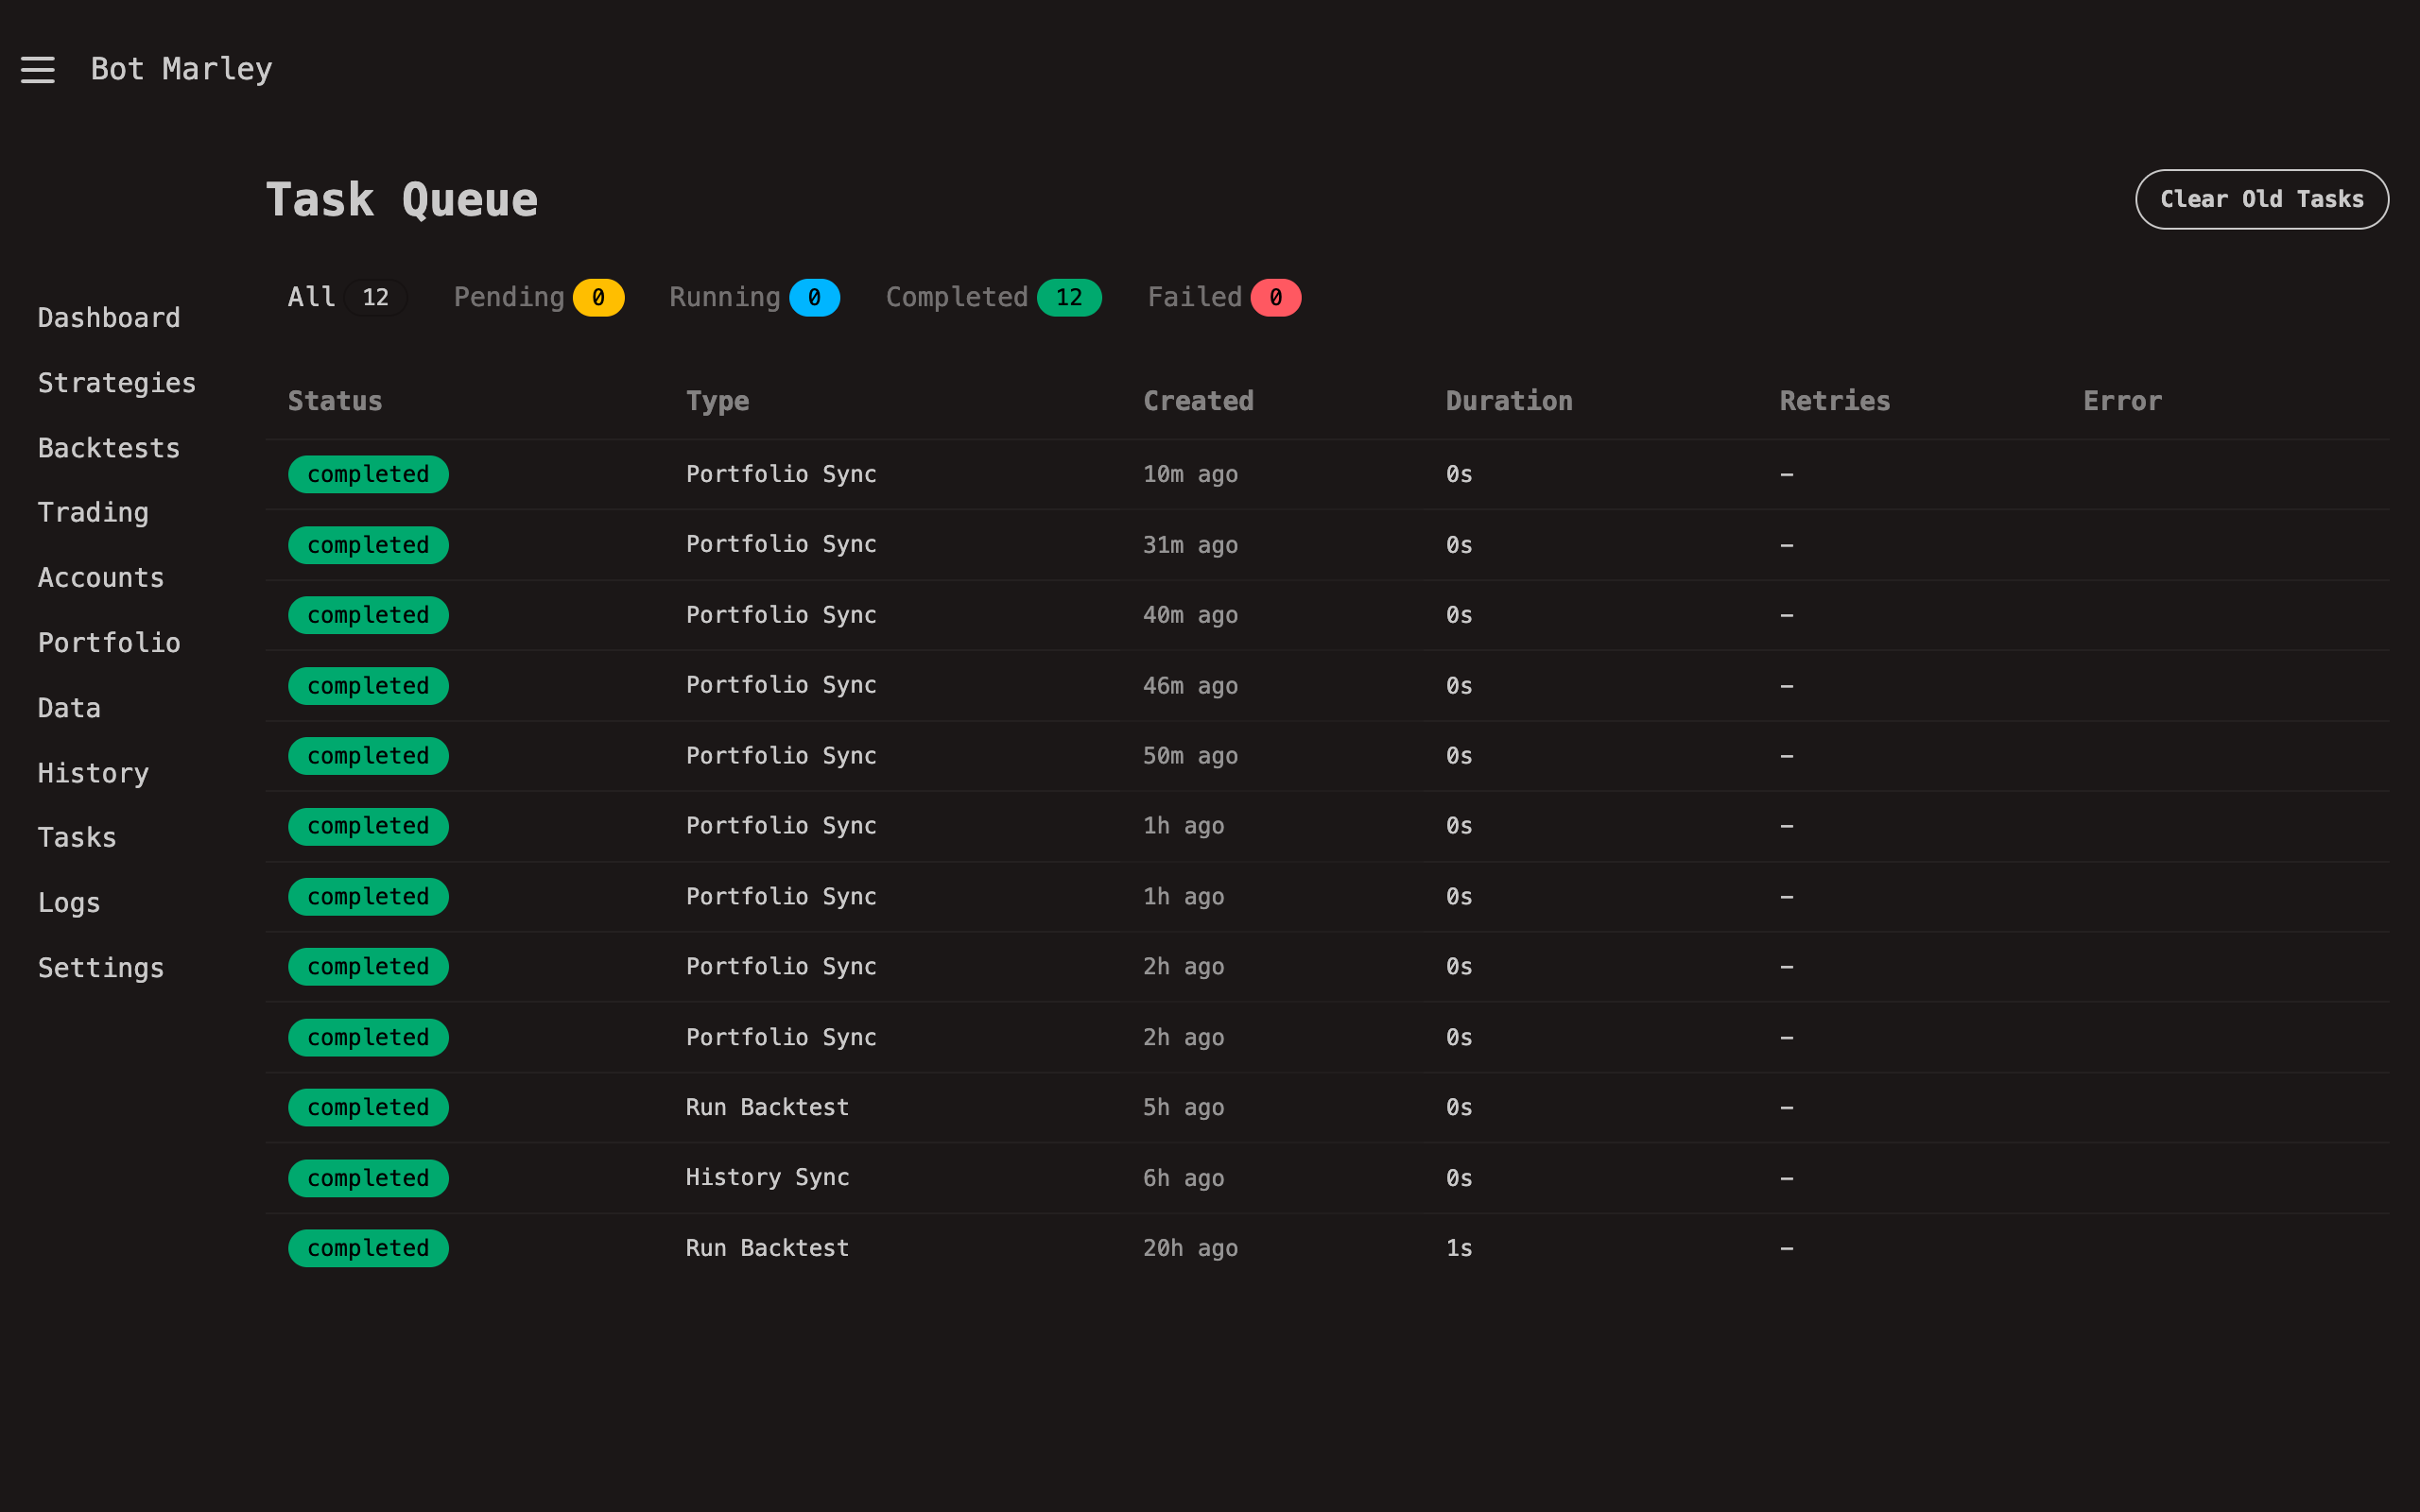
Task Recovery
If the server crashes or restarts, stale tasks (stuck in "Running" status) are automatically recovered on startup. Tasks that have been running for more than 1 hour are reset to "Pending" so the worker can retry them.
If a task is stuck, restarting the server will automatically recover it. You can also check the Activity Logs for error details.
Retry Behavior
Failed tasks are retried automatically based on their max_retries setting (typically 3 attempts). Each retry includes an exponential backoff delay.
Activity Logs
The Activity Logs page (/logs) provides a chronological record of important events across the system.
What Gets Logged
Botmarley logs significant events in the following categories:
| Category | Examples |
|---|---|
| Trading | Session started, paused, stopped; actions executed (buy/sell) |
| Backtest | Backtest started, completed, failed |
| Account | Account created, verified, balance synced |
| Portfolio | Portfolio sync triggered, completed |
| Data | History sync started, completed |
| System | Server started, task recovered, errors |
Log Levels
| Level | Color | Meaning |
|---|---|---|
| Info | Blue | Normal operations (session started, sync completed) |
| Warning | Amber | Non-critical issues (stale task recovered, API rate limit) |
| Error | Red | Failures requiring attention (API error, task failed) |
Viewing Logs
The logs page shows the most recent events with:
- Timestamp — when the event occurred
- Category — which system area generated the log
- Event — what happened
- Level — severity indicator
- Details — additional context (optional)
Filtering
You can filter logs by:
- Category — show only trading, backtest, or system events
- Level — filter by info, warning, or error
- Time range — view logs from a specific period
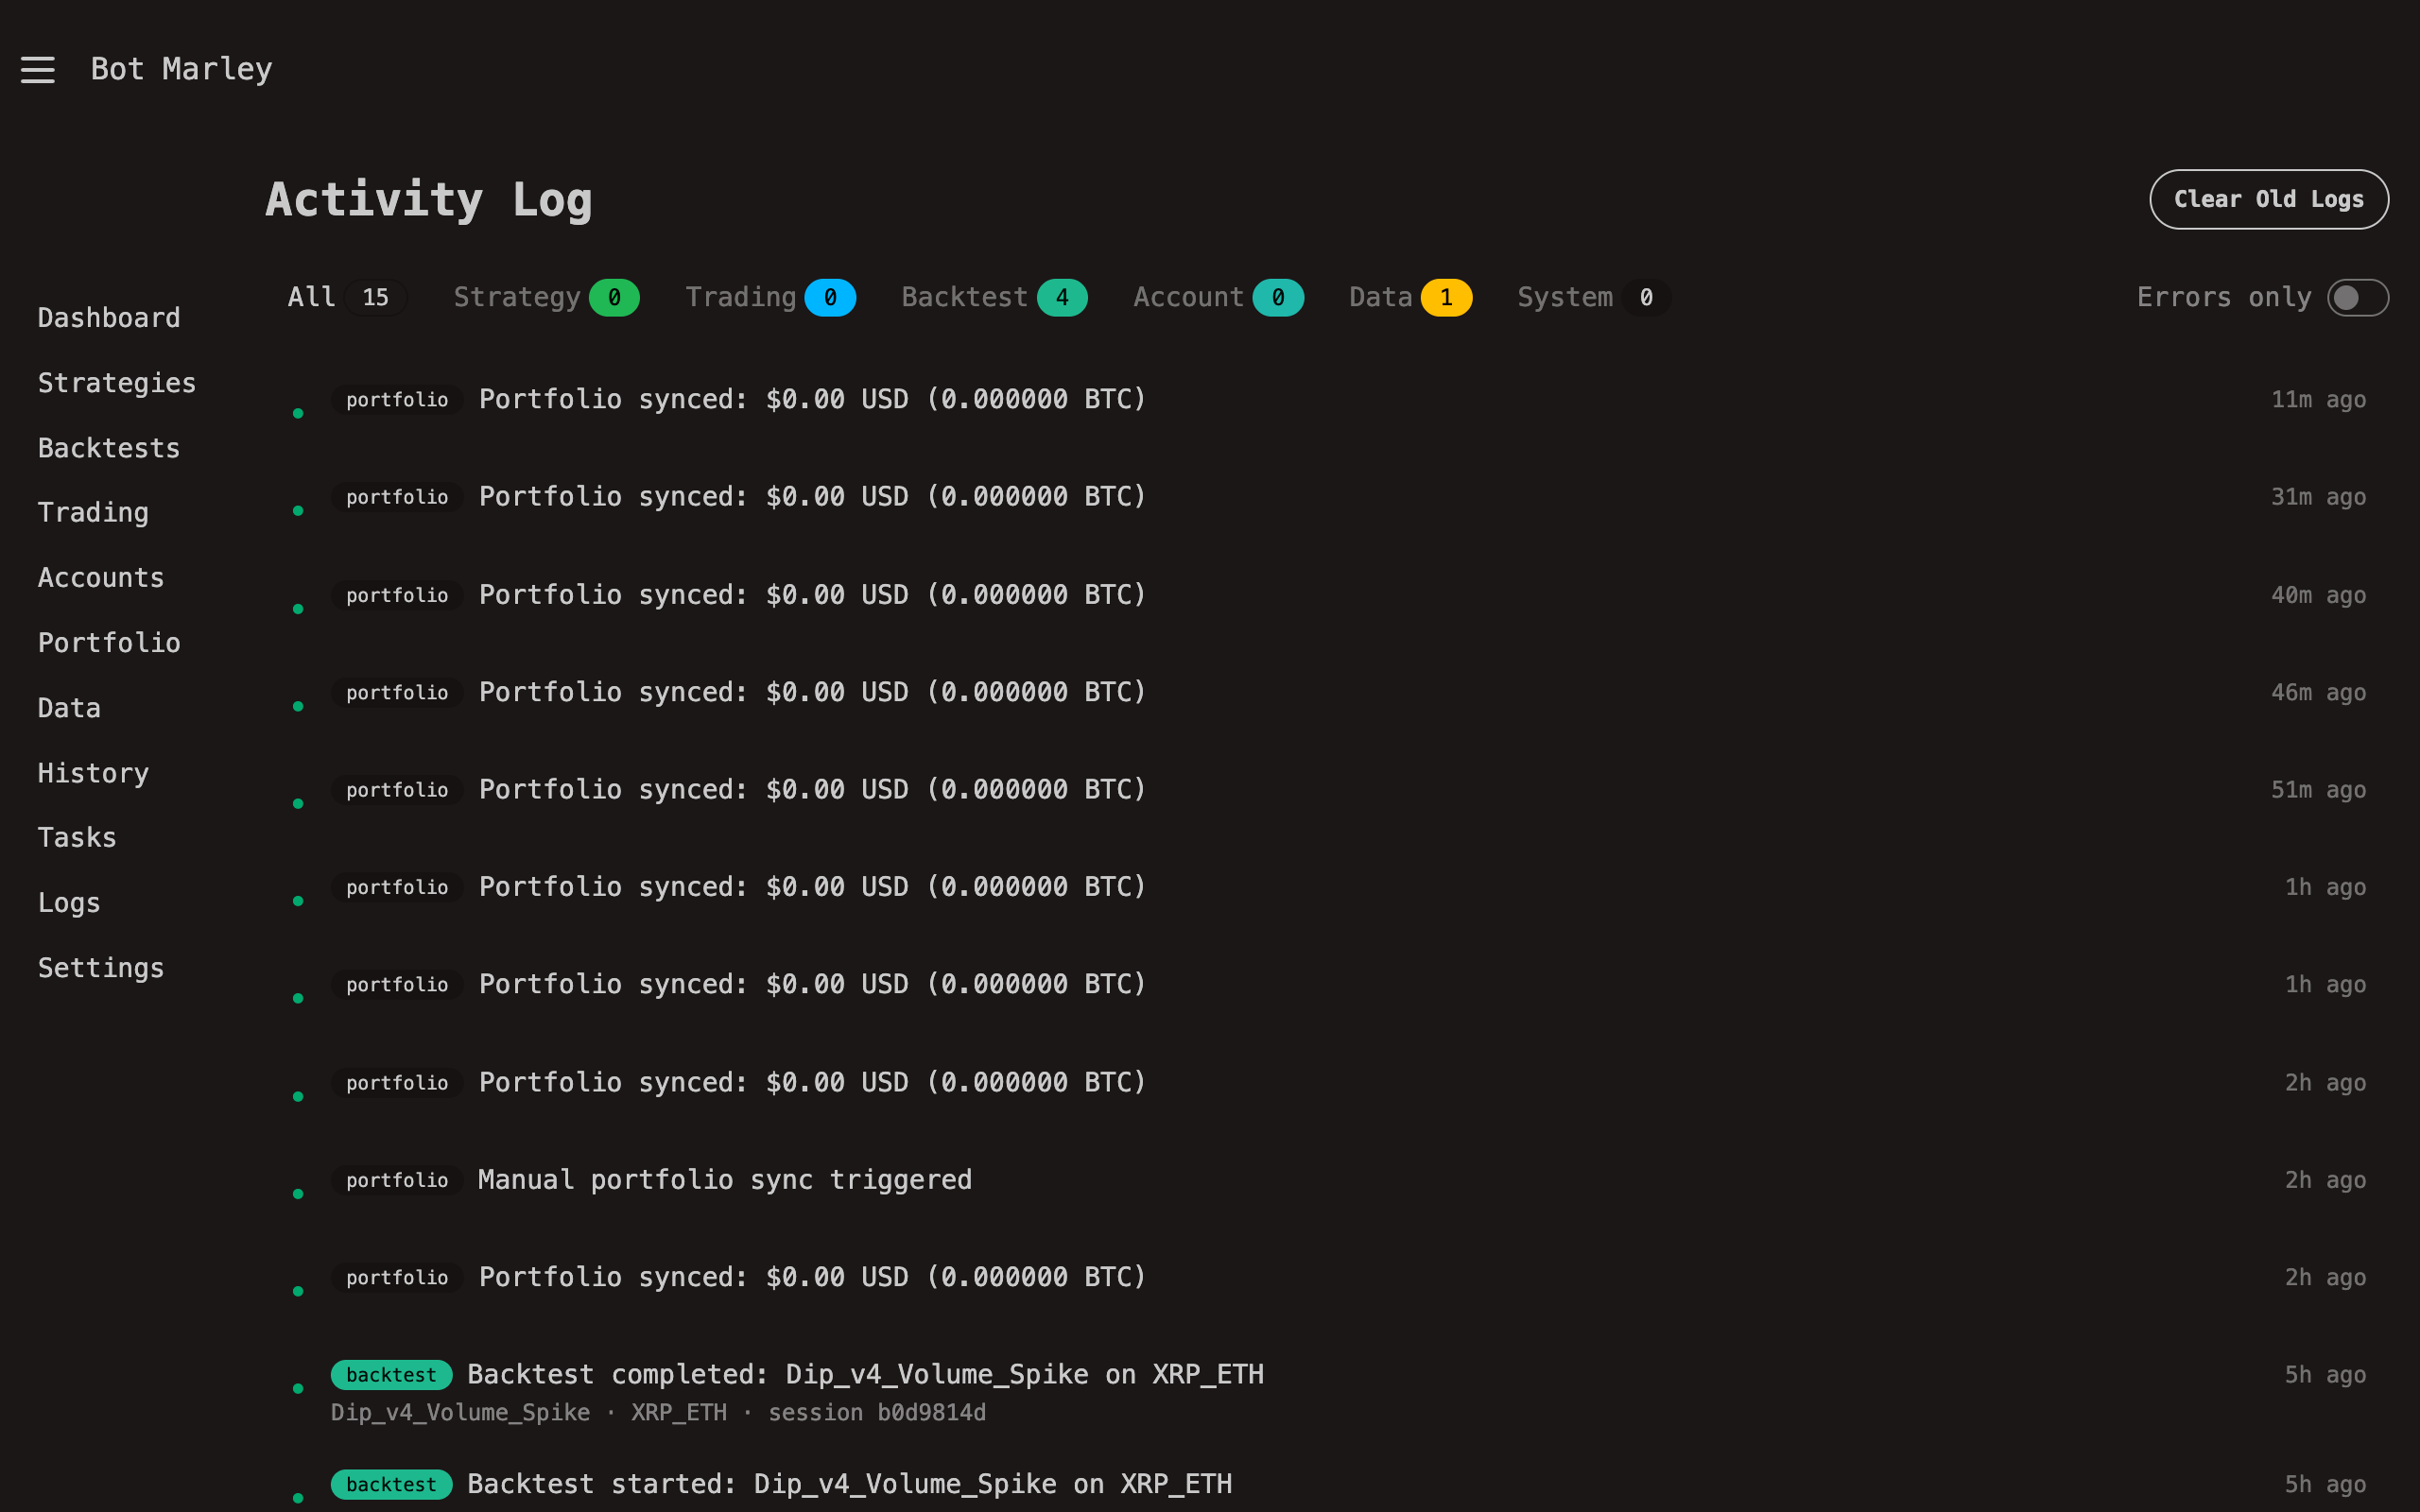
Log Storage
Activity logs are stored in PostgreSQL and persist across server restarts. They are separate from the structured tracing logs that go to stdout.
Activity logs are designed for user-facing event tracking. For debugging server issues, check the terminal output where structured tracing logs provide more technical detail.
Common Log Events
Trading Session Logs
[INFO] trading session_started Session "BTC Scalper" started on XBTUSDT
[INFO] trading action_executed BUY 0.001 BTC @ $67,500.00
[INFO] trading session_paused Session "BTC Scalper" paused by user
[INFO] trading session_stopped Session "BTC Scalper" stopped - PnL: +$45.20 (+2.3%)
Error Logs
[ERROR] trading engine_error Failed to fetch candles: API timeout
[ERROR] account sync_failed Account verification failed: invalid API key
[WARN] system task_recovered Recovered 2 stale tasks from previous crash
Authentication
Botmarley supports optional password protection to secure access to the web interface.
How It Works
Authentication in Botmarley is simple and file-based:
- If a
.passwordfile exists in the Botmarley home directory, authentication is enabled - All page routes require a valid session cookie
- Public routes (login page, static files,
/book) remain accessible - Sessions are stored as secure cookies
Setting Up Password Protection
Via the Settings Page
- Navigate to Settings (
/settings) - Enter your desired password in the password field
- Click Save
- The
.passwordfile is created automatically - You'll be redirected to the login page
The password is securely hashed before storage. When setting it through the Settings page, this is handled automatically.
Logging In
When authentication is enabled:
- Visit any page — you'll be redirected to
/login - Enter your password
- Click Login
- A session cookie is set and you're redirected to the dashboard
Logging Out
Click the Logout button in the sidebar footer, or navigate to /logout.
Disabling Authentication
To remove password protection:
- Delete the
.passwordfile from the Botmarley home directory - Restart the server
- All pages become accessible without login
rm ~/.botmarley/.password
Security Notes
Botmarley is designed as a single-tenant, locally-run application. If you expose it to the internet (e.g., for remote access), always enable password protection and consider using HTTPS via a reverse proxy like Caddy or nginx.
- Sessions expire after a configurable timeout
- The cookie is marked
HttpOnlyandSameSite=Strict - Failed login attempts are logged
- There is no username — only a single password protects the entire instance
Telegram Notifications
Botmarley can send trade notifications to your Telegram account, keeping you informed of trading actions even when you're away from the dashboard.
Setup
1. Create a Telegram Bot
- Open Telegram and search for @BotFather
- Send
/newbotand follow the prompts - Choose a name (e.g., "My Botmarley Alerts")
- Copy the bot token (looks like
123456789:ABCdefGHI...)
2. Get Your Username
Your Telegram username (the one starting with @) is used for access control. Only messages from this username will be accepted by the bot.
3. Configure in Botmarley
Navigate to Settings (/settings) and fill in:
| Field | Value |
|---|---|
| Enabled | Check the box |
| Bot Token | Paste the token from BotFather |
| Allowed Username | Your Telegram username (without @) |
Click Save.
4. Start the Bot
Open a chat with your new bot in Telegram and send /start. The bot needs this initial message to establish the chat.
What Gets Notified
The Telegram bot sends notifications for trade actions during live trading sessions:
| Event | Example Message |
|---|---|
| Buy | "BUY 0.001 BTC @ $67,500.00 (Session: BTC Scalper)" |
| Sell | "SELL 0.001 BTC @ $69,200.00 — PnL: +$1.70 (+2.5%)" |
| Session Started | "Trading session 'BTC Scalper' started on XBTUSDT" |
| Session Stopped | "Session 'BTC Scalper' stopped — Total PnL: +$45.20" |
Notifications are sent in real-time as actions execute. They use the same broadcast channel as the web interface's SSE updates.
Architecture
graph LR
E[Trading Engine] -->|ActionNotification| B[Broadcast Channel]
B --> T[Telegram Bot]
B --> S[SSE Stream]
T --> TG[Telegram API]
S --> W[Web Browser]
The Telegram bot subscribes to the same ActionNotification broadcast channel that powers the web interface's real-time updates.
Troubleshooting
Bot Not Sending Messages
- Check Settings — verify the bot token and username are correct
- Send /start — you must initiate the chat first
- Check Logs — look for Telegram errors in the Activity Logs or terminal output
- Restart Server — the Telegram bot spawns at startup; changes require a restart
Bot Token Invalid
If you see "Telegram bot failed to start" in the logs:
- Verify the token with BotFather
- Make sure you copied the full token including the colon
Keep your bot token secret. Anyone with the token can control your bot. If compromised, use BotFather's /revoke command to generate a new token.
Running Locally
This guide covers running Botmarley on your local machine for day-to-day use.
Prerequisites
| Tool | Purpose |
|---|---|
| Docker | Runs PostgreSQL in a container |
| Botmarley binary | Downloaded from GitHub Releases |
See Installation for detailed setup instructions.
Starting Up
1. Start PostgreSQL
docker compose up -d postgres
This starts PostgreSQL on localhost:5433 with:
- Database:
botmarley - User:
botmarley - Password:
botmarley_dev
2. Start Botmarley
./server
The server will be available at http://localhost:3000.
The database schema is initialized automatically on first run. Tables are created if they do not already exist.
3. Stop Botmarley
Press Ctrl+C in the terminal to stop the server.
Configuration
Botmarley can be configured through environment variables or a settings.toml file. Environment variables take precedence.
Common Options
# Change the server port
PORT=8080 ./server
# Use a custom database
DATABASE_URL=postgresql://user:pass@localhost:5432/mydb ./server
# Increase log verbosity
RUST_LOG=debug ./server
See Environment Variables for the full list of options.
Database Management
To reset the database and start fresh:
docker compose down -v
docker compose up -d postgres
This destroys all data including accounts, trading sessions, and backtest results. Use with caution.
To stop PostgreSQL without deleting data:
docker compose down
Your data persists in data/postgres/ on disk and will be available when you start the container again.
Production Deployment
This guide covers deploying Botmarley to a production server.
Download the Release
Download the latest ARM64 release from GitHub:
curl -LO https://github.com/mi4uu/botmarley/releases/latest/download/botmarley-arm64.tar.gz
For x86_64 servers, use botmarley-amd64.tar.gz instead.
Extract and Install
# Extract the archive
tar -xzf botmarley-arm64.tar.gz
# Create installation directory
sudo mkdir -p /opt/botmarley
# Copy files
sudo cp server /opt/botmarley/
sudo cp -r templates/ /opt/botmarley/
sudo cp -r static/ /opt/botmarley/
sudo cp -r strats/ /opt/botmarley/
Required Files
These files must be present in the installation directory:
| Path | Purpose |
|---|---|
server | Server binary |
templates/ | Web interface templates |
static/ | CSS, JS, static assets |
strats/ | Strategy TOML files |
PostgreSQL Setup
Install PostgreSQL 17 on your server:
# Ubuntu/Debian
sudo apt install postgresql-17
# Create database and user
sudo -u postgres psql -c "CREATE USER botmarley_prod WITH PASSWORD 'your-secure-password';"
sudo -u postgres psql -c "CREATE DATABASE botmarley_prod OWNER botmarley_prod;"
systemd Service
Create a systemd unit file at /etc/systemd/system/botmarley.service:
[Unit]
Description=Botmarley Trading Bot
After=network.target postgresql.service
Wants=postgresql.service
[Service]
Type=simple
User=botmarley
Group=botmarley
WorkingDirectory=/opt/botmarley
ExecStart=/opt/botmarley/server
Restart=always
RestartSec=5
# Environment
Environment=DATABASE_URL=postgresql://botmarley_prod:your-secure-password@127.0.0.1:5432/botmarley_prod
Environment=HOST=0.0.0.0
Environment=PORT=3000
Environment=RUST_LOG=info
[Install]
WantedBy=multi-user.target
Enable and start:
sudo systemctl daemon-reload
sudo systemctl enable botmarley
sudo systemctl start botmarley
Reverse Proxy (HTTPS)
For HTTPS, use Caddy as a reverse proxy:
# /etc/caddy/Caddyfile
your-domain.com {
reverse_proxy localhost:3000
}
sudo systemctl restart caddy
Caddy automatically obtains and renews TLS certificates via Let's Encrypt.
Always enable password protection when exposing Botmarley to the internet.
Monitoring
Check Status
sudo systemctl status botmarley
View Logs
sudo journalctl -u botmarley -f
Health Check
curl http://localhost:3000/
Updating
To update Botmarley to a new release:
# 1. Download the latest release
curl -LO https://github.com/mi4uu/botmarley/releases/latest/download/botmarley-arm64.tar.gz
# 2. Extract
tar -xzf botmarley-arm64.tar.gz
# 3. Copy new files to production
sudo cp server /opt/botmarley/
sudo cp -r templates/ /opt/botmarley/
sudo cp -r static/ /opt/botmarley/
# 4. Restart the service
sudo systemctl restart botmarley
Active trading sessions are automatically recovered after a restart. The server records a server_restart event and re-spawns all running/paused sessions. There may be a brief gap in candle data during the restart window.
Environment Variables
Botmarley can be configured using environment variables, which take precedence over settings file values.
Core Variables
| Variable | Default | Description |
|---|---|---|
DATABASE_URL | From settings.toml | PostgreSQL connection string |
HOST | 127.0.0.1 | Server bind address |
PORT | 3000 | Server listen port |
BOTMARLEY_HOME | ~/.botmarley | Configuration and data directory |
RUST_LOG | info | Controls log verbosity (trace, debug, info, warn, error) |
Database URL Format
postgresql://username:password@host:port/database
Examples:
# Local development
DATABASE_URL=postgresql://botmarley:botmarley_dev@localhost:5432/botmarley
# Production
DATABASE_URL=postgresql://botmarley_prod:secure-password@127.0.0.1:5432/botmarley_prod
Setting Variables
In systemd
Add Environment= lines to your service file:
[Service]
Environment=DATABASE_URL=postgresql://user:pass@localhost:5432/db
Environment=HOST=0.0.0.0
Environment=PORT=3000
In Shell
export DATABASE_URL=postgresql://botmarley:botmarley_dev@localhost:5432/botmarley
export PORT=3000
./server
In Docker
docker run -e DATABASE_URL=postgresql://... -e PORT=3000 botmarley
Precedence
Environment variables override values from settings.toml:
Environment Variable > settings.toml > Default Value
Use environment variables for deployment-specific settings (database URLs, ports) and the settings file for application preferences (Telegram config, data paths).
Multi-Instance Deployment
To run multiple Botmarley instances on the same server, use different ports and databases:
# Instance 1
PORT=3000 DATABASE_URL=postgresql://...db1 ./server
# Instance 2
PORT=3001 DATABASE_URL=postgresql://...db2 ./server
Each instance operates independently with its own database, accounts, and trading sessions.
Strategy TOML Reference
This is the complete reference for the Botmarley strategy TOML format. Every field, type, and valid value is documented here.
Structure Overview
[meta]
name = "Strategy Name"
description = "Optional description"
max_open_positions = 5
[[actions]]
type = "open_long"
amount = "100 USDC"
average_price = false
[[actions.triggers]]
indicator = "rsi_14"
operator = "<"
target = "30"
timeframe = "1h"
A strategy consists of:
[meta]— metadata and global settings[[actions]]— one or more trading actions, each with triggers
[meta] Section
| Field | Type | Required | Default | Description |
|---|---|---|---|---|
name | String | Yes | — | Strategy name (1–255 characters, must be unique) |
description | String | No | "" | Human-readable description |
max_open_positions | Integer | No | Unlimited | Maximum concurrent open positions (must be >= 1) |
[meta]
name = "BTC_DCA_Conservative"
description = "RSI oversold entry with DCA on dips, trailing stop exit"
max_open_positions = 3
[[actions]] Section
Each action defines what to do and when (via triggers).
| Field | Type | Required | Default | Description |
|---|---|---|---|---|
type | String | Yes | — | Action type: open_long, buy, or sell |
amount | String | Yes | — | Trade amount (see format below) |
average_price | Boolean | No | false | Enable DCA averaging (open_long and buy only) |
Action Types
| Type | Purpose | Notes |
|---|---|---|
open_long | Open a new long position | Initial entry |
buy | Additional buy within position | DCA / averaging |
sell | Exit position (full or partial) | Close trade |
Amount Format
Currency amount:
amount = "100 USDC"
amount = "50.5 BTC"
amount = "200 USD"
Percentage:
amount = "50%" # 50% of position
amount = "100%" # Full exit
Triggers
Each action requires at least one trigger. All triggers within an action use AND logic — all must be true simultaneously for the action to execute.
Three Trigger Categories
- Technical Indicator — compare indicator values
- Price Change — react to price movements
- Next Candle — delay execution
Technical Indicator Triggers
Compare a technical indicator against a target value or another indicator.
[[actions.triggers]]
indicator = "rsi_14"
operator = "<"
target = "30"
timeframe = "1h"
max_count = 5
| Field | Type | Required | Description |
|---|---|---|---|
indicator | String | Yes | Indicator name with period (e.g., rsi_14, ema_20) |
operator | String | Yes | Comparison: >, <, =, cross_above, cross_below |
target | String | Yes | Numeric value or another indicator |
timeframe | String | No | Evaluation timeframe (1m, 5m, 15m, 1h, 4h, 1d) |
max_count | Integer | No | Maximum times this trigger fires per position |
Operators
| Operator | Meaning |
|---|---|
> | Indicator is greater than target |
< | Indicator is less than target |
= | Indicator equals target |
cross_above | Indicator crosses above target (was below, now above) |
cross_below | Indicator crosses below target (was above, now below) |
Target Values
Numeric:
target = "30" # RSI value
target = "67500.0" # Price level
Another indicator:
target = "sma_50" # Compare EMA to SMA
target = "bb_upper" # Compare to Bollinger upper band
Price Change Triggers
React to price movements relative to position entry or market-wide.
pos_price_change
Fires when position P&L reaches a threshold.
[[actions.triggers]]
type = "pos_price_change"
value = "+3%" # Take profit at +3%
max_count = 1
pos_price_change_follow
Trailing trigger — tracks the peak price since entry, fires on retracement.
[[actions.triggers]]
type = "pos_price_change_follow"
value = "+3.0%"
tolerance = "-0.2%"
price_change
Market-wide price change (not position-relative).
[[actions.triggers]]
type = "price_change"
value = "-5%"
timeframe = "1h"
trailing_stop
Follows price up, triggers on drawdown from peak.
[[actions.triggers]]
type = "trailing_stop"
value = "-3%"
Price Change Fields
| Field | Type | Required | Description |
|---|---|---|---|
type | String | Yes | Trigger type (see variants above) |
value | String | Yes | Percentage threshold (e.g., "+3%", "-5%") |
tolerance | String | No | Retrace tolerance (pos_price_change_follow only) |
timeframe | String | No | For price_change and consecutive_candles |
max_count | Integer | No | Maximum fires per position |
Next Candle Trigger
Delays action execution until the next candle closes.
[[actions.triggers]]
type = "next_candle"
timeframe = "1h"
| Field | Type | Required | Description |
|---|---|---|---|
type | String | Yes | Must be "next_candle" |
timeframe | String | No | Candle timeframe to wait for |
max_count | Integer | No | Maximum fires per position |
Indicators Reference
| Format | Name | Notes |
|---|---|---|
rsi_{period} | Relative Strength Index | e.g., rsi_14 |
sma_{period} | Simple Moving Average | e.g., sma_50 |
ema_{period} | Exponential Moving Average | e.g., ema_20 |
bb_lower, bb_upper, bb_mid | Bollinger Bands | Band component |
macd_line, macd_signal, macd_hist | MACD | Component |
stoch_rsi_{period} | Stochastic RSI | e.g., stoch_rsi_14 |
roc_{period} | Rate of Change | e.g., roc_10 |
atr_{period} | Average True Range | e.g., atr_14 |
obv | On Balance Volume | No parameters |
obv_sma_{period} | OBV with SMA | e.g., obv_sma_20 |
vol_sma_{period} | Volume SMA | e.g., vol_sma_20 |
ttm_trend | TTM Trend | Alternative: ttmtrend |
price | Current Price | Special: market price |
Period range: 1–200 (inclusive). Values outside this range cause a validation error.
Valid Timeframes
| Value | Meaning |
|---|---|
1m | 1 minute |
5m | 5 minutes |
15m | 15 minutes |
1h | 1 hour |
4h | 4 hours |
1d | 1 day |
Complete Example
[meta]
name = "Multi_Timeframe_DCA_v1"
description = "RSI oversold entry on 1h, DCA on dips, trailing stop exit"
max_open_positions = 3
# ENTRY: RSI < 30 on 1h timeframe
[[actions]]
type = "open_long"
amount = "100 USDC"
average_price = false
[[actions.triggers]]
indicator = "rsi_14"
operator = "<"
target = "30"
timeframe = "1h"
# DCA: Buy more on -2% drop
[[actions]]
type = "buy"
amount = "100 USDC"
average_price = true
[[actions.triggers]]
type = "pos_price_change"
value = "-2%"
max_count = 1
# DCA: Buy more on -4% drop
[[actions]]
type = "buy"
amount = "200 USDC"
average_price = true
[[actions.triggers]]
type = "pos_price_change"
value = "-4%"
max_count = 1
# TAKE PROFIT: +3% from average entry
[[actions]]
type = "sell"
amount = "100%"
[[actions.triggers]]
type = "pos_price_change"
value = "3%"
# STOP LOSS: -5% from average entry
[[actions]]
type = "sell"
amount = "100%"
[[actions.triggers]]
type = "pos_price_change"
value = "-5%"
Validation Errors
| Error | Cause |
|---|---|
REQUIRED | Missing required field |
INVALID_ACTION_TYPE | Type not open_long, buy, or sell |
INVALID_AMOUNT_FORMAT | Doesn't match "NUMBER CURRENCY" or "NUMBER%" |
INVALID_OPERATOR | Unknown operator |
INVALID_INDICATOR | Unknown indicator format |
INVALID_PERIOD | Non-numeric period |
INVALID_PERIOD_RANGE | Period outside 1–200 |
INVALID_BAND_TYPE | Bollinger band not lower/upper/mid |
INVALID_MACD_COMPONENT | MACD component not line/signal/hist |
INVALID_TIMEFRAME | Timeframe not in valid list |
Indicators Reference
Complete reference table for all technical indicators supported by Botmarley.
Indicator Summary
| Indicator | TOML Format | Category | Default Period | Signal Range |
|---|---|---|---|---|
| SMA | sma_{period} | Trend | 20, 50, 200 | Price-level |
| EMA | ema_{period} | Trend | 9, 12, 20, 26 | Price-level |
| RSI | rsi_{period} | Momentum | 14 | 0–100 |
| MACD | macd_{component} | Momentum | 12/26/9 | Oscillator |
| Bollinger Bands | bb_{band} | Volatility | 20 | Price-level |
| Stochastic RSI | stoch_rsi_{period} | Momentum | 14 | 0–100 |
| ATR | atr_{period} | Volatility | 14 | Positive |
| ROC | roc_{period} | Momentum | 10 | Percentage |
| OBV | obv | Volume | — | Cumulative |
| OBV SMA | obv_sma_{period} | Volume | 20 | Cumulative |
| Volume SMA | vol_sma_{period} | Volume | 20 | Volume-level |
| TTM Trend | ttm_trend | Trend | — | Binary |
| RSTD | rstd_{period} | Statistical | 20 | Positive |
| Z-Score | zscore_{period} | Statistical | 20 | -4 to +4 |
| Percentile Rank | prank_{period} | Statistical | 50 | 0–100 |
| Parkinson | parkinson_{period} | Volatility | 20 | Positive |
| Garman-Klass | gk_vol_{period} | Volatility | 20 | Positive |
| Yang-Zhang | yz_vol_{period} | Volatility | 20 | Positive |
| Hurst | hurst_{period} | Regime | 200 | 0–1 |
| Half-Life | halflife_{period} | Regime | 200 | 1+ candles |
| Vol Regime | vol_regime_{period} | Regime | 100 | 1 / 2 / 3 |
| VWAP | vwap | Institutional | — | Price-level |
| VWAP Dev | vwap_dev_{period} | Institutional | 20 | Percentage |
| Skewness | skew_{period} | Distribution | 60 | -3 to +3 |
| Kurtosis | kurt_{period} | Distribution | 60 | -2 to +10 |
| Autocorrelation | autocorr_{lag} | Momentum | lag 1 | -1 to +1 |
Trend Indicators
Simple Moving Average (SMA)
Format: sma_{period} (e.g., sma_50, sma_200)
The SMA calculates the arithmetic mean of the last N closing prices. It smooths out price data to identify trend direction.
Common uses:
sma_50/sma_200— Golden Cross / Death Cross signals- Price above SMA = uptrend, below = downtrend
[[actions.triggers]]
indicator = "ema_9"
operator = "cross_above"
target = "sma_21"
Exponential Moving Average (EMA)
Format: ema_{period} (e.g., ema_9, ema_20)
The EMA gives more weight to recent prices, making it more responsive to new information than the SMA.
Common uses:
- Fast/slow EMA crossovers (e.g., EMA 9 crossing EMA 21)
- Dynamic support/resistance levels
[[actions.triggers]]
indicator = "ema_12"
operator = "cross_above"
target = "ema_26"
TTM Trend
Format: ttm_trend or ttmtrend
A binary trend indicator. Returns a directional signal indicating whether the market is in an uptrend or downtrend.
Momentum Indicators
Relative Strength Index (RSI)
Format: rsi_{period} (e.g., rsi_14)
RSI measures the speed and magnitude of price changes on a scale of 0–100.
| Level | Interpretation |
|---|---|
| < 30 | Oversold (potential buy) |
| > 70 | Overbought (potential sell) |
| 30–70 | Neutral |
# Buy when RSI drops below 30
[[actions.triggers]]
indicator = "rsi_14"
operator = "<"
target = "30"
MACD (Moving Average Convergence Divergence)
Components:
macd_line— MACD line (12-period EMA minus 26-period EMA)macd_signal— Signal line (9-period EMA of MACD line)macd_histormacd_histogram— Histogram (MACD line minus signal)
# Buy when MACD crosses above signal
[[actions.triggers]]
indicator = "macd_line"
operator = "cross_above"
target = "macd_signal"
Stochastic RSI
Format: stoch_rsi_{period} (e.g., stoch_rsi_14)
Applies the Stochastic oscillator formula to RSI values instead of price. Ranges 0–100, more sensitive than standard RSI.
Rate of Change (ROC)
Format: roc_{period} (e.g., roc_10)
Measures the percentage change in price over a specified period. Positive values indicate upward momentum, negative values indicate downward.
Volatility Indicators
Bollinger Bands
Components:
bb_upper— Upper band (SMA + 2 standard deviations)bb_midorbb_middle— Middle band (20-period SMA)bb_lower— Lower band (SMA - 2 standard deviations)
# Buy when price touches lower Bollinger Band
[[actions.triggers]]
indicator = "price"
operator = "<"
target = "bb_lower"
Average True Range (ATR)
Format: atr_{period} (e.g., atr_14)
Measures market volatility by calculating the average range of price bars. Higher ATR = more volatile market.
Volume Indicators
On Balance Volume (OBV)
Format: obv
Cumulative volume indicator — adds volume on up days, subtracts on down days. Helps confirm price trends.
OBV with SMA
Format: obv_sma_{period} (e.g., obv_sma_20)
Smoothed version of OBV using a Simple Moving Average.
Volume SMA
Format: vol_sma_{period} (e.g., vol_sma_20)
Simple Moving Average applied to trading volume. Useful for identifying volume breakouts.
Special Values
Price
Format: price
Represents the current market price (close of current candle). Use this to compare indicators against the actual price.
# EMA above current price = potential resistance
[[actions.triggers]]
indicator = "price"
operator = ">"
target = "ema_200"
Statistical Indicators
Rolling Standard Deviation (RSTD)
Format: rstd_{period} (e.g., rstd_20)
Measures the dispersion of closing prices around their mean over a rolling window. The raw building block of volatility measurement.
Z-Score
Format: zscore_{period} (e.g., zscore_20)
How many standard deviations the current price is from its rolling mean. Universal thresholds (-2 = oversold, +2 = overbought) work across all assets.
# Buy when price is 2 standard deviations below mean
[[actions.triggers]]
indicator = "zscore_20"
operator = "<"
target = "-2.0"
Percentile Rank
Format: prank_{period} (e.g., prank_50)
Where the current close sits within its rolling range, expressed as a percentile (0–100). 5 = bottom 5%, 95 = top 5%.
Advanced Volatility Estimators
Parkinson Volatility
Format: parkinson_{period} (e.g., parkinson_20)
Volatility estimated from high-low range. ~5x more efficient than close-to-close standard deviation.
Garman-Klass Volatility
Format: gk_vol_{period} (e.g., gk_vol_20)
Volatility from full OHLC data. ~8x more efficient than close-to-close estimators.
Yang-Zhang Volatility
Format: yz_vol_{period} (e.g., yz_vol_20)
The most comprehensive volatility estimator. Combines overnight (close-to-open) and intraday (open-to-close + high-low) components.
Regime Detection Indicators
Hurst Exponent
Format: hurst_{period} (e.g., hurst_200)
Measures market memory via R/S analysis. H > 0.55 = trending, H < 0.45 = mean-reverting, H ≈ 0.50 = random walk.
# Only trade momentum when market is trending
[[actions.triggers]]
indicator = "hurst_200"
operator = ">"
target = "0.55"
Half-Life
Format: halflife_{period} (e.g., halflife_200)
Estimates how many candles it takes for price to revert halfway to the mean. Lower = faster reversion. Used to assess if mean-reversion is tradeable.
Volatility Regime
Format: vol_regime_{period} (e.g., vol_regime_100)
Classifies current volatility into discrete regimes: 1 (low), 2 (normal), 3 (high). Self-calibrating across all assets.
Institutional / Fair Value Indicators
VWAP
Format: vwap
Volume Weighted Average Price — the institutional benchmark for fair value. Price below VWAP = cheap, above = expensive.
VWAP Deviation
Format: vwap_dev_{period} (e.g., vwap_dev_20)
Percentage deviation from VWAP. Negative = below fair value, positive = above. Quantifies the distance from institutional consensus price.
Distribution Intelligence
Skewness
Format: skew_{period} (e.g., skew_60)
Measures return distribution asymmetry. Positive = upside surprises likely, negative = crash risk elevated.
Kurtosis
Format: kurt_{period} (e.g., kurt_60)
Measures tail fatness (excess kurtosis). Low = predictable market, high = extreme moves likely. A pure risk indicator.
Momentum Persistence
Autocorrelation
Format: autocorr_{lag} (e.g., autocorr_1)
Measures how correlated current returns are with returns N candles ago. Positive = momentum persists, negative = reversals likely, near zero = random.
# Confirm momentum persistence for trend-following
[[actions.triggers]]
indicator = "autocorr_1"
operator = ">"
target = "0.1"
Period Constraints
Classic Indicators
- Minimum period: 1
- Maximum period: 200
- Invalid period (0 or >200): validation error
Statistical Indicators
- Minimum period: varies by indicator (5–50)
- Maximum period: 500
- See individual indicator pages for exact ranges
Shorter periods (e.g., EMA 9) react faster to price changes but generate more false signals. Longer periods (e.g., SMA 200) are smoother but lag behind price movements. Choose based on your strategy's timeframe and risk tolerance.
Glossary
Common terms used throughout Botmarley and cryptocurrency trading.
A
Action
A trading command defined in a strategy: open_long (enter position), buy (DCA), or sell (exit).
Apache Arrow A columnar data format used by Botmarley to store historical candle data. Provides fast read/write performance for time-series data.
ATR (Average True Range) A volatility indicator that measures the average range between high and low prices over a period. Higher ATR means more volatile market.
Average Price / DCA Dollar-Cost Averaging — buying additional amounts at different price levels to reduce the average entry price of a position.
B
Backtest Running a strategy against historical market data to evaluate its performance without risking real funds.
Bollinger Bands A volatility indicator consisting of three lines: a middle SMA, an upper band (SMA + 2 standard deviations), and a lower band (SMA - 2 standard deviations).
Broadcast Channel An internal Rust channel that distributes trade action notifications to multiple consumers (web SSE, Telegram bot).
C
Candle (Candlestick) A data point representing price movement over a time period, containing: open, high, low, close, and volume.
Cross Above / Cross Below A signal that occurs when one value (e.g., fast EMA) moves from below to above (or above to below) another value (e.g., slow EMA).
D
DCA (Dollar-Cost Averaging) See Average Price.
Drawdown The peak-to-trough decline in portfolio or position value, usually expressed as a percentage.
E
EMA (Exponential Moving Average) A moving average that gives more weight to recent prices, making it more responsive than a Simple Moving Average.
Engine
The TradingEngine — the core component that evaluates strategy triggers against live market data and executes actions.
H
HTMX
A JavaScript library that allows server-driven HTML updates via HTML attributes (hx-get, hx-swap). Used by Botmarley for dynamic page updates without a JavaScript framework.
K
Kraken A cryptocurrency exchange supported by Botmarley for live trading and market data.
L
Lightweight Charts A charting library by TradingView used by Botmarley to render candlestick charts in the browser.
Lookback The number of historical candles considered when evaluating a trigger or indicator.
M
MACD (Moving Average Convergence Divergence) A momentum indicator showing the relationship between two EMAs (12-period and 26-period). Consists of a MACD line, signal line, and histogram.
max_count A trigger parameter that limits how many times the trigger can fire per position.
max_open_positions A strategy setting that caps the number of concurrent open positions.
MiniJinja A Rust template engine (similar to Jinja2) used by Botmarley to render HTML pages on the server.
O
OBV (On Balance Volume) A volume indicator that adds volume on up-days and subtracts on down-days, helping confirm price trends.
Open Position An active trade that has been entered but not yet closed.
P
Pair (Trading Pair)
Two assets that can be traded against each other (e.g., XBTUSDT = Bitcoin vs Tether).
Paper Account A simulated account for testing strategies without real funds.
PnL (Profit and Loss) The net gain or loss from a trade or trading session, expressed as an absolute amount or percentage.
Position A trade — from entry (buy) to exit (sell). Can include multiple DCA entries.
R
ROC (Rate of Change) A momentum indicator measuring the percentage change in price over a specified period.
RSI (Relative Strength Index) A momentum oscillator (0–100) that measures the speed and change of price movements. Below 30 is considered oversold, above 70 is overbought.
Rule In Botmarley strategies, a rule is an action combined with its triggers.
S
Session (Trading Session) An instance of a strategy running against a specific trading pair on a specific account. Can be started, paused, resumed, or stopped.
SMA (Simple Moving Average) The arithmetic mean of closing prices over a specified period.
SSE (Server-Sent Events) A web technology for pushing real-time updates from server to browser over HTTP. Used by Botmarley for live trading updates.
Stochastic RSI A momentum indicator that applies the Stochastic formula to RSI values, providing a more sensitive oversold/overbought signal than standard RSI.
Strategy A set of trading rules defined in TOML format that tell Botmarley when to buy and sell.
T
Task Queue A background job system in Botmarley that handles long-running operations (backtests, data downloads, account syncs) without blocking the web interface.
Timeframe
The duration of each candle: 1m (1 minute), 5m, 15m, 1h, 4h, 1d.
TOML Tom's Obvious Minimal Language — the configuration format used for defining strategies in Botmarley.
Trailing Stop An order type that follows the price in the profitable direction and triggers a sell when the price reverses by a specified percentage.
Trigger A condition that must be met for a strategy action to execute. Multiple triggers per action use AND logic.
TTM Trend A trend indicator that provides directional signals.
W
Win Rate The percentage of trades that were profitable. Calculated as (winning trades / total trades) x 100.