OBV -- On-Balance Volume
Contents
Overview
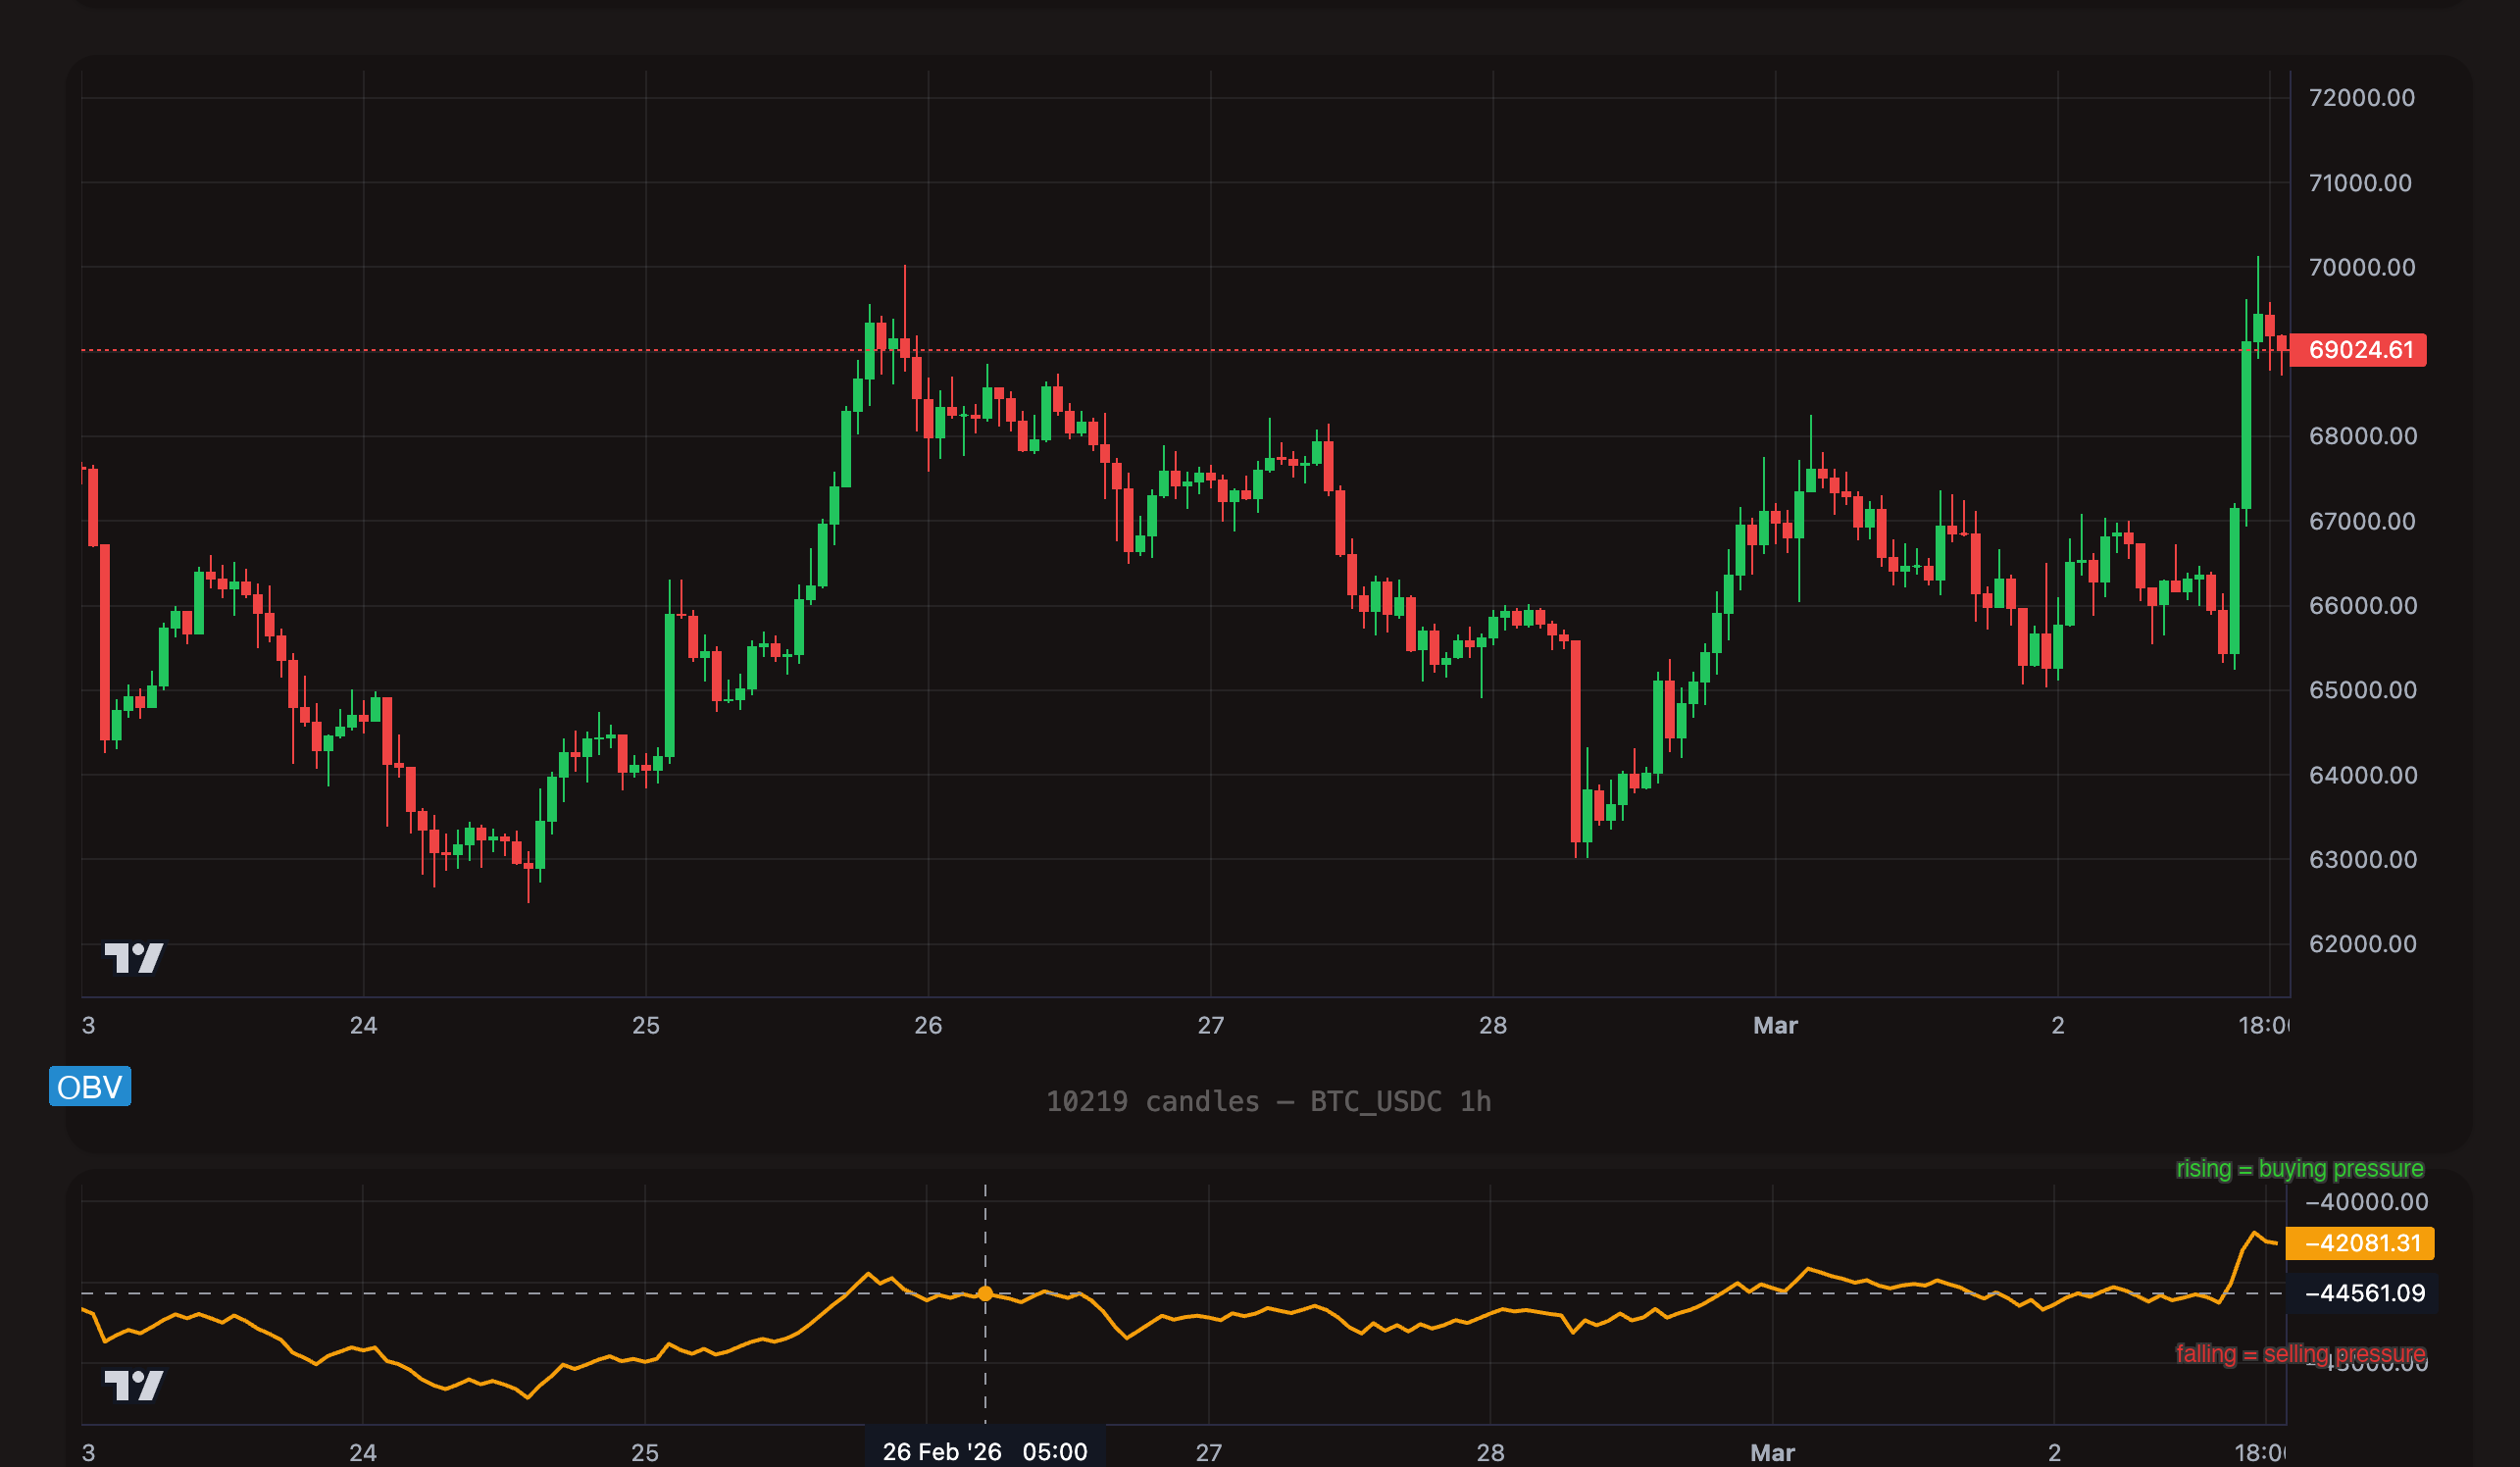
On-Balance Volume (OBV) is a cumulative volume indicator that connects volume flow to price direction. It answers a simple question: is more volume flowing into the asset (buying pressure) or out of it (selling pressure)?
The calculation is straightforward:
- If the current candle closes higher than the previous candle, the candle's volume is added to the running OBV total.
- If the current candle closes lower than the previous candle, the candle's volume is subtracted from the running OBV total.
- If the close is unchanged, OBV stays the same.
The result is a running total that rises when buying dominates and falls when selling dominates. The absolute value of OBV is meaningless on its own -- what matters is its direction and how it relates to price.
Why OBV matters: Volume leads price. If OBV is rising while price is flat, smart money may be accumulating -- a breakout could follow. If price makes a new high but OBV does not, the rally lacks conviction and may reverse.
Format
OBV has two related formats:
| Format | Period | Description |
|---|---|---|
obv | None (cumulative) | The raw On-Balance Volume line. No period parameter -- it is a running total from the start of data. |
obv_sma_{period} | Configurable | A Simple Moving Average of OBV. Smooths the OBV line to create a crossover reference. |
OBV SMA examples:
| Example | Period | Use Case |
|---|---|---|
obv_sma_10 | 10 | Fast -- more responsive, more crossovers |
obv_sma_20 | 20 | Standard -- balanced signal frequency |
obv_sma_50 | 50 | Slow -- fewer but higher-conviction signals |
Value range: Unbounded. OBV can be any positive or negative number depending on cumulative volume flow. The scale depends entirely on the asset's trading volume.
Because OBV is cumulative, its absolute value varies enormously between assets and timeframes. Never compare OBV values across different pairs. Focus on the direction and crossovers with its SMA.
How OBV Works
Rising OBV: Volume is flowing into the asset on up-candles more than it is flowing out on down-candles. Buyers are in control. If price is also rising, the uptrend is healthy and supported by volume.
Falling OBV: Volume is flowing out on down-candles more than it is flowing in on up-candles. Sellers are in control. If price is also falling, the downtrend has conviction.
OBV Divergence: The most powerful OBV signal. When price and OBV move in opposite directions, something is changing beneath the surface:
- Bullish divergence: Price makes a lower low, but OBV makes a higher low. Selling pressure is diminishing despite the price drop. A reversal upward may be imminent.
- Bearish divergence: Price makes a higher high, but OBV makes a lower high. Buying pressure is weakening despite the price rise. A reversal downward may follow.
OBV vs. OBV SMA: The raw OBV line is noisy. Smoothing it with an SMA creates a baseline for crossover signals -- the same way a moving average smooths price. When OBV crosses above its SMA, volume momentum is turning bullish. When it crosses below, volume momentum is turning bearish.
Understanding Operators with OBV
OBV is most commonly used with crossover operators against its own SMA. This is its primary signal mechanism.
cross_above -- OBV Crosses Above Its SMA
What it does: Fires once at the exact candle where OBV transitions from below its SMA to above it. Volume momentum has just turned bullish.
On the chart: The OBV line was sitting below its smoothed average, then climbs above it. This moment marks the shift from net selling pressure to net buying pressure (relative to recent history).
[[actions.triggers]]
indicator = "obv"
operator = "cross_above"
target = "obv_sma_20"
timeframe = "1h"
Typical use: Entry signal. OBV crossing above its SMA confirms that buying volume is increasing. This is the primary OBV buy signal and pairs well with price-based triggers.
cross_below -- OBV Crosses Below Its SMA
What it does: Fires once at the exact candle where OBV transitions from above its SMA to below it. Volume momentum has just turned bearish.
On the chart: The OBV line drops below its smoothed average. Selling volume is now outpacing buying volume relative to recent history.
[[actions.triggers]]
indicator = "obv"
operator = "cross_below"
target = "obv_sma_20"
timeframe = "1h"
Typical use: Exit signal or short entry. When OBV drops below its SMA, the buying pressure that supported the price move is fading.
> OBV Above Its SMA -- State-Based
What it does: True on every candle where OBV remains above its SMA. Volume momentum is currently bullish.
[[actions.triggers]]
indicator = "obv"
operator = ">"
target = "obv_sma_20"
timeframe = "1h"
Typical use: Trend filter. Use this alongside another entry trigger to gate trades so they only execute when volume momentum is favorable. "Buy RSI dips only when OBV is above its SMA."
< OBV Below Its SMA -- State-Based
What it does: True on every candle where OBV remains below its SMA. Volume momentum is currently bearish.
[[actions.triggers]]
indicator = "obv"
operator = ">"
target = "obv_sma_20"
timeframe = "1h"
Typical use: Bearish filter. Avoid opening long positions when selling pressure dominates. Can also be used as an exit condition.
- Use
cross_above/cross_belowfor entry and exit signals -- they fire once at the turning point when volume momentum shifts. - Use
>/<as filters alongside other triggers to confirm that volume momentum supports the trade direction.
TOML Examples
Buying Pressure Emerges
Enter when OBV crosses above its 20-period SMA on the 1-hour chart. This signals that buying volume is starting to dominate.
[[actions]]
type = "open_long"
amount = "100 USDC"

  [[actions.triggers]]
  indicator = "obv"
  operator = "cross_above"
  target = "obv_sma_20"
  timeframe = "1h"
Volume Momentum Exit
Exit the position when OBV drops below its SMA. The buying pressure that justified the entry has faded.
[[actions]]
type = "sell"
amount = "100%"

  [[actions.triggers]]
  indicator = "obv"
  operator = "cross_below"
  target = "obv_sma_20"
  timeframe = "1h"
OBV Crossover with Price Breakout
Combine OBV with a Bollinger Band breakout to confirm that the price move has real volume behind it. This filters out low-conviction breakouts.
[[actions]]
type = "open_long"
amount = "100 USDC"

  [[actions.triggers]]
  indicator = "price"
  operator = "cross_above"
  target = "bb_upper"
  timeframe = "1h"

  [[actions.triggers]]
  indicator = "obv"
  operator = ">"
  target = "obv_sma_20"
  timeframe = "1h"
Full OBV Strategy (Entry + Exit)
Enter on bullish OBV crossover with RSI confirmation, exit on bearish OBV crossover or fixed profit.
[meta]
name = "OBV_Volume_Momentum"
description = "Enter on OBV bullish cross + RSI dip, exit on bearish cross or +3%"

# ENTRY
[[actions]]
type = "open_long"
amount = "100 USDC"

  [[actions.triggers]]
  indicator = "obv"
  operator = "cross_above"
  target = "obv_sma_20"
  timeframe = "1h"

  [[actions.triggers]]
  indicator = "rsi_14"
  operator = "<"
  target = "40"
  timeframe = "1h"

# TAKE PROFIT
[[actions]]
type = "sell"
amount = "100%"

  [[actions.triggers]]
  type = "pos_price_change"
  value = "3%"

# VOLUME EXIT
[[actions]]
type = "sell"
amount = "100%"

  [[actions.triggers]]
  indicator = "obv"
  operator = "cross_below"
  target = "obv_sma_20"
  timeframe = "1h"
Tips
OBV's absolute value is meaningless. Whether OBV reads 500,000 or -2,000,000 tells you nothing on its own. What matters is: is it rising or falling? Always use OBV with its SMA or look at the slope of the line. The crossover against obv_sma_20 is the standard way to quantify direction changes.
A shorter SMA period (10) produces more crossovers -- more signals but more noise. A longer period (50) produces fewer, higher-confidence signals but reacts slower. obv_sma_20 is the standard starting point. Adjust based on backtest results for your specific pair and timeframe.
OBV shines as a confirmation layer for price-based signals. A price breakout above resistance combined with OBV crossing above its SMA is far more reliable than either signal alone. Volume confirms conviction -- use it to validate what price is telling you.