Volume SMA
Contents
Overview
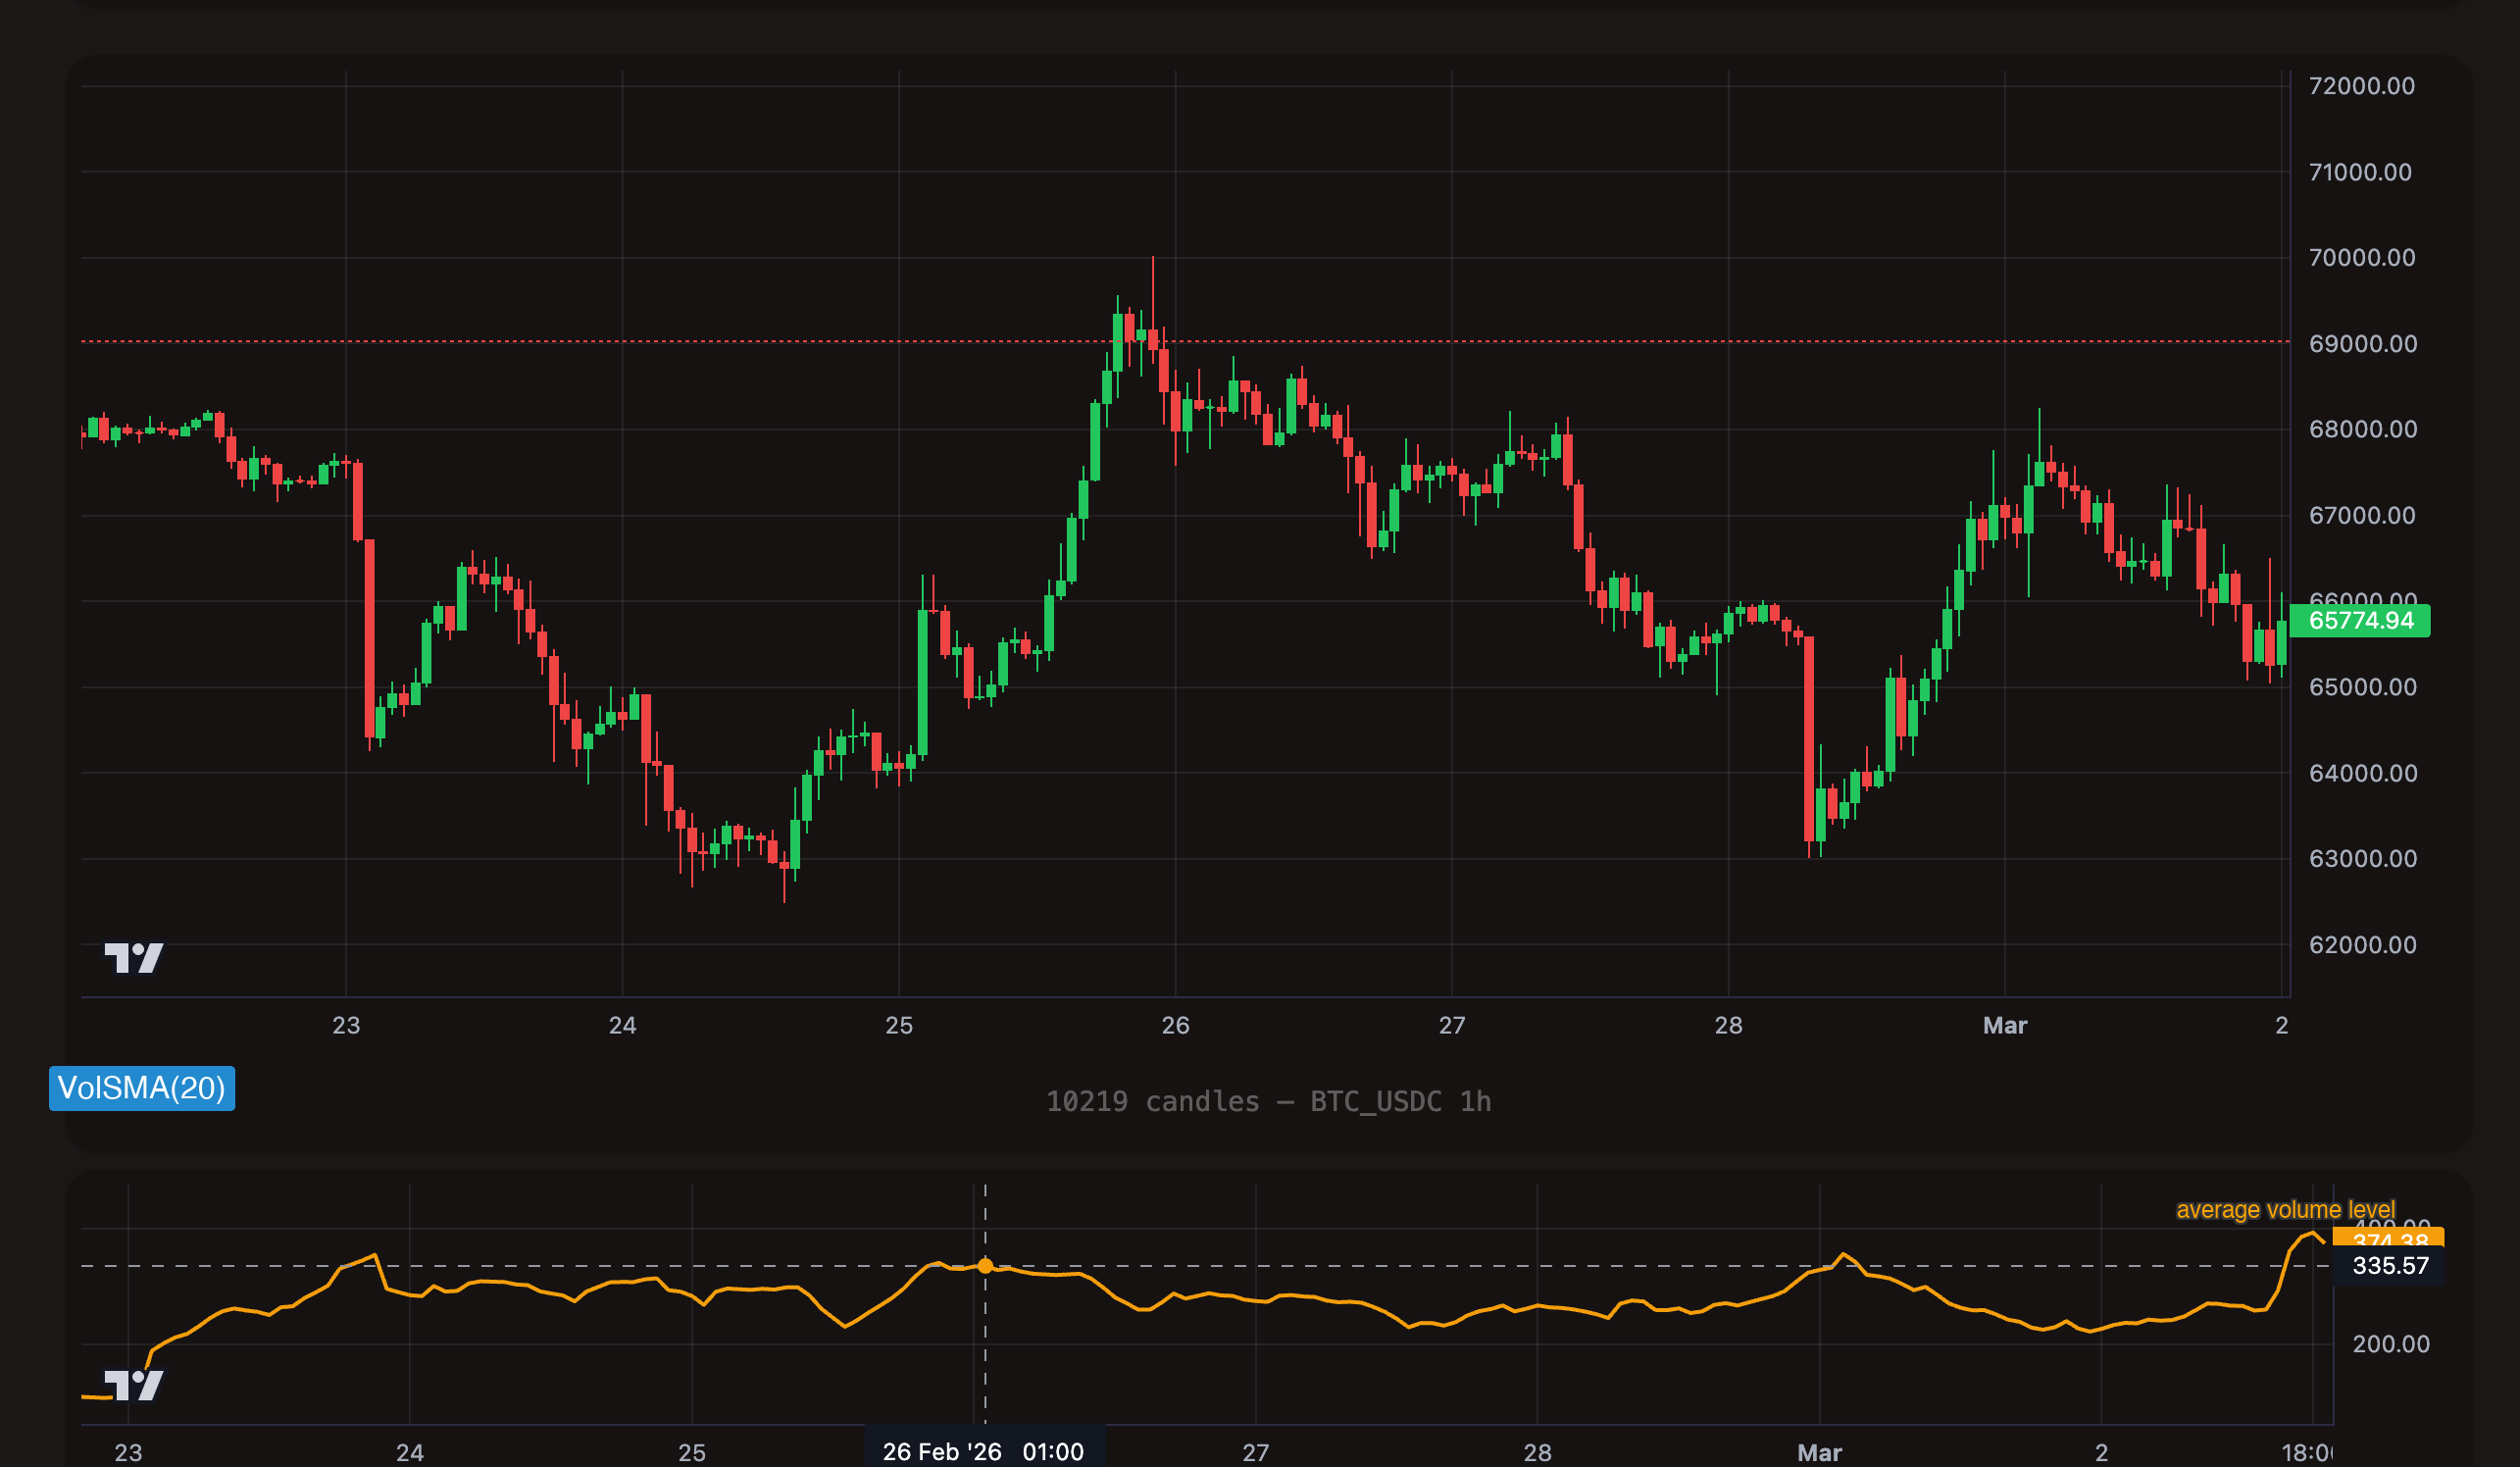
Volume SMA calculates the Simple Moving Average of trading volume over the last N candles. It establishes a baseline for what "normal" volume looks like, so you can detect when trading activity is unusually high or unusually low.
Volume is the fuel behind price moves. A price breakout on high volume carries conviction -- many participants are driving the move. A breakout on low volume is suspect -- it may lack the momentum to sustain itself and could reverse quickly.
By comparing current volume to its average, you turn raw volume into an actionable signal: is trading activity above or below normal right now?
Format
vol_sma_{period}
The period defines how many candles are averaged to establish the "normal" volume baseline.
| Example | Period | Use Case |
|---|---|---|
vol_sma_10 | 10 | Short window -- reacts quickly to volume changes |
vol_sma_20 | 20 | Standard -- smooth baseline for most strategies |
vol_sma_50 | 50 | Long window -- captures the broader volume trend |
Period range: 1 to 200.
Value range: 0+ (always positive, volume-denominated). The actual values depend entirely on the asset and timeframe. BTC on hourly candles might have a vol_sma_20 of 500 BTC. A small-cap altcoin might have a vol_sma_20 of 10,000 tokens. Never compare Volume SMA values across different pairs.
Volume SMA is denominated in the asset's trading volume units, not in price. The absolute values vary enormously between pairs and timeframes. When using Volume SMA as a target for comparison, you are comparing current volume to average volume on the same pair and timeframe -- the scale is always consistent within that context.
How Volume SMA Works
Current volume above Volume SMA: Trading activity is above the recent average. Something is happening -- a breakout, news event, or institutional activity. Price moves during above-average volume are more likely to sustain.
Current volume below Volume SMA: Trading activity is below the recent average. The market is quiet. Price moves during below-average volume often lack follow-through and may reverse. This is typical of consolidation phases.
Volume spike: When current volume crosses from below to above its SMA, a volume surge has begun. This is the event-based way to detect the start of unusual activity.
Volume drying up: When current volume drops below its SMA, the market is settling down. If this happens after a big move, it may signal that the move is losing steam.
Understanding Operators with Volume SMA
Volume SMA is typically used as a confirmation filter -- you pair it with a price-based trigger to ensure the price move has volume backing it.
> Above Average Volume -- State-Based
What it does: True on every candle where current volume exceeds the Volume SMA. Trading activity is above average.
[[actions.triggers]]
indicator = "vol_sma_20"
operator = ">"
target = "0"
timeframe = "1h"
The example above triggers whenever vol_sma_20 is positive, which is effectively always. In practice, you use Volume SMA as a target rather than the indicator. The typical pattern compares the current candle's volume to the SMA: use vol_sma_20 as a filter alongside price triggers to confirm that volume supports the move.
Typical use: Confirmation layer. Add this trigger to a price breakout action so it only fires when volume is elevated. "Buy when price breaks above the upper Bollinger Band AND volume is above average."
< Below Average Volume -- State-Based
What it does: True on every candle where current volume is below the Volume SMA. The market is quiet.
Typical use: Detect consolidation. Low-volume periods often precede breakouts. You can also use this to avoid entering trades during dead markets where price moves are unreliable.
cross_above -- Volume Spike Begins
What it does: Fires once at the exact candle where volume transitions from below the SMA to above it. A volume surge has just started.
[[actions.triggers]]
indicator = "vol_sma_20"
operator = "cross_above"
target = "0"
timeframe = "1h"
Typical use: Detect the start of a volume spike. Combine with a trend filter to determine if the spike is bullish or bearish. Volume alone does not tell you direction -- it tells you that something significant is happening.
cross_below -- Volume Returns to Normal
What it does: Fires once when volume drops from above the SMA to below it. The surge is ending.
Typical use: Detect when a high-volume event is winding down. Can be used as a trailing exit signal -- if you entered on a volume spike, exit when volume normalizes.
Volume SMA is almost always a supporting trigger, not a standalone entry signal. High volume confirms a move. Low volume warns of a fake-out. Pair volume triggers with price or momentum indicators for reliable strategies.
TOML Examples
Confirm Breakout with High Volume
Only enter on a Bollinger Band breakout when volume confirms the move. Price above the upper band with elevated volume signals a genuine breakout, not a low-conviction spike.
[[actions]]
type = "open_long"
amount = "100 USDC"

  [[actions.triggers]]
  indicator = "price"
  operator = "cross_above"
  target = "bb_upper"
  timeframe = "1h"

  [[actions.triggers]]
  indicator = "vol_sma_20"
  operator = ">"
  target = "0"
  timeframe = "1h"
Detect Low-Volume Consolidation
Avoid buying RSI dips during dead markets. Low volume + oversold RSI often means the market is drifting, not reversing. Wait for volume to confirm interest.
[[actions]]
type = "open_long"
amount = "100 USDC"

  [[actions.triggers]]
  indicator = "rsi_14"
  operator = "<"
  target = "30"
  timeframe = "1h"

  [[actions.triggers]]
  indicator = "obv"
  operator = ">"
  target = "obv_sma_20"
  timeframe = "1h"
Volume Spike Entry
Enter when a volume surge begins during an uptrend. The MACD filter ensures the trend is bullish, and the volume crossover catches the moment activity spikes.
[[actions]]
type = "open_long"
amount = "100 USDC"

  [[actions.triggers]]
  indicator = "macd_line"
  operator = ">"
  target = "0"
  timeframe = "1h"

  [[actions.triggers]]
  indicator = "vol_sma_20"
  operator = "cross_above"
  target = "0"
  timeframe = "1h"
Multi-Signal Breakout with Volume Confirmation
A high-confidence entry: price crosses above the 50-period SMA, MACD is bullish, and volume is above average. Three independent signals aligning greatly reduces false positives.
[[actions]]
type = "open_long"
amount = "100 USDC"

  [[actions.triggers]]
  indicator = "price"
  operator = "cross_above"
  target = "sma_50"
  timeframe = "1h"

  [[actions.triggers]]
  indicator = "macd_line"
  operator = ">"
  target = "0"
  timeframe = "1h"

  [[actions.triggers]]
  indicator = "vol_sma_20"
  operator = ">"
  target = "0"
  timeframe = "1h"
Tips
Volume SMA rarely makes sense as a standalone signal. It does not tell you direction -- only that activity is above or below normal. Always pair it with a directional indicator (MACD, SMA crossover, RSI) to determine whether the volume supports a bullish or bearish thesis.
Shorter periods (10) give you a more reactive baseline. Volume only needs to exceed the recent few candles to qualify as "above average." Good for catching quick spikes on lower timeframes.
Longer periods (50) establish a broader sense of normal. Volume needs to exceed a longer history to qualify as elevated. Better for filtering out noise on higher timeframes.
vol_sma_20 is the standard starting point for most strategies.
Volume SMA values are denominated in trading volume units, which vary enormously between assets. BTC might trade 500 units per hourly candle while a small-cap altcoin trades 50,000 tokens. Never hardcode absolute volume thresholds across different pairs. Use Volume SMA as a relative comparison within the same pair and timeframe.
One of the oldest principles in technical analysis: volume changes often precede price changes. A surge in volume during a consolidation phase -- before price breaks out -- can be an early warning that a significant move is about to begin. Watch for volume rising while price is flat.