RSI -- Relative Strength Index
Contents
Overview
The Relative Strength Index (RSI) is a momentum oscillator that measures the speed and magnitude of recent price changes. It answers one question: how strong is the current move compared to recent moves?
RSI is calculated by comparing the average size of recent gains to the average size of recent losses over a lookback period. The result is normalized to a scale of 0 to 100:
- RSI near 100 means almost all recent candles were bullish (strong upward momentum).
- RSI near 0 means almost all recent candles were bearish (strong downward momentum).
- RSI near 50 means gains and losses are roughly equal (no clear momentum).
The standard RSI period is 14, which looks at the last 14 candles. Shorter periods make RSI more reactive; longer periods make it smoother.

BTC/USDC 1-hour chart with RSI(14) displayed as a separate oscillator below the price chart. The horizontal lines at 70 (overbought) and 30 (oversold) mark the classic trading zones.
Format
rsi_{period}
The period defines how many candles RSI looks back to calculate average gains and losses.
| Example | Period | Use Case |
|---|---|---|
rsi_7 | 7 | Fast, reactive -- good for scalping on low timeframes |
rsi_14 | 14 | Standard -- the default for most strategies |
rsi_21 | 21 | Slower, smoother -- fewer false signals |
Period range: 1 to 200.
Value range: 0 to 100 (always).
RSI Zones
| RSI Range | Zone | Interpretation |
|---|---|---|
| Below 30 | Oversold | Price has dropped sharply relative to recent history. Selling pressure may be exhausted. Potential buy opportunity. |
| 30 -- 50 | Weak / Neutral | Below the midpoint. Momentum is bearish-leaning or undecided. |
| 50 -- 70 | Bullish | Above the midpoint. Momentum favors buyers. In a healthy uptrend, RSI typically stays in this range. |
| Above 70 | Overbought | Price has risen sharply relative to recent history. Buying pressure may be exhausted. Potential sell opportunity or caution zone. |
"Oversold" and "overbought" do not mean price must reverse. In a strong trend, RSI can stay oversold or overbought for extended periods. RSI below 30 during a crash can stay there for days. Always combine RSI with other confirmations.
Understanding Operators with RSI
Each operator behaves differently with RSI. Understanding the distinction is critical for building strategies that fire when you intend.
< (Less Than) -- State-Based
What it does: The trigger is true on every candle where RSI is below the threshold.
On the chart: Imagine the RSI line sitting below the horizontal 30 line. For as long as the line stays below 30, this trigger is active. If RSI stays below 30 for eight consecutive candles, the trigger fires on all eight.
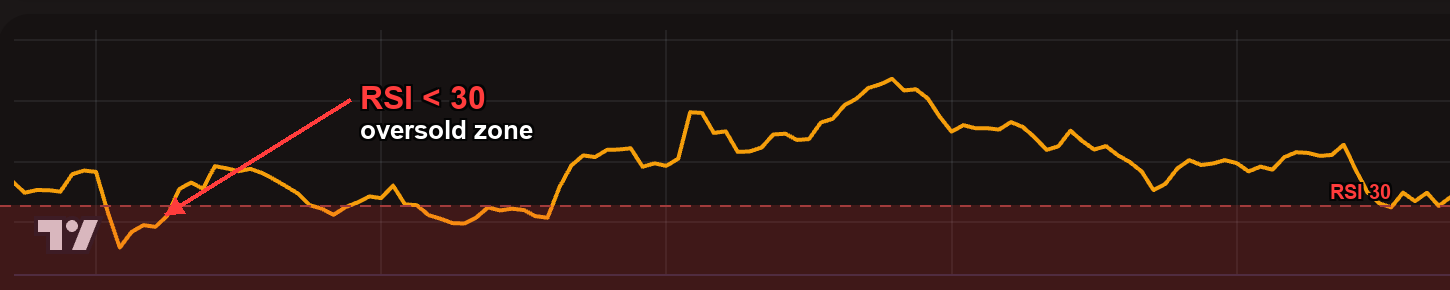
RSI(14) dipping below the 30 threshold — the oversold zone highlighted in red. While RSI remains below 30, the < operator fires on every candle.
[[actions.triggers]]
indicator = "rsi_14"
operator = "<"
target = "30"
Because < fires on every qualifying candle, an "open_long" action with rsi_14 < 30 could attempt to open a new position on each candle where RSI remains below 30. Use max_count to limit this, or use cross_below if you only want the initial dip.
> (Greater Than) -- State-Based
What it does: The trigger is true on every candle where RSI is above the threshold.
On the chart: The RSI line is above the horizontal 70 line. Every candle it stays there, this trigger fires.
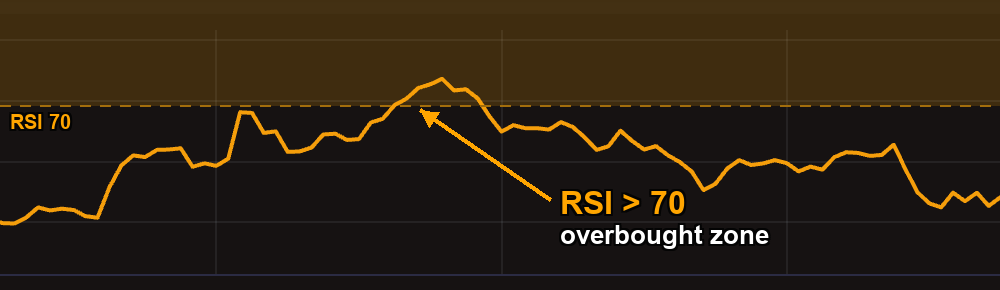
RSI(14) pushing above the 70 threshold — the overbought zone highlighted in orange. This is where selling pressure may start building.
[[actions.triggers]]
indicator = "rsi_14"
operator = ">"
target = "70"
Typical use: Sell when RSI is overbought. Combined with max_count = 1, it fires once when RSI first exceeds 70 and then stops.
cross_below -- Event-Based
What it does: Fires once, at the exact candle where RSI transitions from above the threshold to below it. The previous candle had RSI >= the target, and the current candle has RSI < the target.
On the chart: Picture the RSI line descending through the 70 line. The moment it pierces the line from above to below, this trigger fires -- and then goes silent until the next crossing.
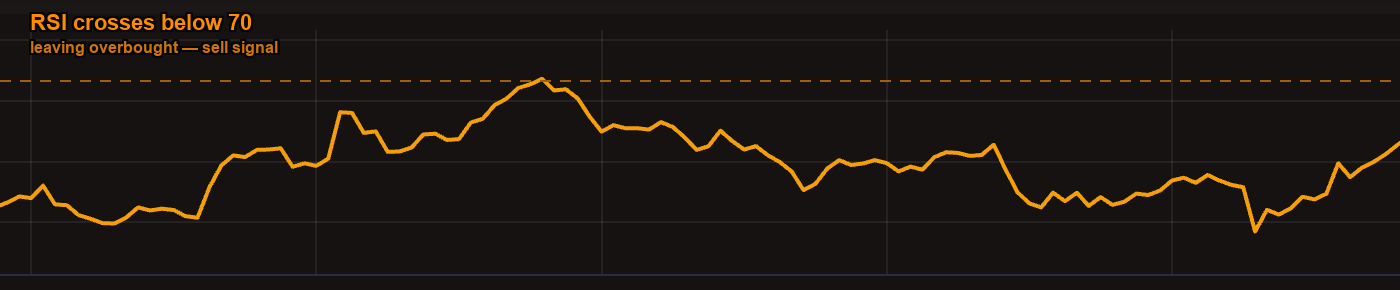
RSI(14) crossing below the 70 threshold — the moment momentum starts fading. This event-based signal fires once at the crossing candle.
[[actions.triggers]]
indicator = "rsi_14"
operator = "cross_below"
target = "70"
Typical use: Detect when RSI "leaves overbought territory." This is often a stronger sell signal than simply being above 70, because it captures the turning point -- the moment momentum starts fading.
cross_above -- Event-Based
What it does: Fires once, at the exact candle where RSI transitions from below the threshold to above it. The previous candle had RSI <= the target, and the current candle has RSI > the target.
On the chart: The RSI line climbing up through the 30 line. The moment it crosses from below to above, the trigger fires once.
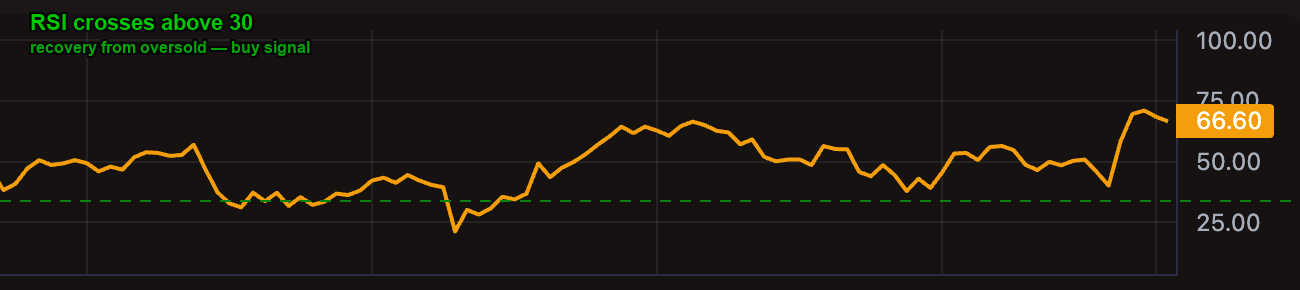
RSI(14) crossing above the 30 threshold — recovery from oversold. Rather than buying while RSI is still falling, this waits for the first sign of recovery.
[[actions.triggers]]
indicator = "rsi_14"
operator = "cross_above"
target = "30"
Typical use: Detect when RSI "recovers from oversold." Rather than buying while RSI is still falling, this waits for the first sign of recovery -- RSI turning back up through 30.
= (Equal) -- Not Recommended for RSI
Why: RSI produces floating-point values like 29.87 or 70.12. Exact equality (rsi_14 = 30) will almost never be true. Use < or > instead.
- Use
</>when you want to act while RSI is in a zone (state-based). Addmax_countto limit repeated firing. - Use
cross_above/cross_belowwhen you want to act at the moment RSI enters or leaves a zone (event-based). Nomax_countneeded -- crossovers fire once by nature.
TOML Examples
Buy on Oversold RSI
The simplest RSI strategy. Enter when RSI drops below 30 on the 1-hour chart.
[[actions]]
type = "open_long"
amount = "100 USDC"

  [[actions.triggers]]
  indicator = "rsi_14"
  operator = "<"
  target = "30"
  timeframe = "1h"
Sell on Overbought RSI
Exit when RSI exceeds 70. The max_count = 1 ensures this only fires once per position.
[[actions]]
type = "sell"
amount = "100%"

  [[actions.triggers]]
  indicator = "rsi_14"
  operator = ">"
  target = "70"
  max_count = 1
Buy on RSI Recovery (Cross Above 30)
Instead of buying while RSI is still falling, wait for the first sign of recovery.
[[actions]]
type = "open_long"
amount = "100 USDC"

  [[actions.triggers]]
  indicator = "rsi_14"
  operator = "cross_above"
  target = "30"
  timeframe = "1h"
Sell on Leaving Overbought (Cross Below 70)
Sell at the moment RSI drops back below 70 -- the overbought momentum is fading.
[[actions]]
type = "sell"
amount = "100%"

  [[actions.triggers]]
  indicator = "rsi_14"
  operator = "cross_below"
  target = "70"
  timeframe = "1h"
StochRSI Extreme Dip
StochRSI is more sensitive than regular RSI and reaches extremes more often. This catches deep short-term dips.
[[actions]]
type = "open_long"
amount = "50 USDC"

  [[actions.triggers]]
  indicator = "stoch_rsi_14"
  operator = "<"
  target = "10"
  timeframe = "5m"
  max_count = 1
RSI with Trend Filter
Only buy RSI dips when the macro trend is bullish (daily SMA 50 above SMA 200).
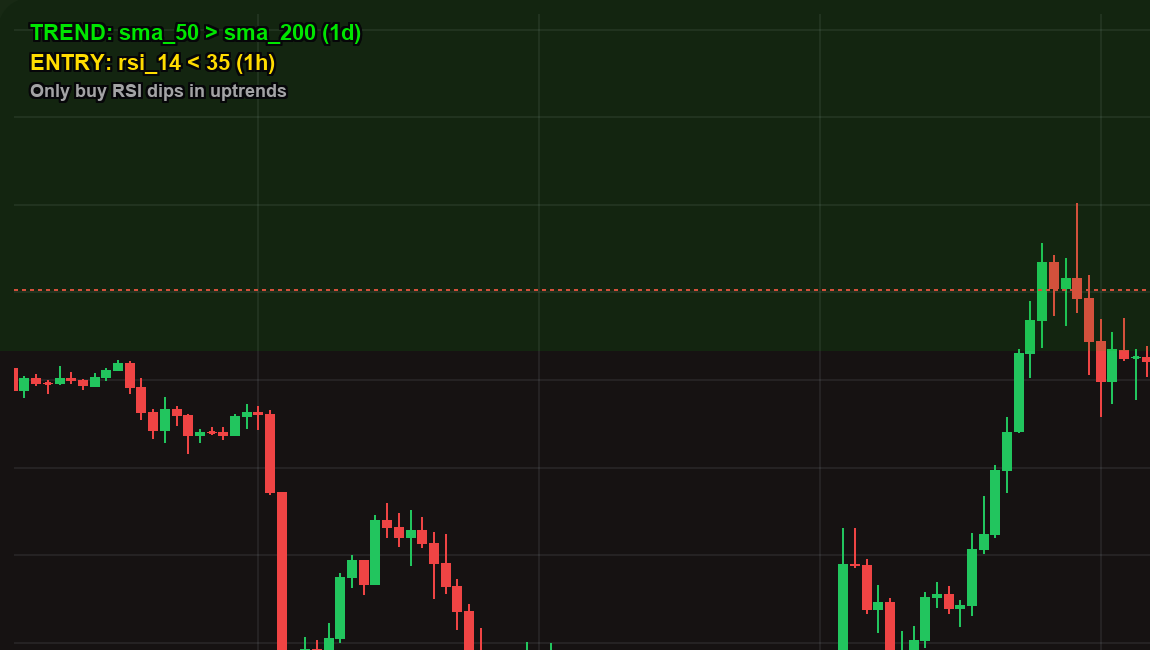
Multi-timeframe confirmation: the daily SMA crossover confirms the macro uptrend, while the hourly RSI catches dip entries within that trend. This "trend-safe DCA" pattern avoids buying into falling markets.
[[actions]]
type = "open_long"
amount = "100 USDC"

  [[actions.triggers]]
  indicator = "rsi_14"
  operator = "<"
  target = "35"
  timeframe = "1h"

  [[actions.triggers]]
  indicator = "sma_50"
  operator = ">"
  target = "sma_200"
  timeframe = "1d"
Tips
Shorter periods (7, 9) make RSI oscillate faster between extremes. You get more signals, but more of them are false. Best suited for scalping on lower timeframes (1m, 5m).
Longer periods (21, 28) smooth out RSI and produce fewer, more reliable signals. Better for swing trading on higher timeframes (4h, 1d).
RSI(14) is the standard middle ground. Start here and adjust based on backtest results.
RSI works best as a timing tool within a confirmed trend, not as a standalone signal. RSI < 30 in a strong downtrend is often a trap -- price can stay oversold for days. Pair RSI entries with a trend filter like sma_50 > sma_200 on the daily chart to avoid buying into falling markets.
A powerful pattern is to sell in stages: sell 50% at RSI > 50 (partial profit) and sell the remaining 100% at RSI > 70 (full exit). This captures more upside on strong bounces while locking in some profit early.