MACD -- Moving Average Convergence Divergence
Contents
Overview
MACD is a trend-following momentum indicator that reveals the relationship between two exponential moving averages of price. It answers the question: is short-term momentum accelerating or decelerating relative to the longer-term trend?
MACD produces three components that work together:
- MACD Line -- the difference between the 12-period EMA and the 26-period EMA. When the fast EMA pulls away from the slow EMA, the MACD line moves further from zero. When they converge, it moves toward zero.
- Signal Line -- a 9-period EMA of the MACD line itself. It acts as a smoothed version of the MACD line and is used for crossover signals.
- Histogram -- the difference between the MACD line and the signal line, displayed as bars. It visualizes how far apart the two lines are and how quickly they are converging or diverging.
The interplay between these three components gives traders a rich view of momentum, trend direction, and potential turning points.
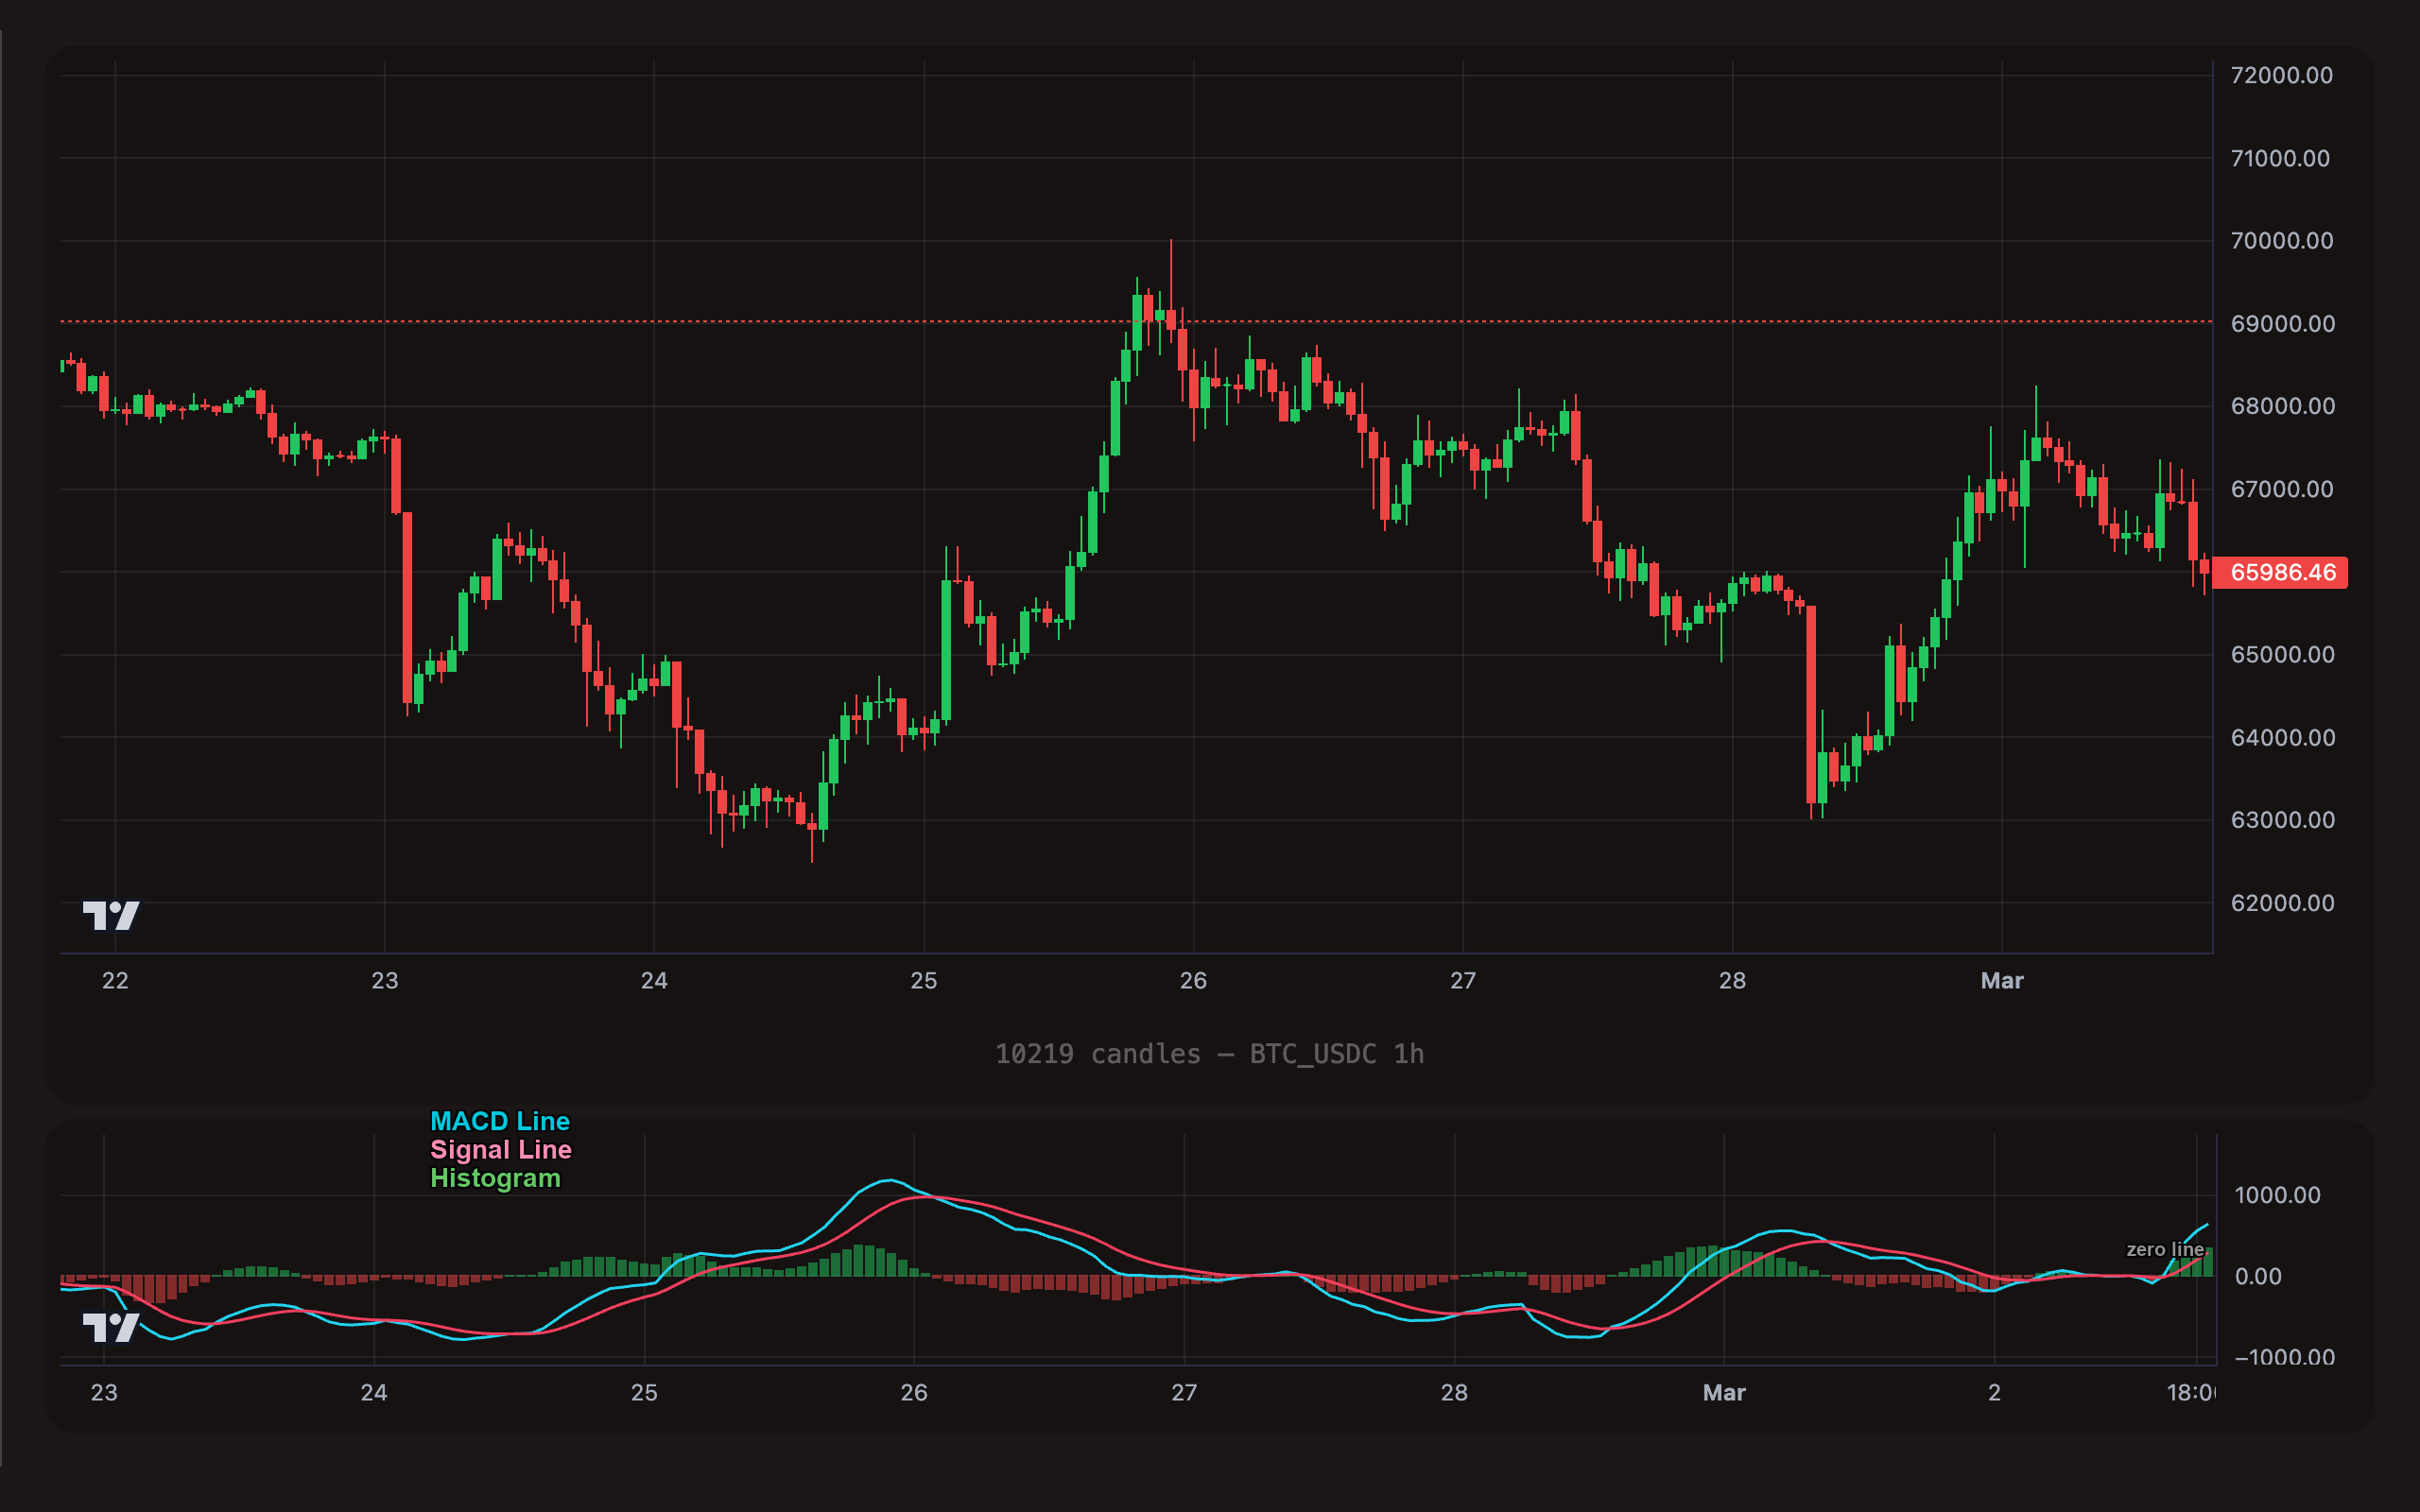
BTC/USDC 1-hour chart with MACD displayed below. The MACD line (cyan), signal line (pink), and histogram (green bars) show momentum and trend direction. The zero line separates bullish (above) from bearish (below) territory.
Components
| Component | TOML Format | Calculation | What It Shows |
|---|---|---|---|
| MACD Line | macd_line | EMA(12) minus EMA(26) | Direction and strength of short-term momentum relative to the longer-term trend. Positive = bullish, negative = bearish. |
| Signal Line | macd_signal | 9-period EMA of macd_line | A smoothed lagging reference for the MACD line. Crossovers between these two lines generate buy/sell signals. |
| Histogram | macd_histogram | macd_line minus macd_signal | The gap between the MACD and signal lines. Growing histogram = momentum increasing. Shrinking histogram = momentum fading. |
MACD uses fixed parameters (12/26/9). You cannot customize the EMA periods. The format is always macd_line, macd_signal, or macd_histogram -- there is no period suffix.
Value range: MACD values are unbounded. They can be positive or negative, and the magnitude depends on the asset's price. For BTC, MACD values might range from -500 to +500 on hourly candles. The zero line is the critical reference point: MACD above zero means the 12-period EMA is above the 26-period EMA (bullish); below zero means bearish.
Reading the MACD Chart
Understanding how the three components relate visually is key to using MACD effectively.
MACD Line above Signal Line:
- The histogram bars are positive (above the zero line).
- Momentum is bullish -- short-term price action is outpacing the smoothed average.
MACD Line below Signal Line:
- The histogram bars are negative (below the zero line).
- Momentum is bearish -- short-term price action is lagging behind the smoothed average.
MACD Line above Zero:
- The 12-period EMA is above the 26-period EMA.
- The overall short-to-medium-term trend is bullish.
MACD Line below Zero:
- The 12-period EMA is below the 26-period EMA.
- The overall short-to-medium-term trend is bearish.
Histogram growing (bars getting taller):
- The MACD line is pulling away from the signal line.
- Momentum is accelerating in the current direction.
Histogram shrinking (bars getting shorter):
- The MACD line is moving toward the signal line.
- Momentum is decelerating. A crossover may be approaching.
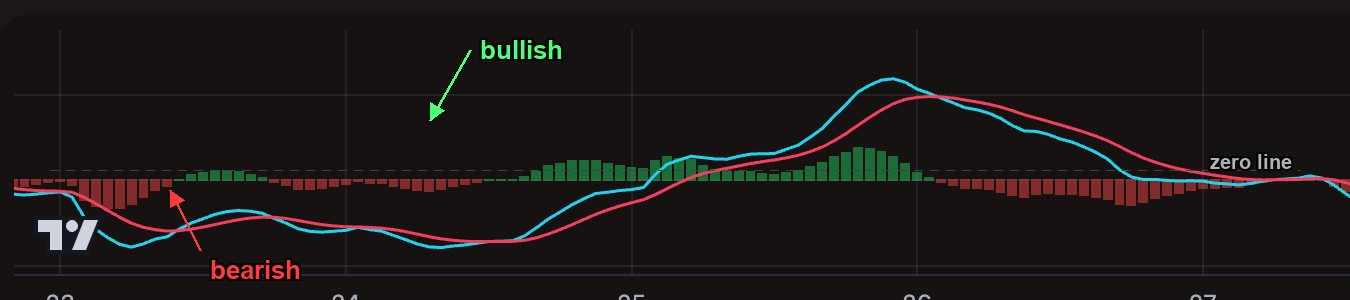
The MACD histogram visualizes momentum direction. Green bars above zero = bullish momentum. Red bars below zero = bearish momentum. Watch for bars shrinking as an early warning of a crossover.
Understanding Operators with MACD
cross_above -- Event-Based
This is the most important MACD operator. It fires at the exact candle where one component crosses above another.
MACD Line crosses above Signal Line (Bullish Crossover):
On the chart, look for where the blue MACD line crosses above the orange signal line. At that moment, the histogram flips from negative to positive. This is the classic MACD buy signal -- short-term momentum has turned bullish.
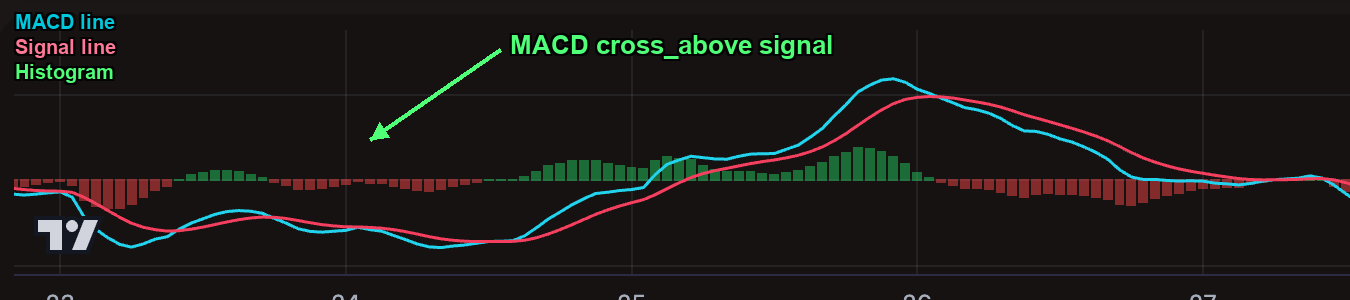
The MACD line (cyan) crosses above the signal line (pink) — a bullish crossover. The histogram flips from negative to positive at this moment.
[[actions.triggers]]
indicator = "macd_line"
operator = "cross_above"
target = "macd_signal"
timeframe = "1h"
MACD Line crosses above the Zero Line:
On the chart, the MACD line moves from below zero to above zero. This is a stronger confirmation than the signal crossover -- it means the 12-period EMA has actually crossed above the 26-period EMA. The trend itself has shifted bullish, not just the momentum.
[[actions.triggers]]
indicator = "macd_line"
operator = "cross_above"
target = "0"
timeframe = "4h"
cross_below -- Event-Based
The mirror of cross_above. Fires at the moment of a downward crossing.
MACD Line crosses below Signal Line (Bearish Crossover):
The MACD line dips below the signal line. The histogram flips negative. Momentum has turned bearish.
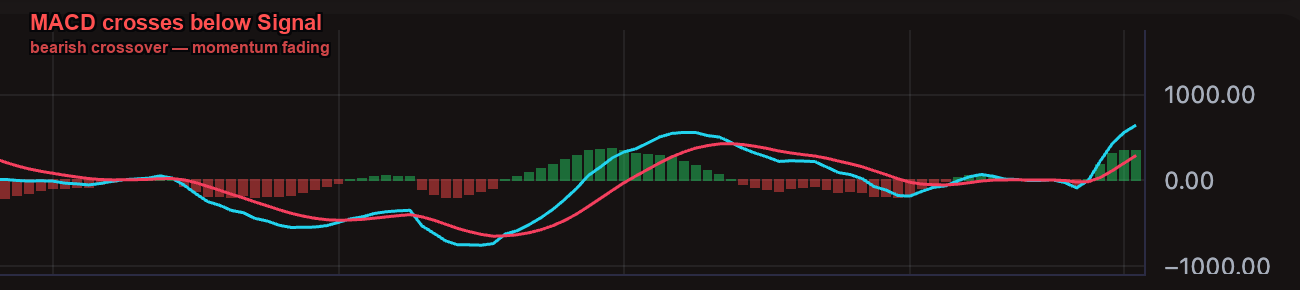
The MACD line crosses below the signal line — a bearish crossover. Momentum has turned negative and the histogram bars flip to the downside.
[[actions.triggers]]
indicator = "macd_line"
operator = "cross_below"
target = "macd_signal"
timeframe = "1h"
MACD Line crosses below Zero:
The trend itself has shifted bearish. The 12-period EMA has dropped below the 26-period EMA.
[[actions.triggers]]
indicator = "macd_line"
operator = "cross_below"
target = "0"
timeframe = "4h"
> (Greater Than) -- State-Based
True on every candle where the condition holds. Useful for trend filters rather than entry signals.
MACD Line above Zero = Bullish bias:
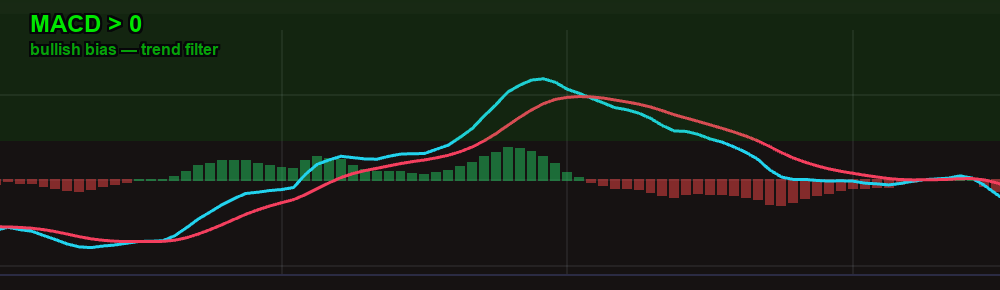
MACD line above the zero line — the 12-period EMA is above the 26-period EMA, confirming a bullish bias. Use this as a trend filter for other entry triggers.
[[actions.triggers]]
indicator = "macd_line"
operator = ">"
target = "0"
This fires on every candle where MACD is positive. Use it as a filter alongside other entry triggers -- "only buy when the overall MACD trend is bullish."
Histogram above Zero = Bullish momentum:
[[actions.triggers]]
indicator = "macd_histogram"
operator = ">"
target = "0"
The histogram is positive whenever the MACD line is above the signal line. Using > with the histogram is equivalent to saying "MACD momentum is currently bullish."
< (Less Than) -- State-Based
True on every candle where the condition holds.
MACD Line below Zero = Bearish bias:
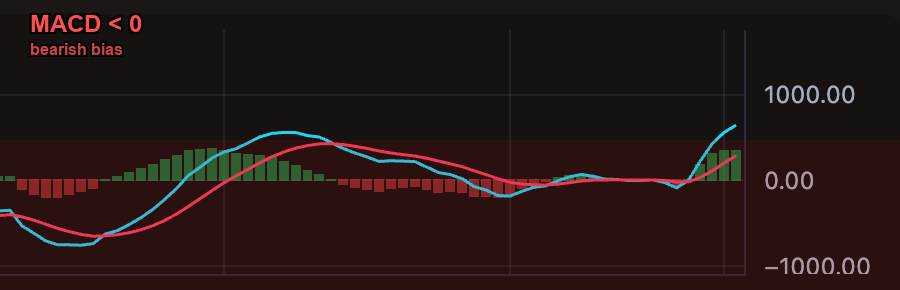
MACD line below the zero line — bearish bias. The 12-period EMA is below the 26-period EMA, confirming a downtrend.
[[actions.triggers]]
indicator = "macd_line"
operator = "<"
target = "0"
Histogram below Zero = Bearish momentum:
[[actions.triggers]]
indicator = "macd_histogram"
operator = "<"
target = "0"
Use cross_above / cross_below for entry and exit signals -- they fire once at the turning point. Use > / < as filters that confirm the current trend direction for another trigger. For example: "buy when RSI < 30 AND macd_line > 0" uses MACD as a bullish trend gate.
TOML Examples
Bullish Crossover Entry
Enter when the MACD line crosses above the signal line on the 1-hour chart. This is the most common MACD strategy.
[[actions]]
type = "open_long"
amount = "100 USDC"

  [[actions.triggers]]
  indicator = "macd_line"
  operator = "cross_above"
  target = "macd_signal"
  timeframe = "1h"
Bearish Crossover Exit
Exit the position when MACD momentum reverses. This acts as a dynamic stop-loss -- instead of a fixed percentage, you exit when the momentum signal that justified your entry flips bearish.
[[actions]]
type = "sell"
amount = "100%"

  [[actions.triggers]]
  indicator = "macd_line"
  operator = "cross_below"
  target = "macd_signal"
  timeframe = "1h"
Zero-Line Cross Entry
A more conservative entry than the signal crossover. Waits for the MACD line to cross above zero, confirming that the 12-period EMA is above the 26-period EMA.
[[actions]]
type = "open_long"
amount = "100 USDC"

  [[actions.triggers]]
  indicator = "macd_line"
  operator = "cross_above"
  target = "0"
  timeframe = "4h"
Histogram Turns Positive
Buy when the MACD histogram crosses above zero. This is equivalent to the MACD line crossing above the signal line but expressed through the histogram component.
[[actions]]
type = "open_long"
amount = "100 USDC"

  [[actions.triggers]]
  indicator = "macd_histogram"
  operator = "cross_above"
  target = "0"
  timeframe = "1h"
MACD as Trend Filter with RSI Entry
Use MACD above zero as a bullish trend gate, and RSI for timing the entry. This avoids buying RSI dips in a bearish trend.
[[actions]]
type = "open_long"
amount = "100 USDC"

  [[actions.triggers]]
  indicator = "macd_line"
  operator = ">"
  target = "0"
  timeframe = "1h"

  [[actions.triggers]]
  indicator = "rsi_14"
  operator = "<"
  target = "35"
  timeframe = "1h"
Full MACD Strategy (Entry + Exit)
Enter on bullish crossover, exit on bearish crossover or fixed profit target -- whichever comes first.
[meta]
name = "MACD_Momentum"
description = "Enter on MACD bullish cross, exit on bearish cross or +3%"

# ENTRY
[[actions]]
type = "open_long"
amount = "100 USDC"

  [[actions.triggers]]
  indicator = "macd_line"
  operator = "cross_above"
  target = "macd_signal"
  timeframe = "1h"

# TAKE PROFIT
[[actions]]
type = "sell"
amount = "100%"

  [[actions.triggers]]
  type = "pos_price_change"
  value = "3%"

# MOMENTUM EXIT
[[actions]]
type = "sell"
amount = "100%"

  [[actions.triggers]]
  indicator = "macd_line"
  operator = "cross_below"
  target = "macd_signal"
  timeframe = "1h"
Tips
MACD was designed for daily charts but works well on hourly and 4-hour candles in crypto. On very short timeframes (1m, 5m), MACD crossovers happen frequently and most are noise. Stick to 1h or higher for reliable MACD signals.
The signal crossover (macd_line cross_above macd_signal) is the earlier, more aggressive signal. The zero-line crossover (macd_line cross_above 0) is later but confirms the actual trend shift. Use signal crossovers for faster entries and zero-line crossovers for higher-confidence entries.
The histogram starts shrinking before a crossover happens. If you see the histogram bars getting shorter, momentum is fading -- a crossover (and potential exit signal) may be approaching. This gives you a visual heads-up before the signal fires.
MACD performs poorly in sideways, choppy markets. The MACD line oscillates around zero, generating frequent false crossovers. If you see the MACD line hugging the zero line with tiny crossovers, the market is likely ranging -- consider pausing the strategy or adding a volatility filter (e.g., ATR above a threshold).
Because MACD is built from EMAs, it inherently lags price. A MACD bullish crossover confirms that a move has already started -- it does not predict the future. By the time MACD signals "buy," price may have already moved 2-5% off the bottom. Accept this lag as the cost of confirmation, or combine MACD with a leading indicator like RSI for earlier entries.