Bollinger Bands
Contents
Overview
Bollinger Bands are a volatility-based indicator that creates a dynamic envelope around price. The indicator consists of three lines:
- Middle band -- a 20-period Simple Moving Average (SMA) of the closing price.
- Upper band -- the middle band plus 2 standard deviations.
- Lower band -- the middle band minus 2 standard deviations.
Because the bands are derived from standard deviation, they automatically widen when the market is volatile and narrow (squeeze) when the market is calm. Roughly 95% of price action stays within the bands under normal conditions, so a move outside them is statistically significant.
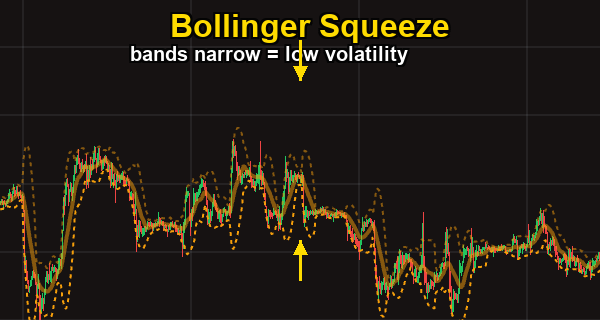
A Bollinger Squeeze — the bands narrow when volatility drops. This compression often precedes a strong breakout move in either direction.
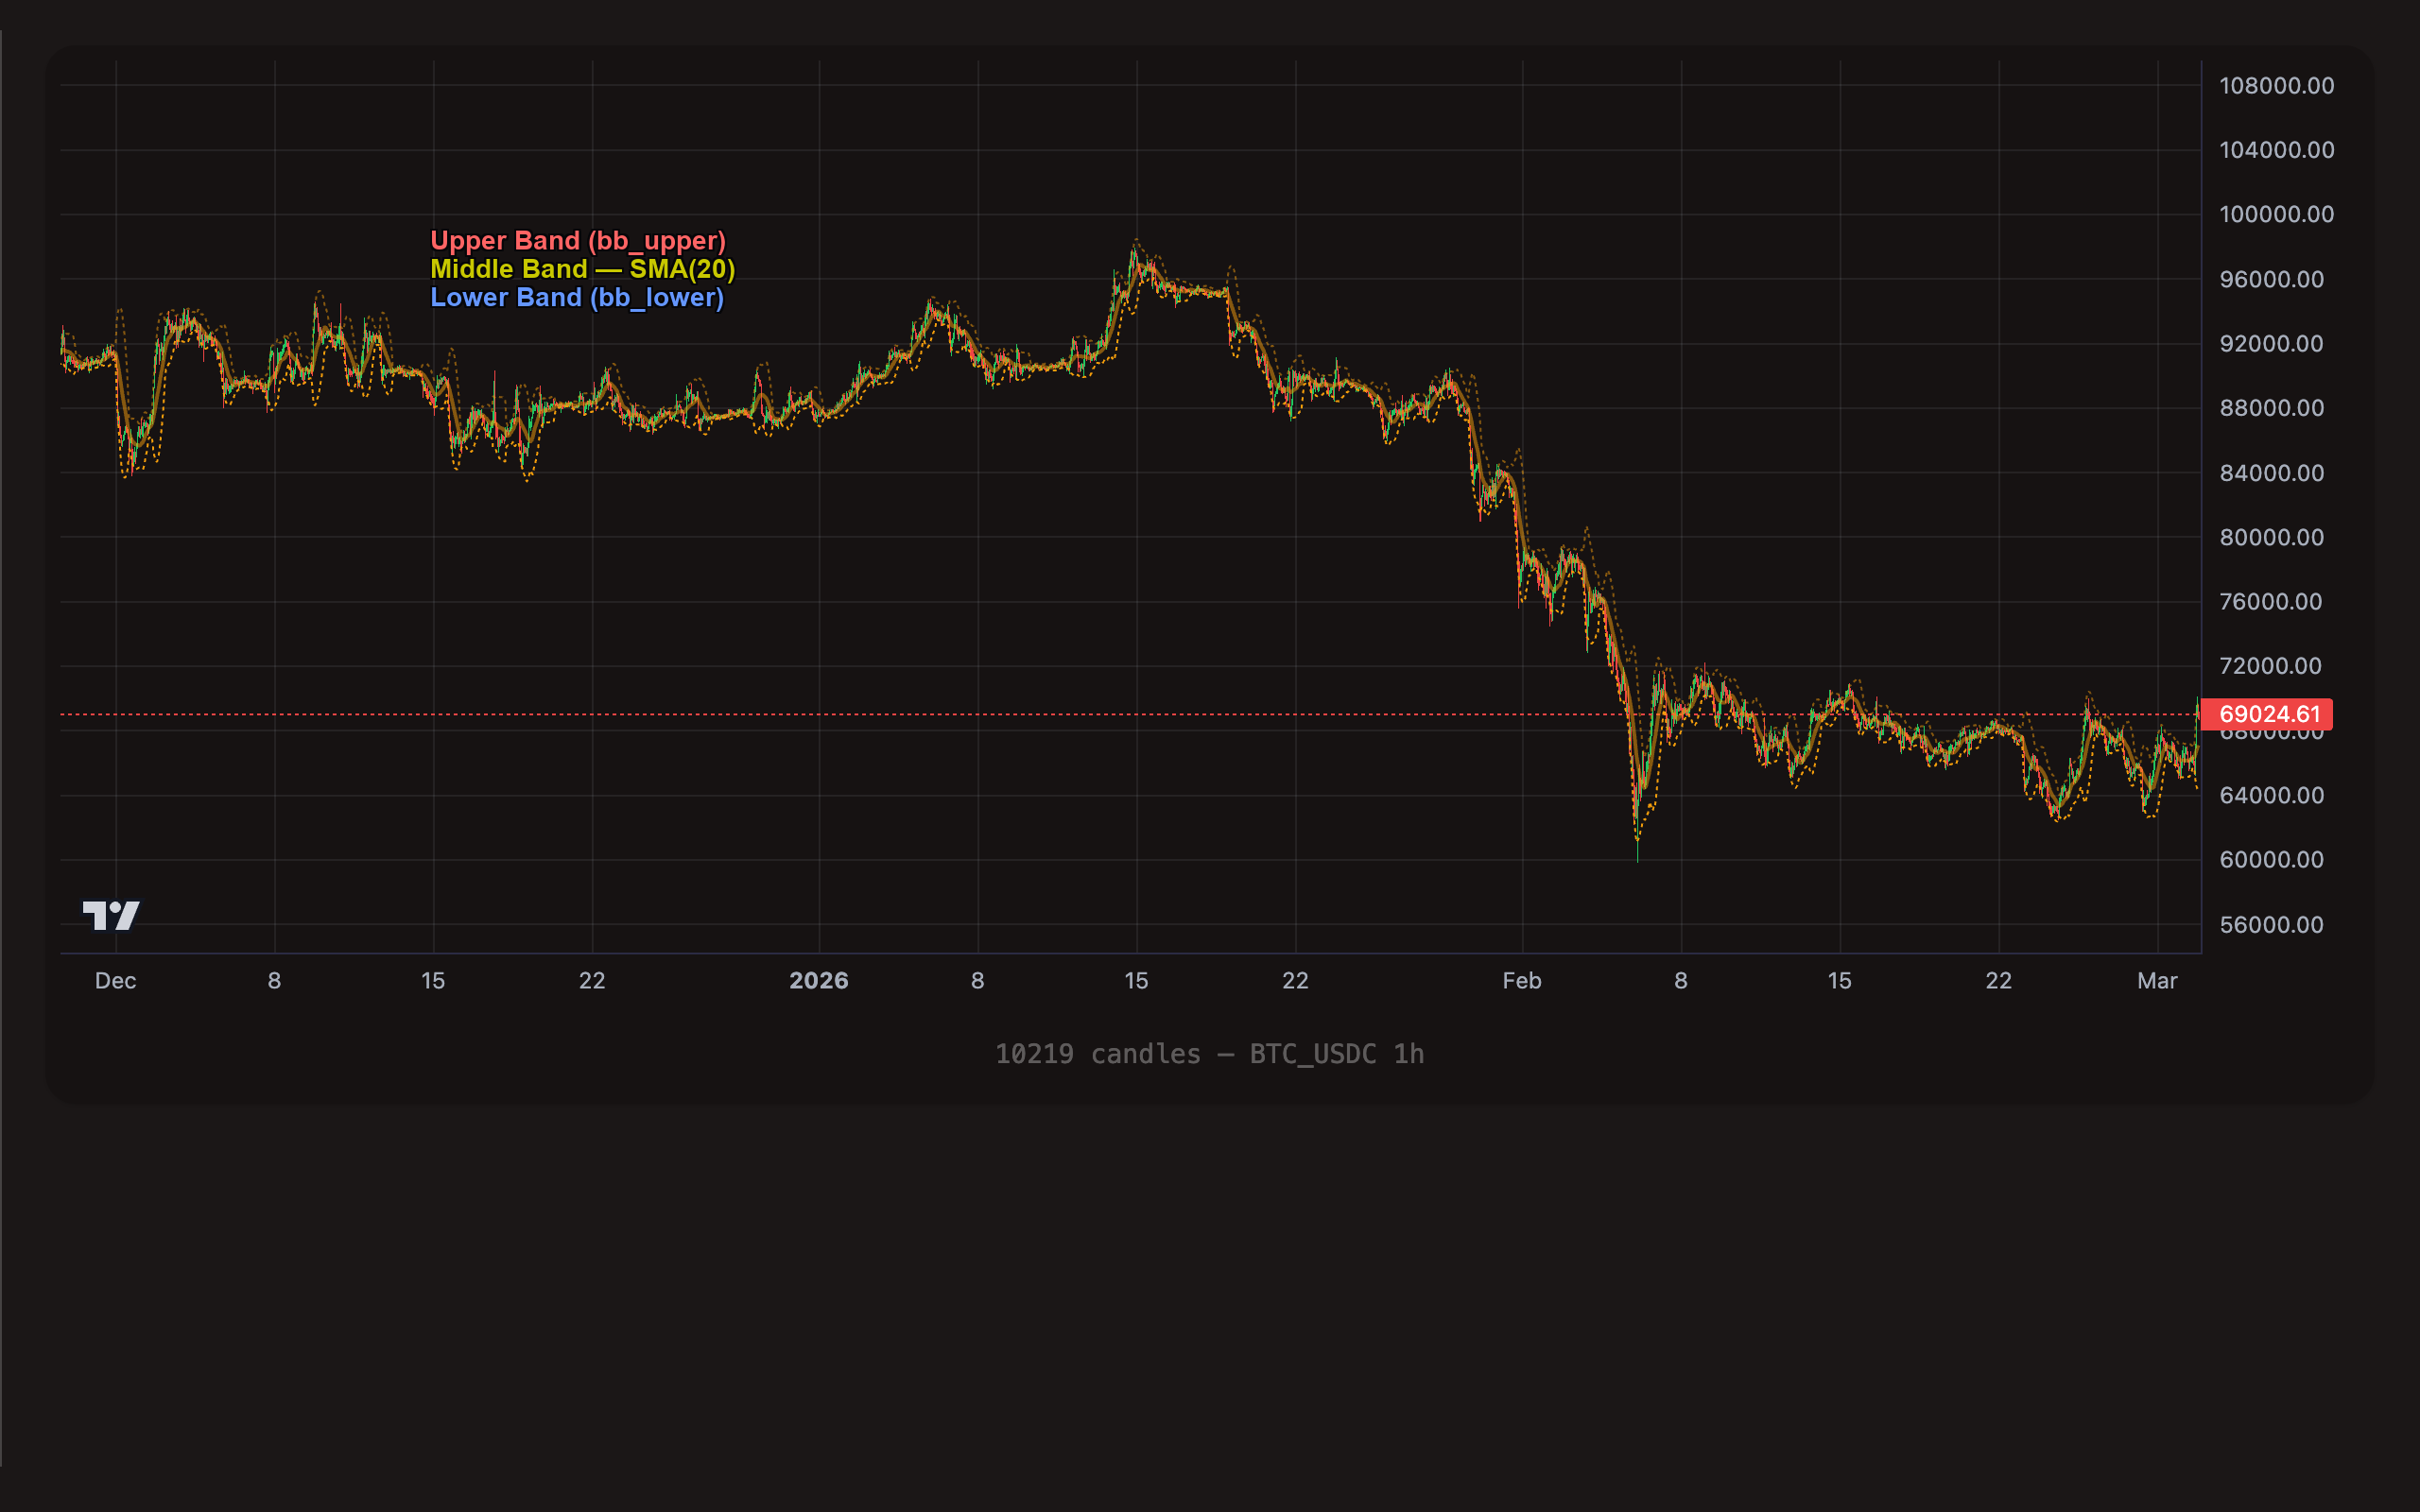
BTC/USDC 1-hour chart with Bollinger Bands. The upper band (bb_upper), middle band (SMA 20), and lower band (bb_lower) create a dynamic envelope around price. Notice how the bands widen during volatile periods and squeeze during consolidation.
Components
| Component | TOML Format | Description |
|---|---|---|
| Upper Band | bb_upper | Middle band + 2 standard deviations. Acts as dynamic resistance. |
| Middle Band | bb_middle | 20-period SMA. The "fair value" center line. |
| Lower Band | bb_lower | Middle band - 2 standard deviations. Acts as dynamic support. |
All three components can be used as either the indicator or the target in a trigger.
Bollinger Bands use fixed parameters: 20-period lookback and 2 standard deviations. You cannot change these values -- the format is always bb_upper, bb_middle, or bb_lower.
Understanding Operators with Bollinger Bands
Bollinger Bands are price-level indicators, so they pair naturally with comparison and crossover operators. Here is how each operator behaves in context:
< -- Price Below a Band
price < bb_lower
Price drops below the lower band. On the chart, the candle closes below the bottom line of the envelope. This is the classic Bollinger Bounce buy signal -- price has moved more than 2 standard deviations below the mean and is statistically likely to revert.
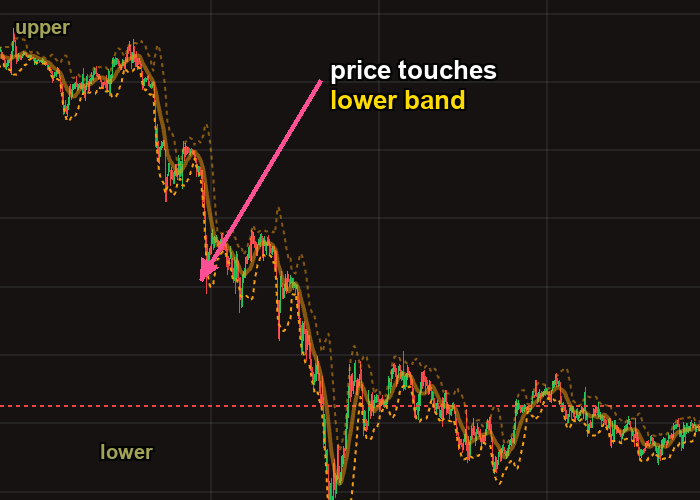
Price dropping to touch the lower Bollinger Band — a potential mean-reversion buy signal. The upper and lower bands define the 2-standard-deviation envelope.
This is a state-based operator. It fires on every candle where price remains below the band. Use max_count if you only want it to fire once per position.
> -- Price Above a Band
price > bb_upper
Price breaks above the upper band. This can signal either a breakout (strong momentum continuing upward) or an overbought condition (price extended too far and likely to pull back). Context matters -- in a strong uptrend, price can ride the upper band for extended periods.
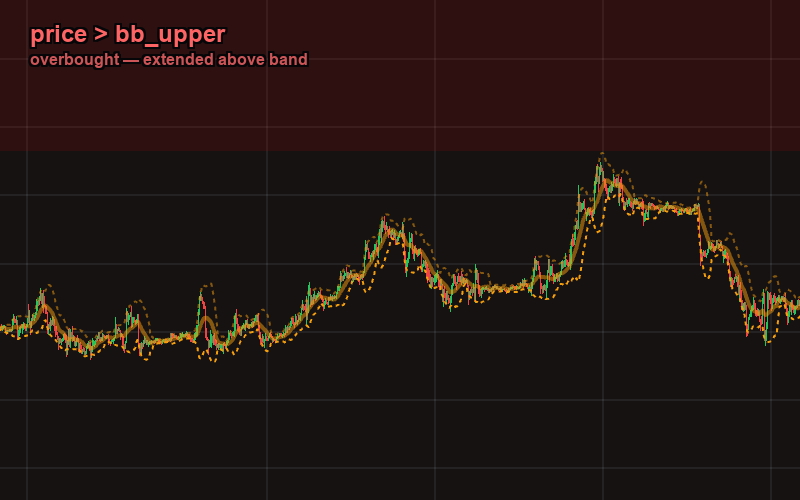
Price extending above the upper Bollinger Band — overbought territory. The red zone highlights where price has moved more than 2 standard deviations above the mean.
cross_below -- Crossing Below a Band
price cross_below bb_lower
Price crosses from above to below the lower band. This is an event-based operator -- it fires exactly once at the moment the crossing happens. On the previous candle, price was at or above bb_lower; on the current candle, price is below it.
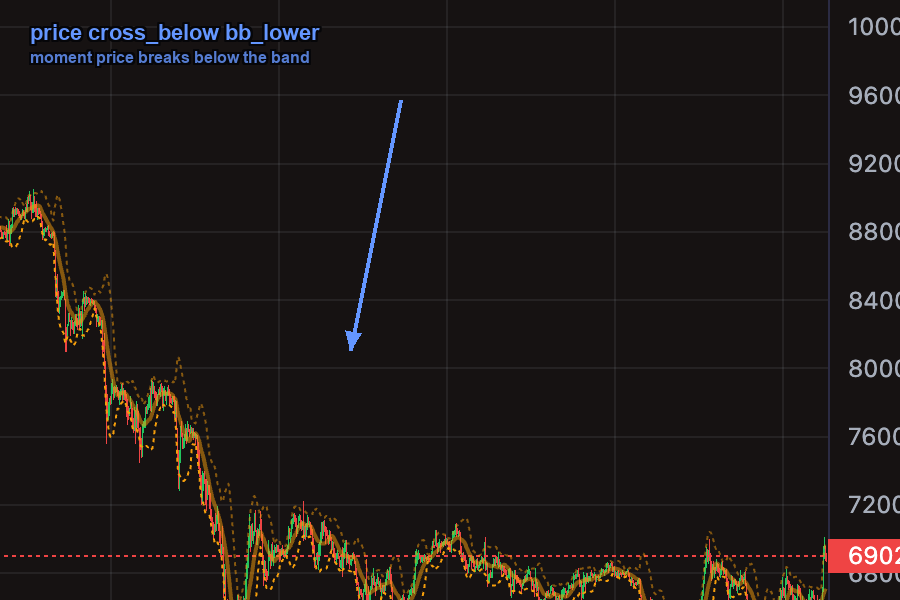
The moment price breaks below the lower Bollinger Band — an event-based signal that fires once at the crossing candle. Use this instead of < when you want the precise breakout moment.
Use this instead of < when you want to catch the precise moment price breaks below the band rather than the sustained condition of being below it.
cross_above -- Crossing Above a Band
price cross_above bb_middle
Price crosses from below to above the middle band. This is a mean reversion confirmation signal -- after a dip below the lower band, price crossing back above the middle band confirms that the reversion is underway. This is an event-based operator and fires once at the crossing.
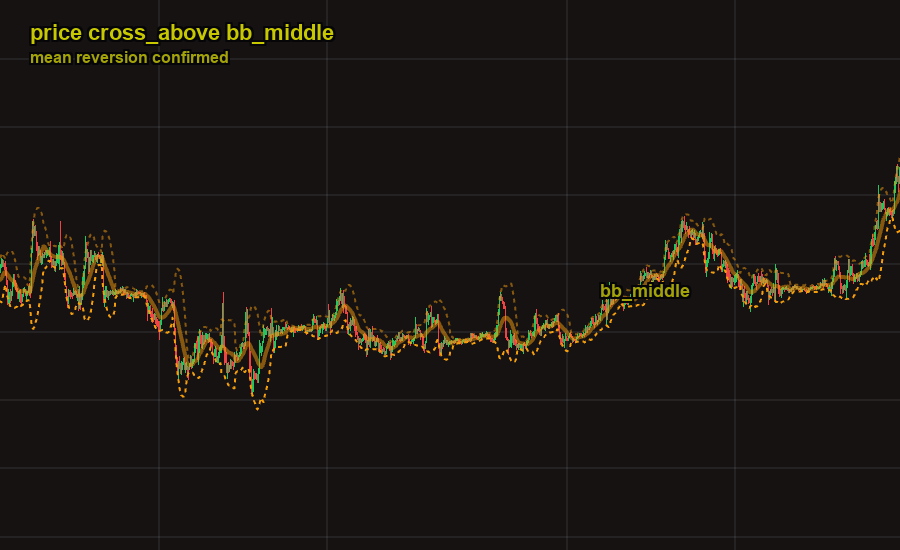
Price crossing back above the middle Bollinger Band (SMA 20) — mean reversion confirmed. After touching the lower band, this crossing signals the recovery is underway.
The direction you read a trigger matters. bb_lower > price is equivalent to price < bb_lower -- both mean "price is below the lower Bollinger Band." Botmarley reads left-to-right: indicator operator target.
TOML Examples
Buy When Price Drops Below Lower Band
The classic Bollinger Bounce entry. Price below the lower band means it is extended more than 2 standard deviations from the mean.
[[actions]]
type = "open_long"
amount = "100 USDC"

[[actions.triggers]]
indicator = "price"
operator = "<"
target = "bb_lower"
timeframe = "1h"
Alternative Form -- Lower Band Above Price
This is identical in meaning to the example above but written with the indicator and target swapped:
[[actions.triggers]]
indicator = "bb_lower"
operator = ">"
target = "price"
timeframe = "1h"
Sell When Price Breaks Above Upper Band
Price above the upper band may indicate an overbought condition -- a good time to take profit.
[[actions]]
type = "sell"
amount = "50%"

[[actions.triggers]]
indicator = "price"
operator = ">"
target = "bb_upper"
timeframe = "1h"
Mean Reversion -- Price Crosses Back Above Middle Band
After a dip below the lower band, wait for price to cross back above the middle band before entering. This confirms the reversion is in progress rather than catching a still-falling knife.
[[actions]]
type = "open_long"
amount = "100 USDC"

[[actions.triggers]]
indicator = "price"
operator = "cross_above"
target = "bb_middle"
timeframe = "1h"
Bollinger Bounce with RSI Confirmation
Combine Bollinger Bands with RSI to filter out false signals. Only buy when price is below the lower band AND RSI confirms oversold conditions.
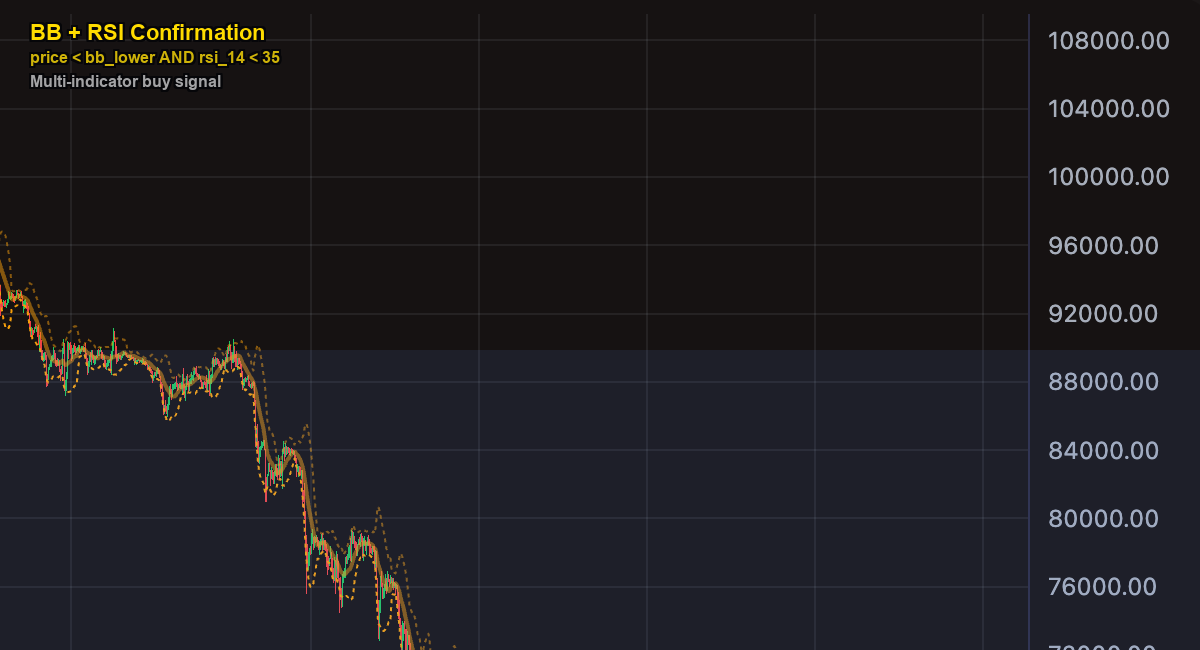
Multi-indicator confirmation: price below the lower Bollinger Band AND RSI below 35. Combining two independent signals filters out false positives and increases the reliability of the entry.
[[actions]]
type = "open_long"
amount = "100 USDC"

[[actions.triggers]]
indicator = "price"
operator = "<"
target = "bb_lower"
timeframe = "1h"

[[actions.triggers]]
indicator = "rsi_14"
operator = "<"
target = "35"
timeframe = "1h"
Tips
There are two opposing strategies with Bollinger Bands:
- Bollinger Bounce -- buy when price touches the lower band, expecting a reversion to the middle. Works best in ranging, sideways markets.
- Bollinger Breakout -- buy when price breaks above the upper band, expecting momentum to continue. Works best in trending markets.
Backtest both approaches on your target pair to see which fits the market regime.
A Bollinger Band breakout is more meaningful when accompanied by a volume spike. Add a volume confirmation trigger (e.g., vol_sma_20) to filter out low-conviction breakouts.
In strong trends, price can "walk the band" -- staying near the upper band in an uptrend or the lower band in a downtrend for many candles. A state-based trigger like price < bb_lower will fire on every one of those candles. Use max_count to limit firing, or switch to cross_below for a one-time signal.