Understanding Results
After a backtest completes, Botmarley saves a detailed results page with summary statistics, interactive charts, and a full action log. This chapter explains every piece of that page so you know exactly what you are looking at.
The Results Page Layout
The backtest detail page is organized into several sections:
- Summary statistics -- the headline numbers at the top.
- Price chart -- candlestick chart with buy/sell markers overlaid.
- Equity curve -- a line chart showing your portfolio value over time.
- Action log -- a table of every trade the strategy executed.
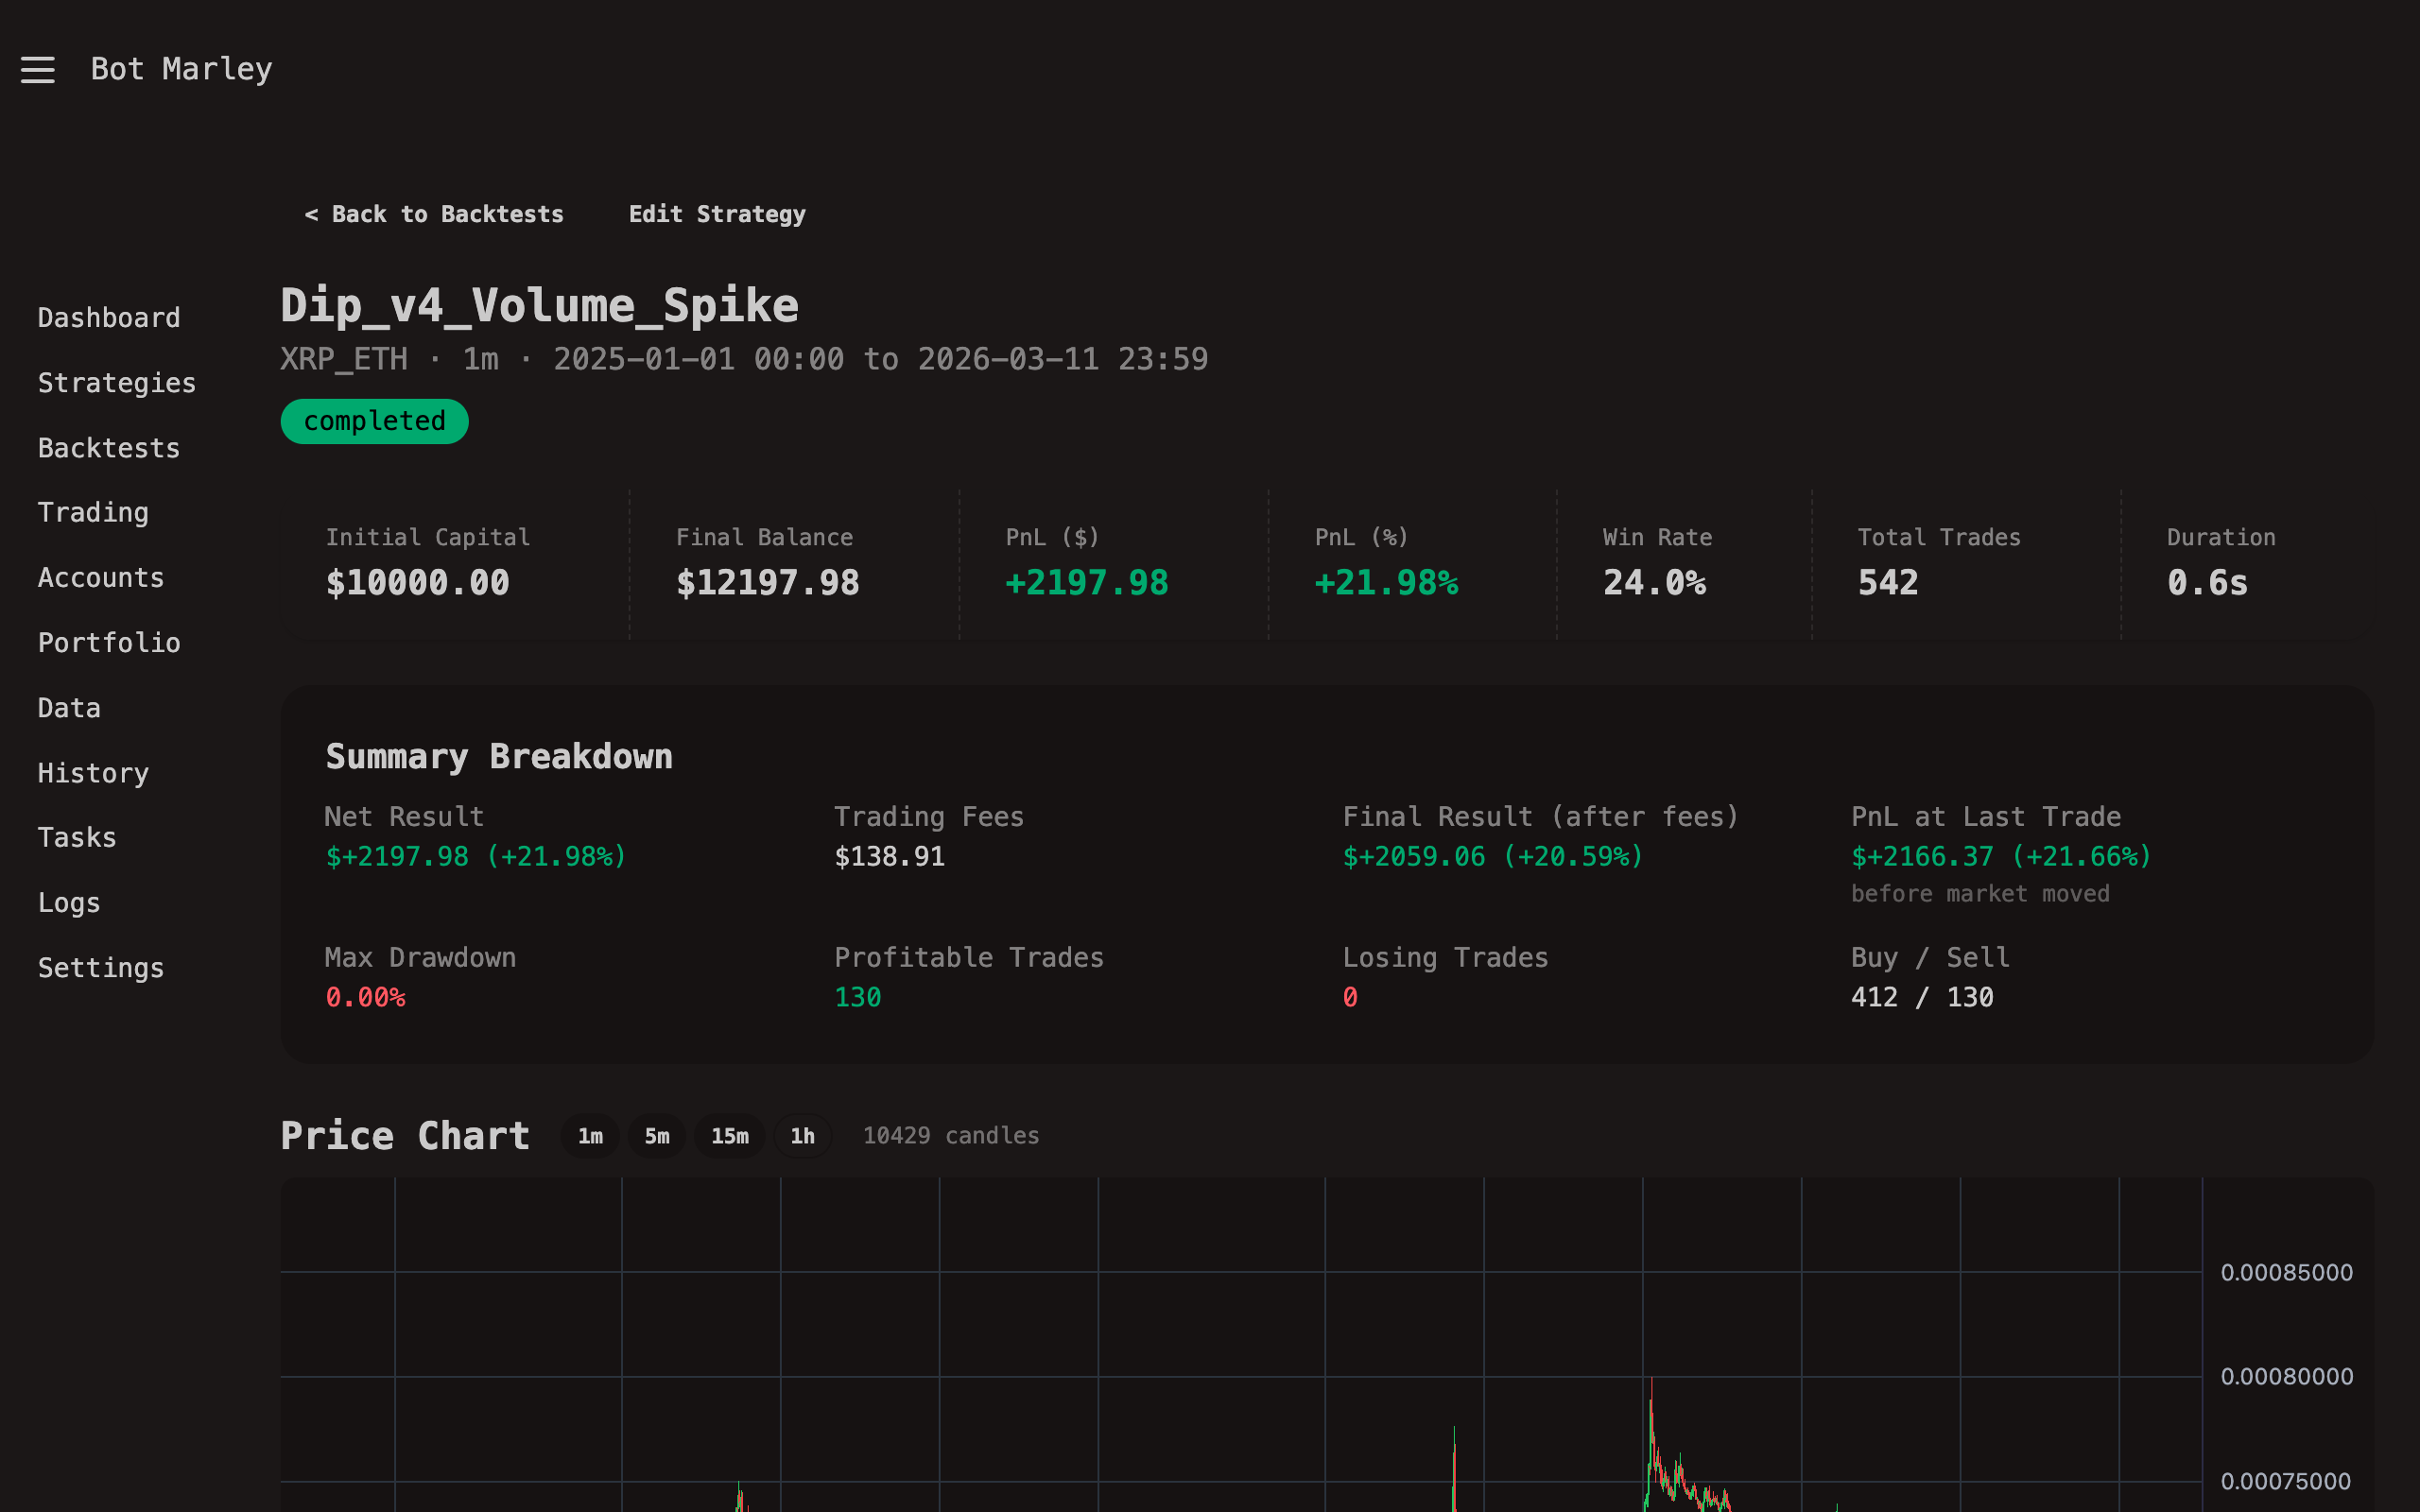
Summary Statistics
At the top of the results page, you will find a grid of key metrics. Here is what each one means:
| Metric | What it tells you |
|---|---|
| Net Result (USD) | The raw profit or loss: final portfolio value minus initial capital. This is calculated before fees. |
| Net Result (%) | Net result as a percentage of your initial capital. +15% means your portfolio grew by 15%. |
| Trading Fees (USD) | Total simulated fees across all executed trades (0.1% per trade). |
| Final Result (USD) | Net result minus trading fees. This is your true bottom line. |
| Final Result (%) | Final result as a percentage of initial capital. This is the number that matters most. |
| PnL at Last Trade | Portfolio value at the moment of the last executed trade, minus initial capital. Useful when the strategy ends with an open position -- the final result includes unrealized gains/losses from the last candle's close price, but PnL at last trade shows where you stood at the last actual trade. |
| Total Trades | Number of executed trade actions (buys + sells). |
| Profitable Trades | Trades where the realized PnL was positive (sell price > buy price). |
| Losing Trades | Trades where the realized PnL was negative. |
| Win Rate (%) | Percentage of profitable trades out of total trades. |
| Max Drawdown (%) | The largest peak-to-trough decline in portfolio value during the backtest. A drawdown of 12% means at some point your portfolio dropped 12% from its highest point. |
| Sharpe Ratio | A measure of risk-adjusted return. Higher is better. Values above 1.0 are generally considered good; above 2.0 is excellent. |
| Duration | How long the backtest engine took to run (in milliseconds). |
Max Drawdown and Sharpe Ratio are planned for a future release and may show as 0 or "N/A" in the current version.
How to Read These Numbers
- Positive Final Result means the strategy was profitable over the test period.
- Negative Final Result means it lost money.
- Win Rate alone does not tell the whole story. A strategy with a 30% win rate can still be very profitable if the average winning trade is much larger than the average losing trade.
- Net Result vs. Final Result: The gap between these two is your fee burden. If the difference is large relative to your profit, the strategy might be trading too frequently.
Price Chart
The price chart displays candlesticks for the backtest period with trade markers overlaid:
- Green upward arrows mark buy actions (open long and additional buys).
- Red downward arrows mark sell actions.
- Hovering over a marker shows the trade details (price, amount, trigger).
Timeframe Switching
By default, the chart aggregates candles to a readable timeframe. You can switch between:
| Timeframe | Candle duration | Best for |
|---|---|---|
| 1m | 1 minute | Short backtests (hours to a day), seeing exact entry/exit points |
| 5m | 5 minutes | Multi-day backtests, good balance of detail and overview |
| 15m | 15 minutes | Week-long backtests |
| 1h | 1 hour | Month-long backtests, big-picture view |
When you switch timeframes, the candles are re-aggregated and trade markers are snapped to the nearest candle. The underlying data does not change -- only the visual grouping.
Indicator Overlays
If your strategy uses technical indicators (RSI, SMA, Bollinger Bands, etc.), you can toggle them on and off using the indicator panel. Indicators are pre-computed and included in the chart data, so toggling is instant -- no server round-trip required.
- Price overlays (SMA, EMA, Bollinger Bands) render as lines on the main price chart.
- Separate pane indicators (RSI) render in a dedicated panel below the price chart.
Equity Curve
The equity curve is a line chart that plots your portfolio's total value (USD balance + crypto holdings valued at market price) at each point in time.
How to Interpret the Equity Curve
- Upward slope means the portfolio is growing.
- Downward slope means the portfolio is declining.
- Flat sections mean the strategy had no open positions (sitting in cash) or the market was moving sideways with no triggers firing.
- Sharp drops indicate significant losing trades or drawdown periods.
A healthy equity curve generally trends upward over time with manageable dips. An equity curve that rises steeply then crashes suggests the strategy was lucky during one period and then gave it all back.
Compare the equity curve to the raw price chart. If your equity curve closely mirrors the asset's price, your strategy might just be "buy and hold with extra steps." The value of a strategy is in doing better than simply holding the asset, or achieving similar returns with less risk (smaller drawdowns).
Action Log
Below the charts, you will find a table listing every trade action the strategy executed during the backtest. Each row contains:
| Column | Description |
|---|---|
| Tick | The candle index (0-based) where the action occurred. |
| Timestamp | The date and time of the candle. |
| Action | The type of action: open_long, buy, or sell. |
| Position # | Which position this action belongs to (for multi-position strategies). |
| Price | The candle close price at execution. |
| Amount (USD) | The dollar amount of the trade. |
| Amount (Crypto) | The crypto amount bought or sold. |
| Trigger | The trigger condition that caused this action (e.g., "RSI(14) < 30" or "Position price change +5%"). |
| Portfolio Balance | Total portfolio value (USD + crypto) after this action. |
| PnL (USD) | Realized profit or loss on this specific trade (for sells). Blank for buys. |
| Status | executed, skipped, or impossible. |
Action Statuses
- executed -- The action was carried out. Portfolio updated.
- skipped -- The trigger conditions were met, but the action was skipped for a reason (e.g.,
max_countreached, no open position to sell). - impossible -- The action could not execute (e.g., trying to buy with insufficient USD balance).
By default, only executed actions are shown. Enable Verbose Logging when running the backtest to also save skipped and impossible actions. This is useful for debugging why a strategy is not trading as expected.
Red Flags in Results
Not all positive results are good results. Watch out for these warning signs:
| Red flag | What it might mean |
|---|---|
| Very few trades (< 5) | The strategy triggers are too restrictive, or the date range is too short. The results may not be statistically meaningful. |
| Win rate below 30% | The strategy loses most of its trades. It can still be profitable if winners are large, but verify that the average winning trade significantly exceeds the average loser. |
| Max drawdown above 30% | The strategy has periods of severe loss. Ask yourself: could you tolerate watching your account drop by a third? |
| Final result is positive but PnL at last trade is negative | The profit came from an unrealized position at the end of the backtest (the last candle happened to be at a favorable price). This is fragile -- the price could have gone the other way. |
| Fees eat most of the profit | If trading fees are more than 20-30% of the net result, the strategy is overtrading. Consider widening trigger thresholds to trade less frequently. |
| Equity curve has a single spike | One lucky trade drove all the profit. Remove that trade mentally and ask if the strategy still makes sense. |