Running a Backtest
This chapter walks you through running a backtest from start to finish. By the end, you will have a completed backtest result with PnL, trade markers on a chart, and a full action log.
Prerequisites
Before you can run a backtest, you need two things:
-
A strategy. You must have at least one strategy saved in the Strategy Editor. If you have not created one yet, see the Strategy Editor chapter.
-
Historical candle data. Botmarley runs backtests against Arrow files stored on disk. You must download historical data for the pair you want to test before running a backtest. See Downloading History for how to do this.
If you try to run a backtest without historical data for the selected pair and date range, the backtest will fail with an "insufficient data" error.
Step-by-Step: Running a Backtest
1. Navigate to the Strategy Editor
Open the Botmarley web interface at http://localhost:3000 and click Strategies in the sidebar. Find the strategy you want to test and click on it to open the detail page.
2. Click the "Backtest" Button
On the strategy detail page, you will see a Backtest button (or section). Clicking it opens the backtest configuration form.
3. Configure the Backtest
Fill in the backtest parameters:
| Parameter | Description | Example |
|---|---|---|
| Pair | The trading pair to test against. | BTC/USD, ETH/USD |
| Start date | The beginning of the historical period. | 2025-09-01 |
| End date | The end of the historical period. | 2025-10-01 |
| Initial capital (USD) | The starting balance for the simulated portfolio. | 1000 |
- Start with a 1-month range to get meaningful results without waiting too long.
- Make sure your downloaded historical data covers the entire date range. If you have data from Sept 15 to Oct 15 but set the start date to Sept 1, the backtest will only use data from Sept 15 onward.
- Avoid testing against extremely short periods (a few hours). Strategy triggers may not fire often enough to produce useful results.
- Use an amount that reflects what you would actually trade with. A strategy tested with $100,000 may behave differently than one tested with $500 because position sizes scale with capital.
- Common starting points: $1,000 for exploration, $10,000 for more realistic testing.
4. Submit and Wait
Click Run Backtest. Botmarley creates a background task for the backtest and adds it to the task queue. You will see a confirmation that the task has been queued.
The backtest runs asynchronously -- you do not need to keep the page open. The pipeline is:
flowchart LR
    A["Click Run Backtest"] --> B["Task queued"]
    B --> C["Task worker picks up task"]
    C --> D["Engine processes candles"]
    D --> E["Results saved to database"]
    E --> F["Backtest appears on<br/>Backtests page"]
For a typical 1-month period (about 43,000 one-minute candles), the backtest completes in a few seconds to under 30 seconds, depending on your hardware and strategy complexity.
5. View the Results
Navigate to the Backtests page by clicking Backtests in the sidebar. You will see a table of all backtest runs, sorted by creation date. Your new backtest will appear at the top with a status of Completed (or Failed if something went wrong).
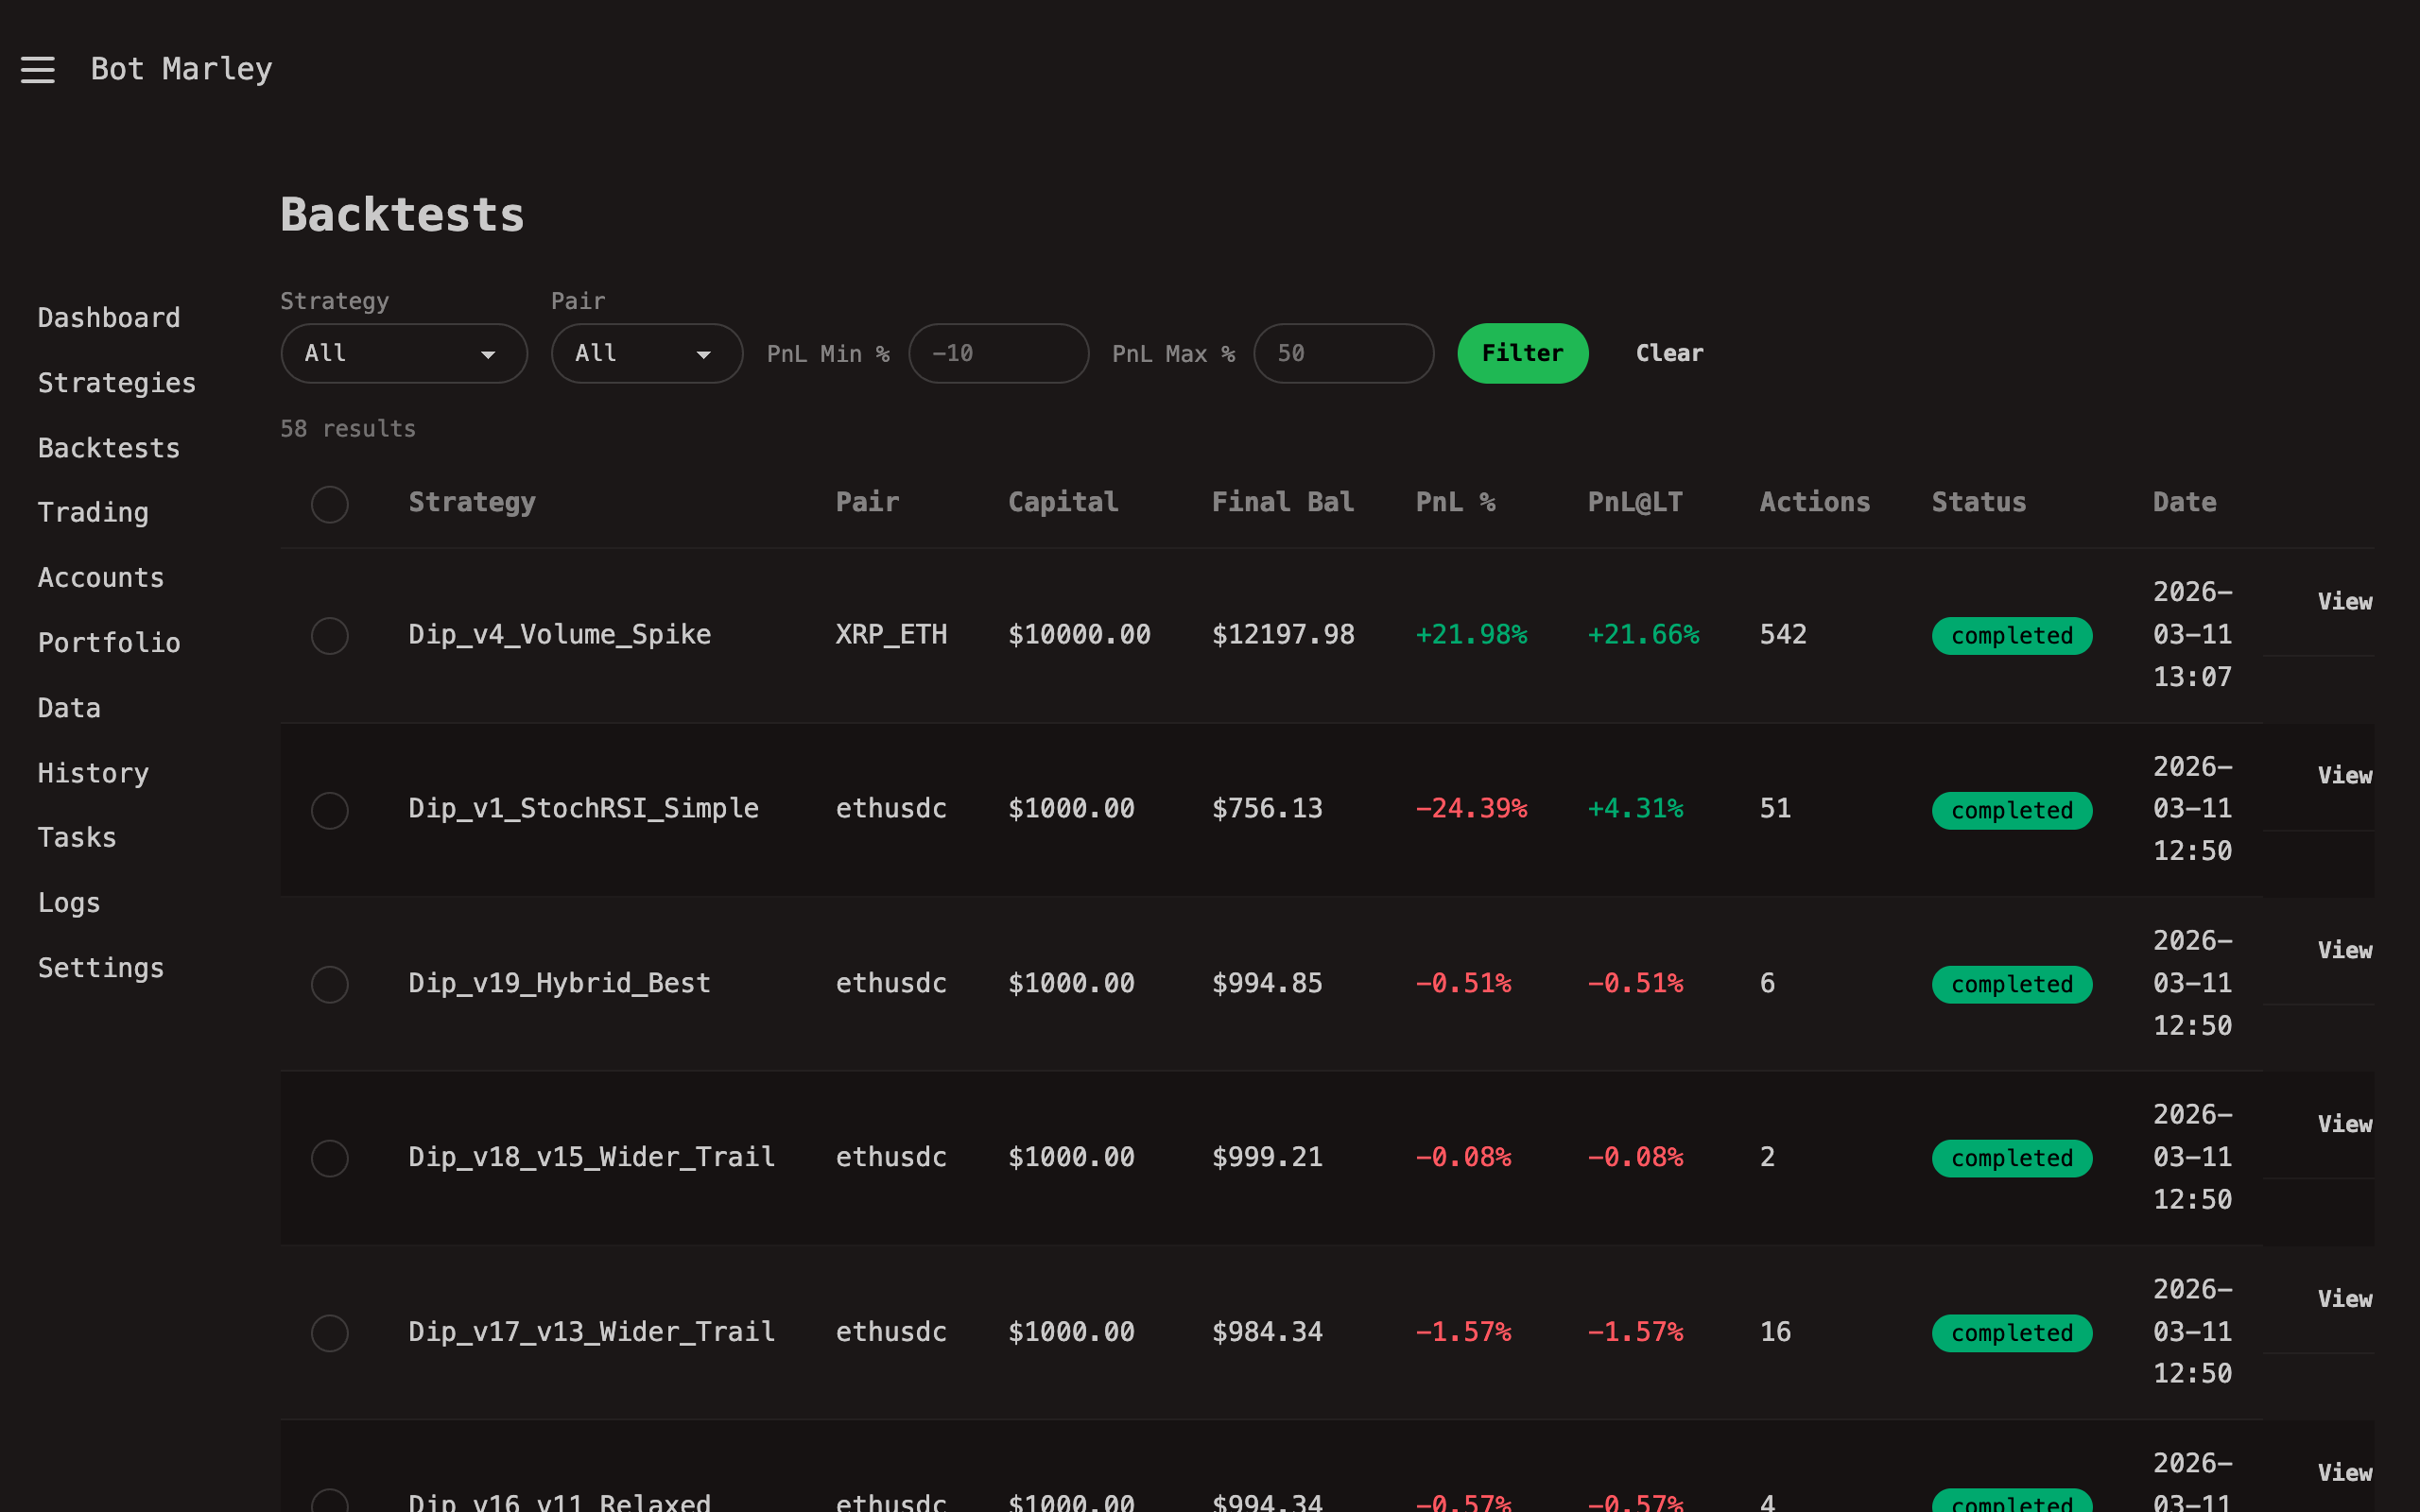
Click on the backtest row to open the full results page. See Understanding Results for a detailed breakdown of what you will find there.
What Happens Behind the Scenes
When you click Run Backtest, here is what Botmarley does internally:
- Validates the strategy TOML and parses it into the internal strategy format.
- Loads candle data from the Arrow files on disk for the selected pair and date range.
- Enqueues a
BacktestRuntask in the task queue with your configuration. - The task worker picks up the task, creates a
BacktestEngine, and callsBacktestEngine::run(). - The engine pre-computes all indicator values (RSI, SMA, Bollinger Bands, etc.) into a cache for fast lookups.
- The engine walks through every candle tick-by-tick, evaluating your triggers and executing actions when conditions are met.
- After the last candle, it calculates summary metrics (PnL, win rate, fees, etc.).
- Results and the full action log are saved to PostgreSQL.
- The task is marked complete, and the backtest appears on the Backtests page.
Troubleshooting
| Problem | Likely cause | Fix |
|---|---|---|
| Backtest status is "Failed" | Missing historical data for the pair/date range | Download history for that pair first |
| Zero trades executed | Strategy triggers never fired during the period | Check your trigger thresholds -- they may be too strict for the selected period |
| Backtest takes very long | Very large date range (several months of 1m data) | Try a shorter date range, or wait -- performance targets are under 30 seconds for one month |
| "Insufficient data" error | Date range extends beyond available Arrow data | Adjust dates to match your downloaded data |