Backtesting
Backtesting is the process of running a trading strategy against historical market data to see how it would have performed in the past. Instead of risking real money to find out whether your strategy works, you let Botmarley replay weeks or months of price history and apply your strategy rules to every candle, exactly as the live trading engine would.
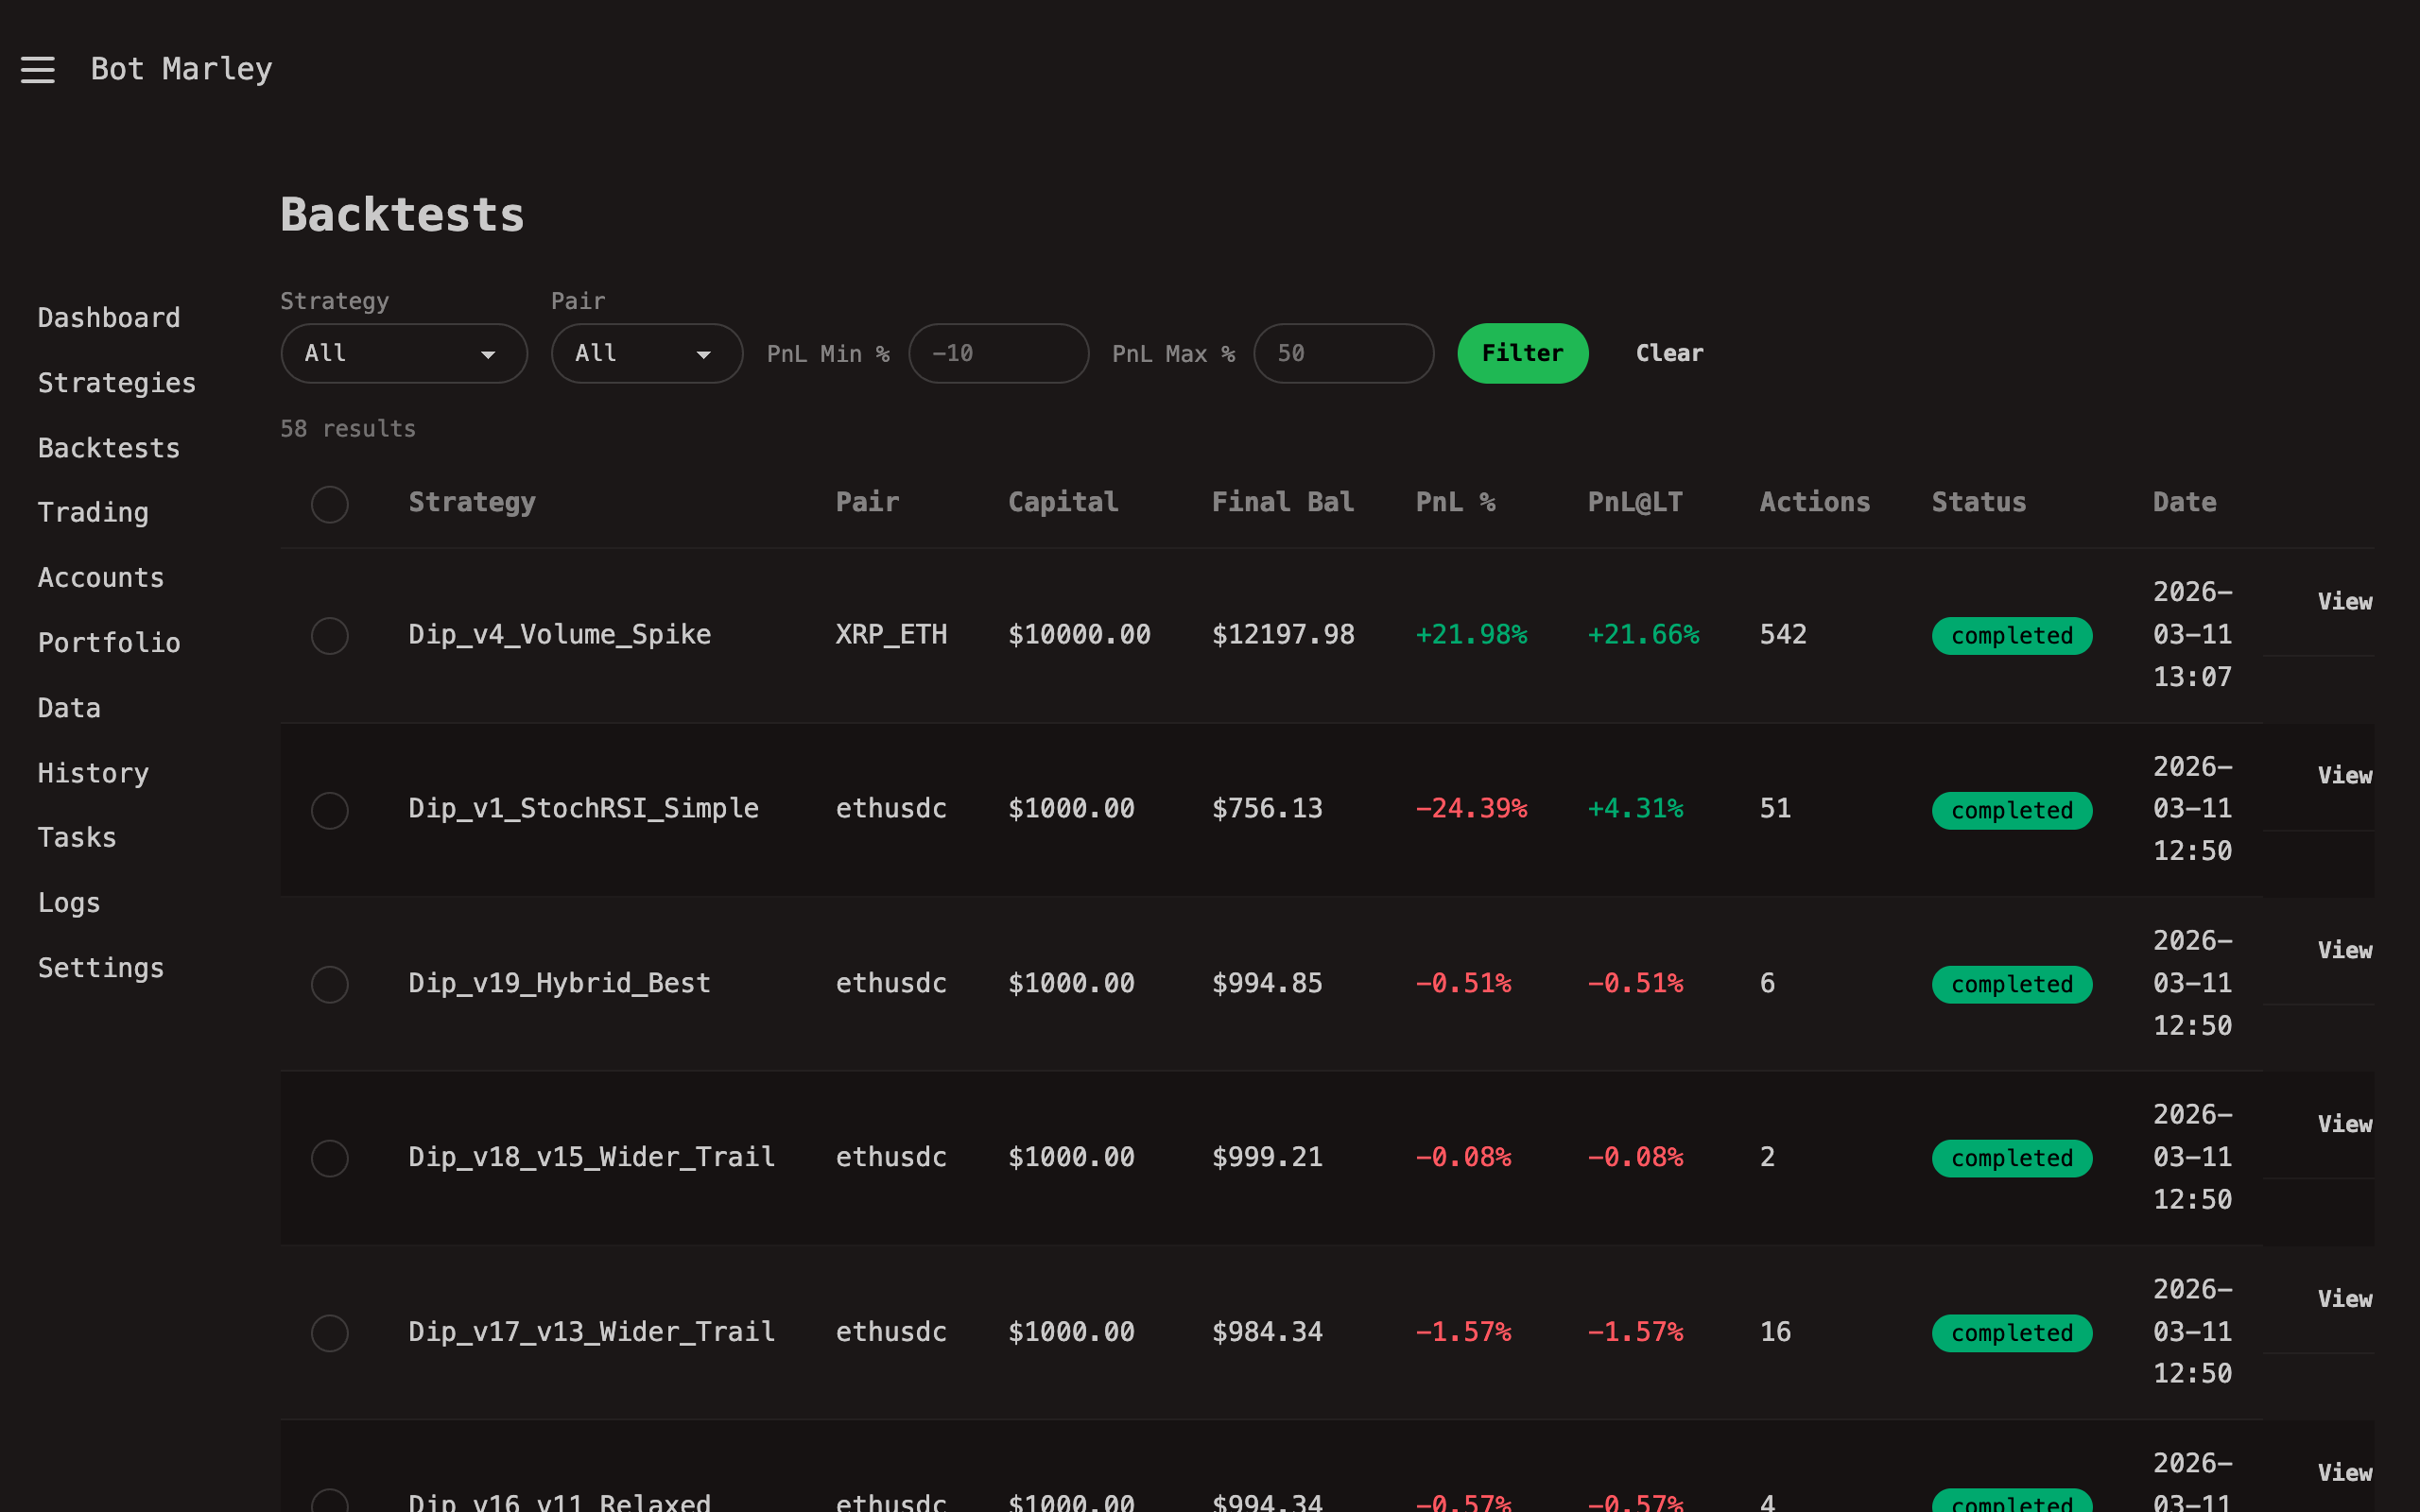
The result is a detailed report: how much money you would have made or lost, how many trades fired, what your win rate was, and where the strategy struggled.
Why Backtesting Matters
Building a strategy based on intuition alone is gambling. Backtesting gives you evidence. Specifically, it lets you:
- Validate logic before risking capital. A strategy that sounds good on paper might produce terrible results when applied to actual price data. Backtesting exposes that before you lose money.
- Compare strategies objectively. Instead of guessing which of your three strategies is "better," you can run all three against the same data and compare the numbers.
- Tune parameters with feedback. If your RSI threshold is set to 30, what happens at 25 or 35? Backtesting lets you iterate quickly.
- Build confidence. Even a profitable strategy will have losing streaks. Seeing those drawdowns in a backtest prepares you for what live trading actually feels like.
How Botmarley Backtesting Works
Botmarley's backtest engine processes candles one at a time (tick-by-tick), evaluating your strategy rules at each step. The pipeline looks like this:
flowchart TD
    A["Load historical candles<br/>(Arrow files on disk)"] --> B["Pre-compute indicator cache<br/>(RSI, SMA, MACD, etc.)"]
    B --> C["Initialize portfolio<br/>(USD balance = initial capital)"]
    C --> D["Process next candle"]
    D --> E{"Evaluate triggers<br/>for each action"}
    E -- "Trigger fired" --> F["Execute action<br/>(buy/sell, update portfolio)"]
    E -- "No match" --> D
    F --> G{"More candles?"}
    G -- Yes --> D
    G -- No --> H["Calculate summary metrics<br/>(PnL, win rate, fees, etc.)"]
    H --> I["Save results to database"]
The engine follows a three-phase execution model:
-
Pre-computation phase. Before processing any candles, Botmarley calculates all indicator values (RSI, SMA, Bollinger Bands, MACD, etc.) for the entire candle history and stores them in a cache. This means each tick lookup during execution is instant -- the engine never recalculates an indicator mid-run.
-
Execution phase. The engine walks through every candle in order. At each tick, it evaluates every action in your strategy. If an action's triggers are satisfied, it executes (opens a position, buys more, or sells). The portfolio state updates immediately: USD balance goes down when buying, crypto balance goes up, and vice versa for sells.
-
Summary phase. After the last candle, the engine calculates final metrics: net PnL, win rate, trading fees, max drawdown, and more. Everything is saved to PostgreSQL along with the full action log.
The 0.1% Trading Fee
Every executed trade in a backtest incurs a simulated 0.1% fee on the trade amount. This fee is not deducted from your portfolio during execution -- it is calculated separately and subtracted from the net result at the end.
For example, if you buy $1,000 worth of BTC, the fee for that trade is $1.00. If you later sell all of it for $1,050, the sell fee is $1.05. Your net result (before fees) is +$50. Your final result (after fees) is $50 - $1.00 - $1.05 = $47.95.
The 0.1% rate is a simplified approximation of exchange fees. Actual fee schedules on Kraken and Binance vary by trading volume tier and maker/taker status, but 0.1% is a reasonable middle ground for most users.
Limitations of Backtesting
Backtesting is a powerful tool, but it has real limitations. Understanding these will save you from nasty surprises when you go live.
| Limitation | What it means |
|---|---|
| No slippage simulation | In a backtest, your order fills at the exact candle close price. In live trading, the actual fill price may be slightly different, especially during fast-moving markets. |
| No liquidity modeling | The backtest assumes your order size is small enough to fill completely. In reality, large orders on thin order books may only partially fill or move the price against you. |
| No latency | Backtests execute instantly. Live trading involves network round-trips to the exchange, which can introduce delays of hundreds of milliseconds to seconds. |
| Perfect information | The backtest "sees" the full candle (open, high, low, close) for each tick. In live trading, you only see the close price at the end of the candle interval. |
| Simplified fees | The flat 0.1% fee does not account for tiered fee schedules, funding rates, or other exchange-specific costs. |
Backtest vs. Live Trading
The backtest engine and the live trading engine share the same core evaluation logic -- the same trigger evaluation code, the same portfolio tracking, the same action execution. This means a strategy that "works" in backtesting will behave identically in live trading under ideal conditions.
The differences are:
| Aspect | Backtest | Live Trading |
|---|---|---|
| Data source | Arrow files on disk | Exchange REST API (polled every 60s) |
| Execution speed | Thousands of candles per second | One candle per poll interval |
| Order fills | Instant at candle close price | Exchange order book (may slip) |
| Fees | Simulated 0.1% flat | Actual exchange fee schedule |
| Portfolio | Simulated in memory | Paper (simulated) or Real (Kraken/Binance) |
| Risk | Zero | Paper = zero, Exchange = real money |
Past performance does not guarantee future results. A strategy that returned +40% in a backtest against last month's data may lose money next month. Markets change, volatility shifts, and conditions that produced your backtest profits may never repeat. Always treat backtest results as one input among many, not as a prediction.