Data Browser
The Data Browser lets you explore the candle data stored on disk. You can view raw OHLCV values in a table, render interactive charts, and inspect individual candles -- all from the web interface.
Accessing the Data Browser
Navigate to /data in the sidebar. The Data Browser page presents two main controls at the top:
- Pair selector -- choose which trading pair to view (e.g., XBTUSD, ETHUSD from Kraken, or BTCUSDC, ETHUSDC from Binance).
- Timeframe selector -- choose the candle resolution (1m, 5m, 15m, 1h).
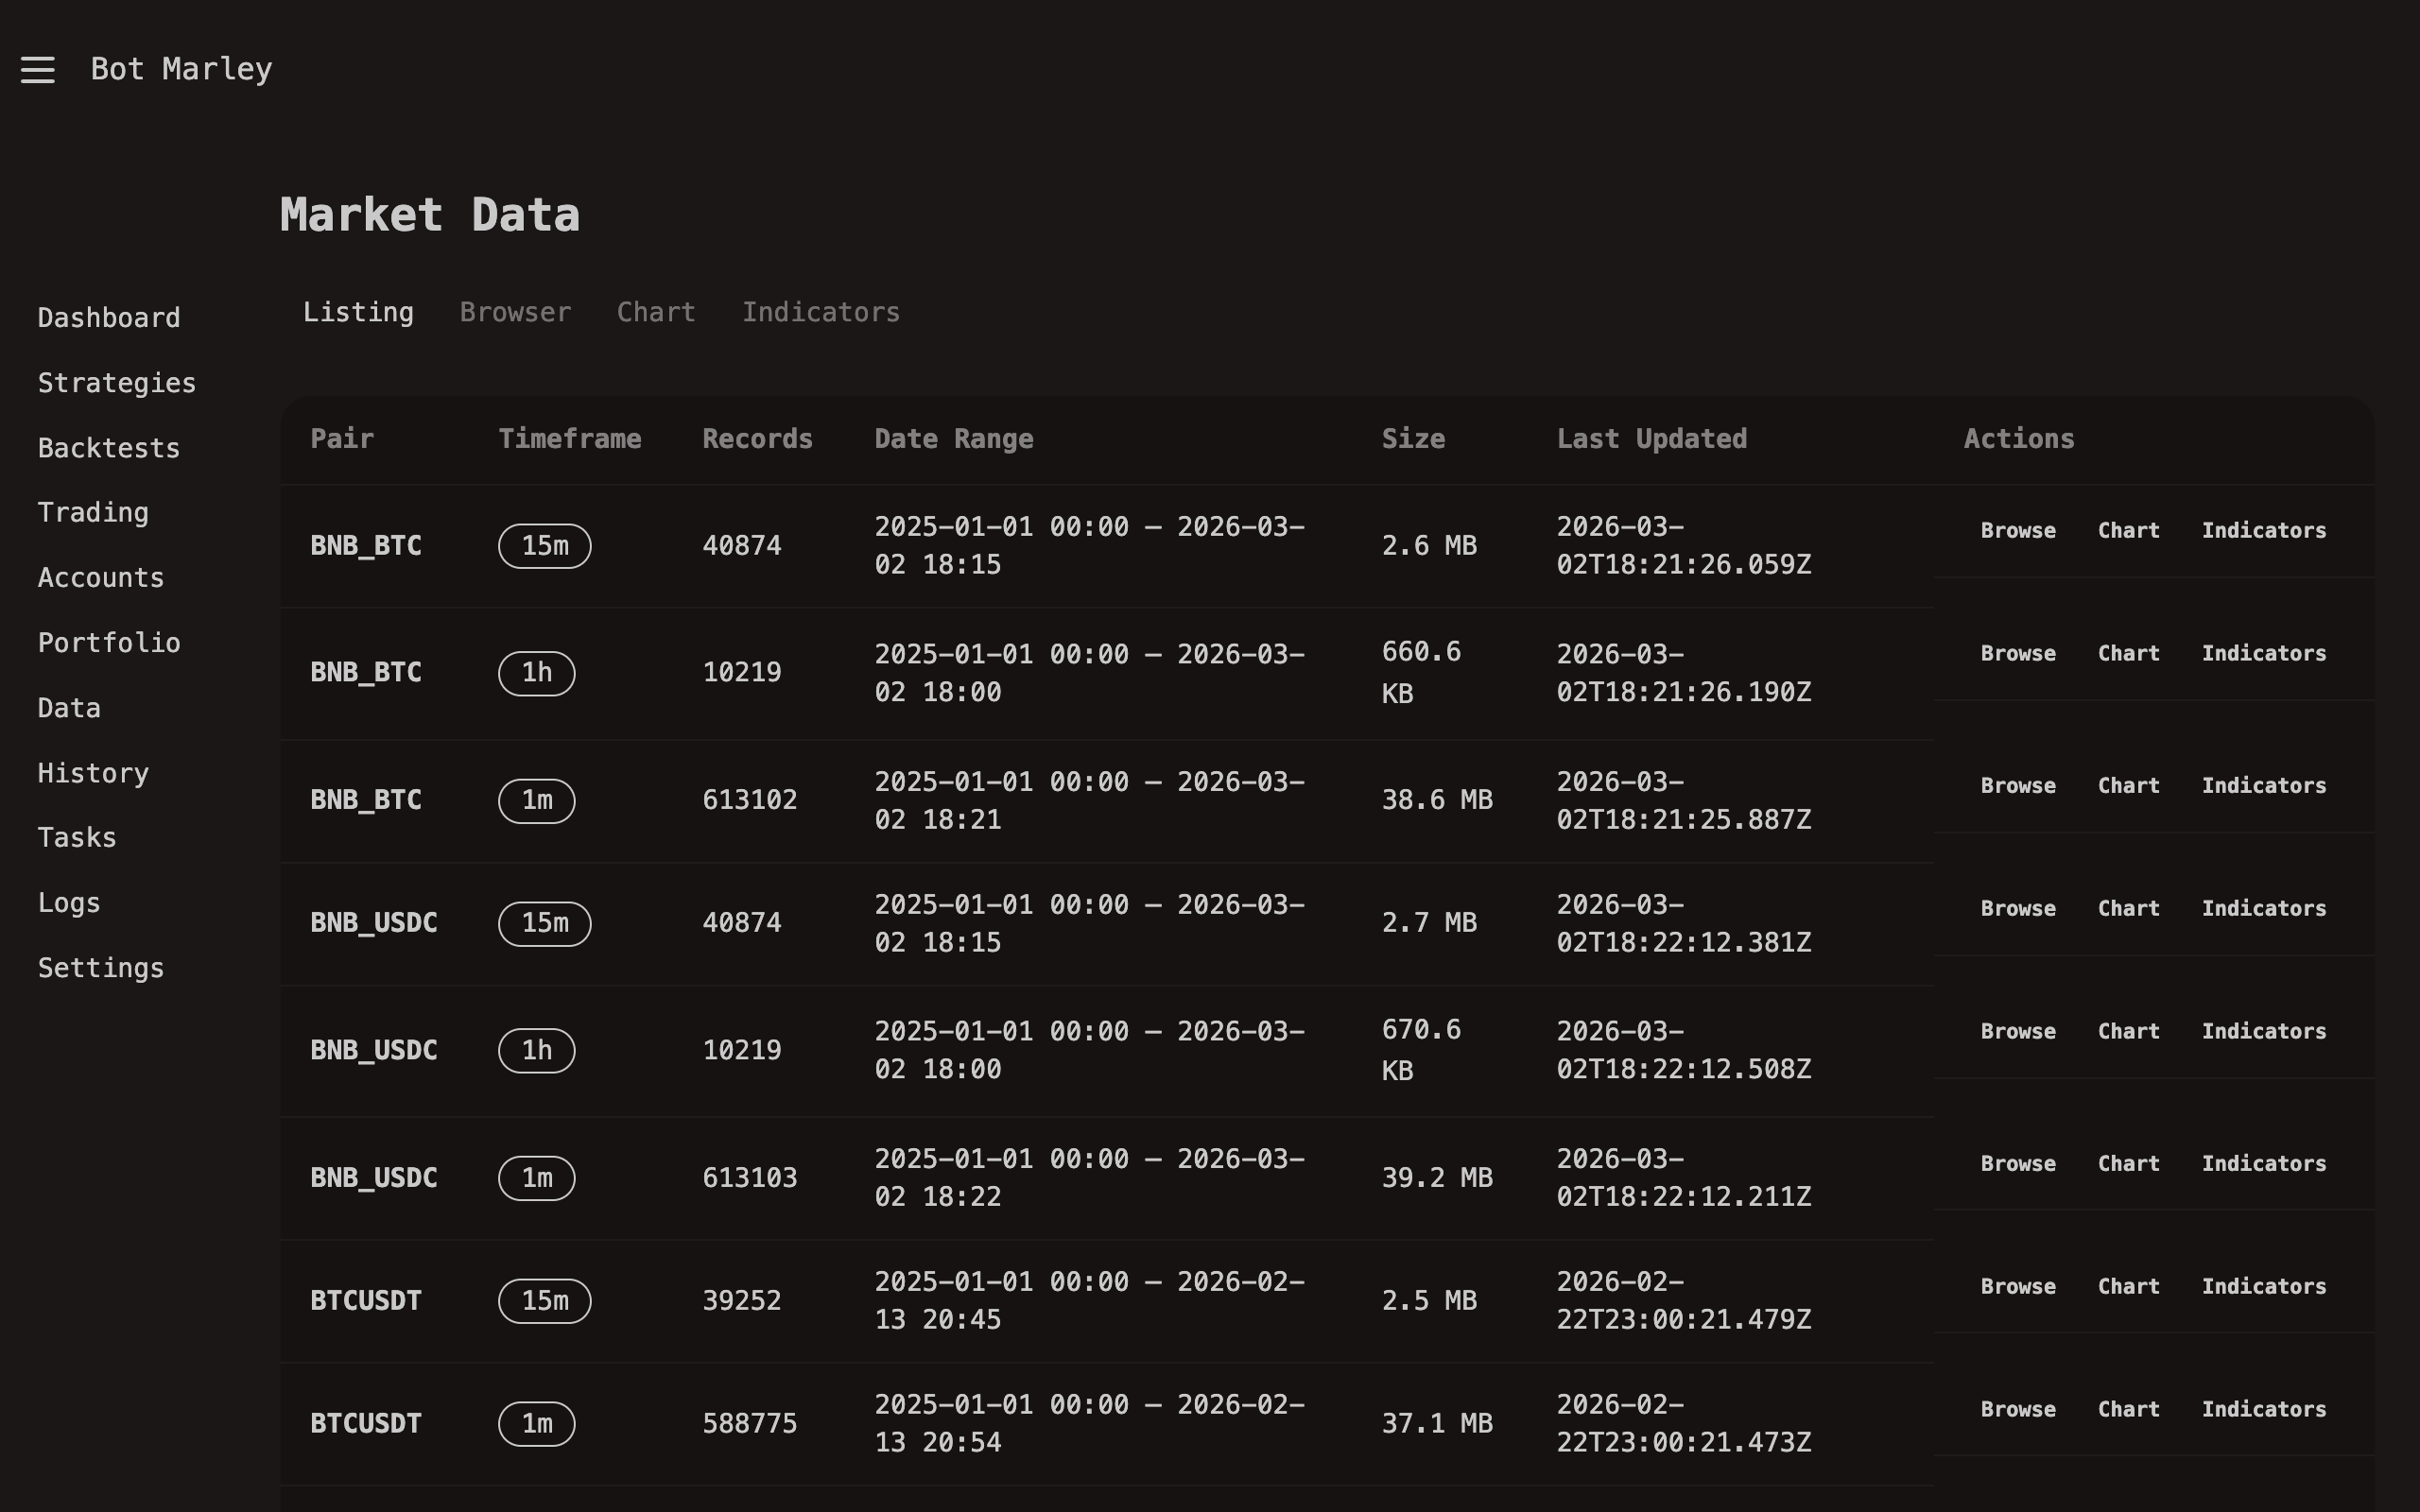
You can only browse pairs that have been downloaded. If a pair does not appear in the selector, go to Downloading History and run a History Sync first.
Interactive Chart Viewer
The chart viewer uses Lightweight Charts (the same library used by TradingView) to render a professional candlestick chart. The chart supports:
- Pan and zoom -- click and drag to pan, scroll to zoom in/out on the time axis.
- Crosshair -- hover over any candle to see its exact OHLCV values in the legend area.
- Auto-fit -- the chart automatically scales the price axis to fit visible candles.
- Time navigation -- scroll left to see older data, right for more recent data.
The chart loads candle data directly from the server and renders it in the browser using vanilla JavaScript. No external services are contacted.
Use the scroll wheel to zoom into specific time ranges. This is especially useful when looking at 1-minute candles, where the full dataset may span months of data.
Candle Table
Below the chart, a table displays the raw candle data for the selected pair and timeframe. Each row represents one candle:
| Column | Description |
|---|---|
| Timestamp | The start time of the candle (UTC) |
| Open | Price at the start of the period |
| High | Highest price during the period |
| Low | Lowest price during the period |
| Close | Price at the end of the period |
| Volume | Total traded volume during the period |
The table is sorted by timestamp in descending order (newest first), so the most recent candles appear at the top.
Switching Timeframes
When you switch from one timeframe to another (e.g., from 1m to 1h), the chart and table reload with the new data. Remember that all timeframes larger than 1m are derived from the stored 1-minute candles:
flowchart LR
    Store["1m.arrow on disk"] --> Derive["Server aggregation"]
    Derive --> TF5["5m candles"]
    Derive --> TF15["15m candles"]
    Derive --> TF60["1h candles"]
    TF5 --> Render["Chart + Table"]
    TF15 --> Render
    TF60 --> Render

    style Store fill:#f59e0b,color:#fff
    style Render fill:#22c55e,color:#fff
Switching timeframes does not require a new download -- the server reads the 1-minute Arrow file and computes the requested timeframe on the fly.
Practical Uses
The Data Browser is useful for several tasks:
- Visual verification after downloading history -- confirm that the data looks correct, with no obvious gaps or anomalies.
- Manual chart analysis -- look at price patterns, support/resistance levels, or significant moves before building a strategy.
- Debugging strategies -- after a backtest, switch to the Data Browser to see exactly what the candles looked like during a period where the strategy made unexpected trades.
- Comparing timeframes -- look at the same time period in 1m and 1h to understand how aggregation affects candle shapes and indicator values.