Dashboard
The Dashboard is your home page — the first thing you see when you open Botmarley at http://localhost:3000.
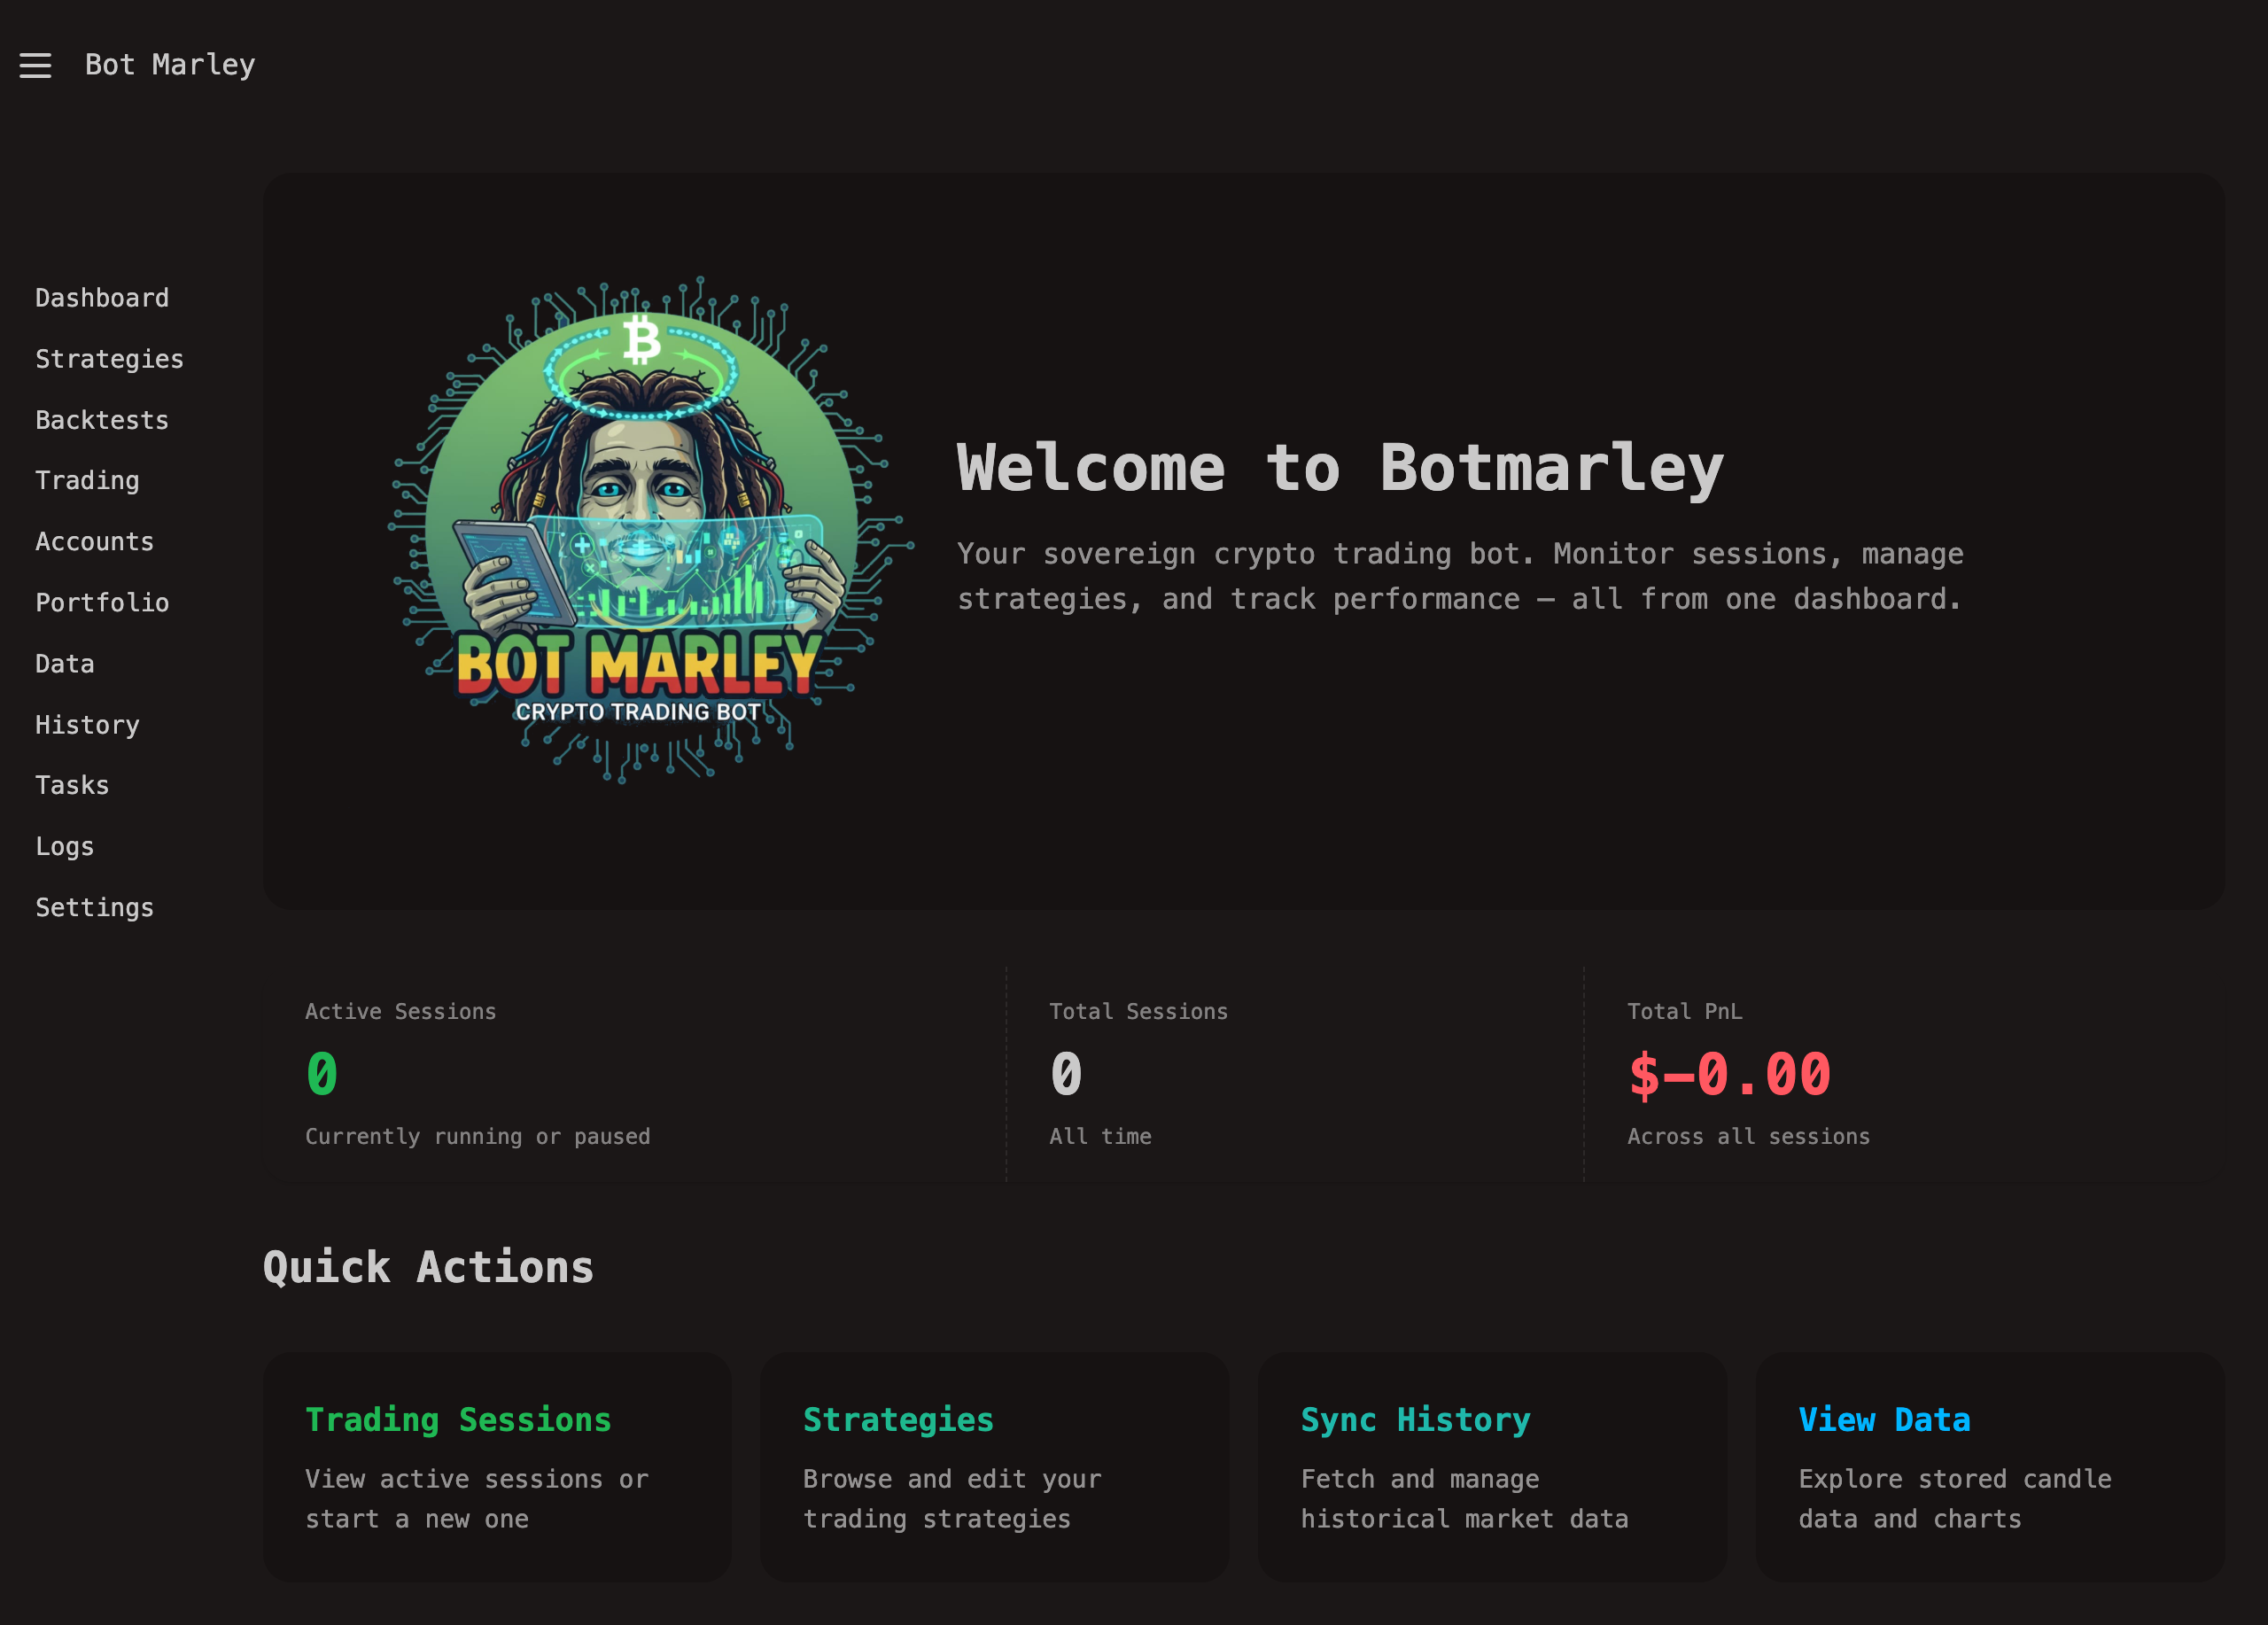
What You'll See
The dashboard provides a high-level overview of your trading operation:
Portfolio Summary
If you have accounts connected and portfolio sync running, you'll see:
- Total Portfolio Value (USD) — combined value across all accounts
- Total Portfolio Value (BTC) — your holdings measured in Bitcoin
- BTC Price — current Bitcoin price in USD
- Last Sync — when portfolio data was last refreshed
Active Trading Sessions
Any currently running or paused trading sessions appear here with:
- Session name and trading pair
- Current status (Running, Paused)
- Profit/Loss so far
- Number of actions executed
Click on any active session to jump directly to its detail page with real-time charts and controls.
Empty State
If this is your first time using Botmarley, the dashboard will show helpful links to get started:
- Add an Account — connect to Kraken or create a Paper account
- Create a Strategy — build your first trading strategy
- Download Data — fetch historical market data for backtesting
Auto-Refresh
The dashboard uses HTMX polling to stay up-to-date. Active session stats refresh automatically without needing to reload the page.
Navigation
From the dashboard, you can quickly navigate to any section using the sidebar. The most common workflows from here:
graph LR
    D[Dashboard] --> A[Accounts]
    D --> S[Strategies]
    D --> T[Trading]
    D --> B[Backtesting]
    A --> T
    S --> B
    B --> T
This flow represents the typical journey: set up accounts, create strategies, backtest them, then go live.