Portfolio Tracking
The Portfolio page gives you a consolidated view of everything you hold across all your accounts -- Paper and exchange alike -- valued in both USD and BTC, updated automatically over time.
What Is Portfolio Tracking?
Portfolio tracking answers a simple question: how much is everything worth, right now and over time?
Botmarley periodically takes a "snapshot" of your portfolio. Each snapshot records:
- The total value in USD across all accounts.
- The total value in BTC (your USD total divided by the current BTC price).
- The BTC/USD price at that moment.
- A per-token breakdown showing balance and USD value for each asset.
By storing snapshots over time, Botmarley can draw charts showing how your portfolio value has changed -- and whether you are gaining or losing ground relative to Bitcoin itself.
How It Works
Portfolio syncing follows a pipeline that runs on a fixed schedule and can also be triggered manually.
Automatic sync schedule
A background scheduler starts when the Botmarley server boots. After an initial 60-second startup delay, it enqueues a PortfolioSync task every 1 hour. The task worker picks it up and runs the full sync pipeline.
The sync pipeline
flowchart LR
    A["Scheduler\n(every 1h)"] -->|enqueues task| B["Task Worker"]
    B --> C["Sync Exchange\nAccounts"]
    C --> D["Query All\nAccount Assets"]
    D --> E["Fetch USD Prices\n(Kraken Ticker API)"]
    E --> F["Compute Totals\n(USD + BTC)"]
    F --> G["Store Snapshot\n(PostgreSQL)"]
In detail, each sync performs these steps:
- Sync verified exchange accounts -- for every exchange account with status "Verified", Botmarley calls the exchange API to pull the latest balances. Failed syncs for individual accounts are logged but do not stop the pipeline.
- Query all account assets -- reads every non-zero asset balance across all accounts (including Paper) from the database.
- Fetch USD prices -- calls the Kraken public Ticker API to get current USD prices for each unique token. Stablecoins and fiat are handled locally (see below).
- Compute totals -- sums up
balance * pricefor every asset to gettotal_value_usd. Fetches the BTC/USD price separately and calculatestotal_value_btc = total_value_usd / btc_price. - Store snapshot -- inserts one aggregate row (with
account_id = NULL) into theportfolio_snapshotstable, including a JSON breakdown of per-token values.
The Portfolio Page
The portfolio page is located at /portfolio. It has several sections, described from top to bottom.
Summary Cards
Four stat cards appear at the top of the page:
| Card | Description | Example |
|---|---|---|
| Total Value (USD) | Sum of all assets across all accounts, converted to USD. | $12,345.67 |
| Total Value (BTC) | Your USD total divided by the current BTC price. | 0.142857 |
| BTC Price | The latest BTC/USD price fetched from Kraken. | $86,420.00 |
| Last Sync | Timestamp of the most recent portfolio snapshot. | 2026-03-11 14:00 UTC |
If no snapshots exist yet (fresh install), the page shows an empty state with buttons to manage accounts or run a first sync.
Range Selector
Below the summary cards, a row of small buttons lets you control the time range for the charts:
| Button | Time range |
|---|---|
| 7d | Last 7 days |
| 30d | Last 30 days (default) |
| 90d | Last 90 days |
| All | All available history |
Switching ranges fetches new data from /api/portfolio/chart?range=... and updates both charts without a full page reload. A small label next to the buttons shows how many data points are in the current view.
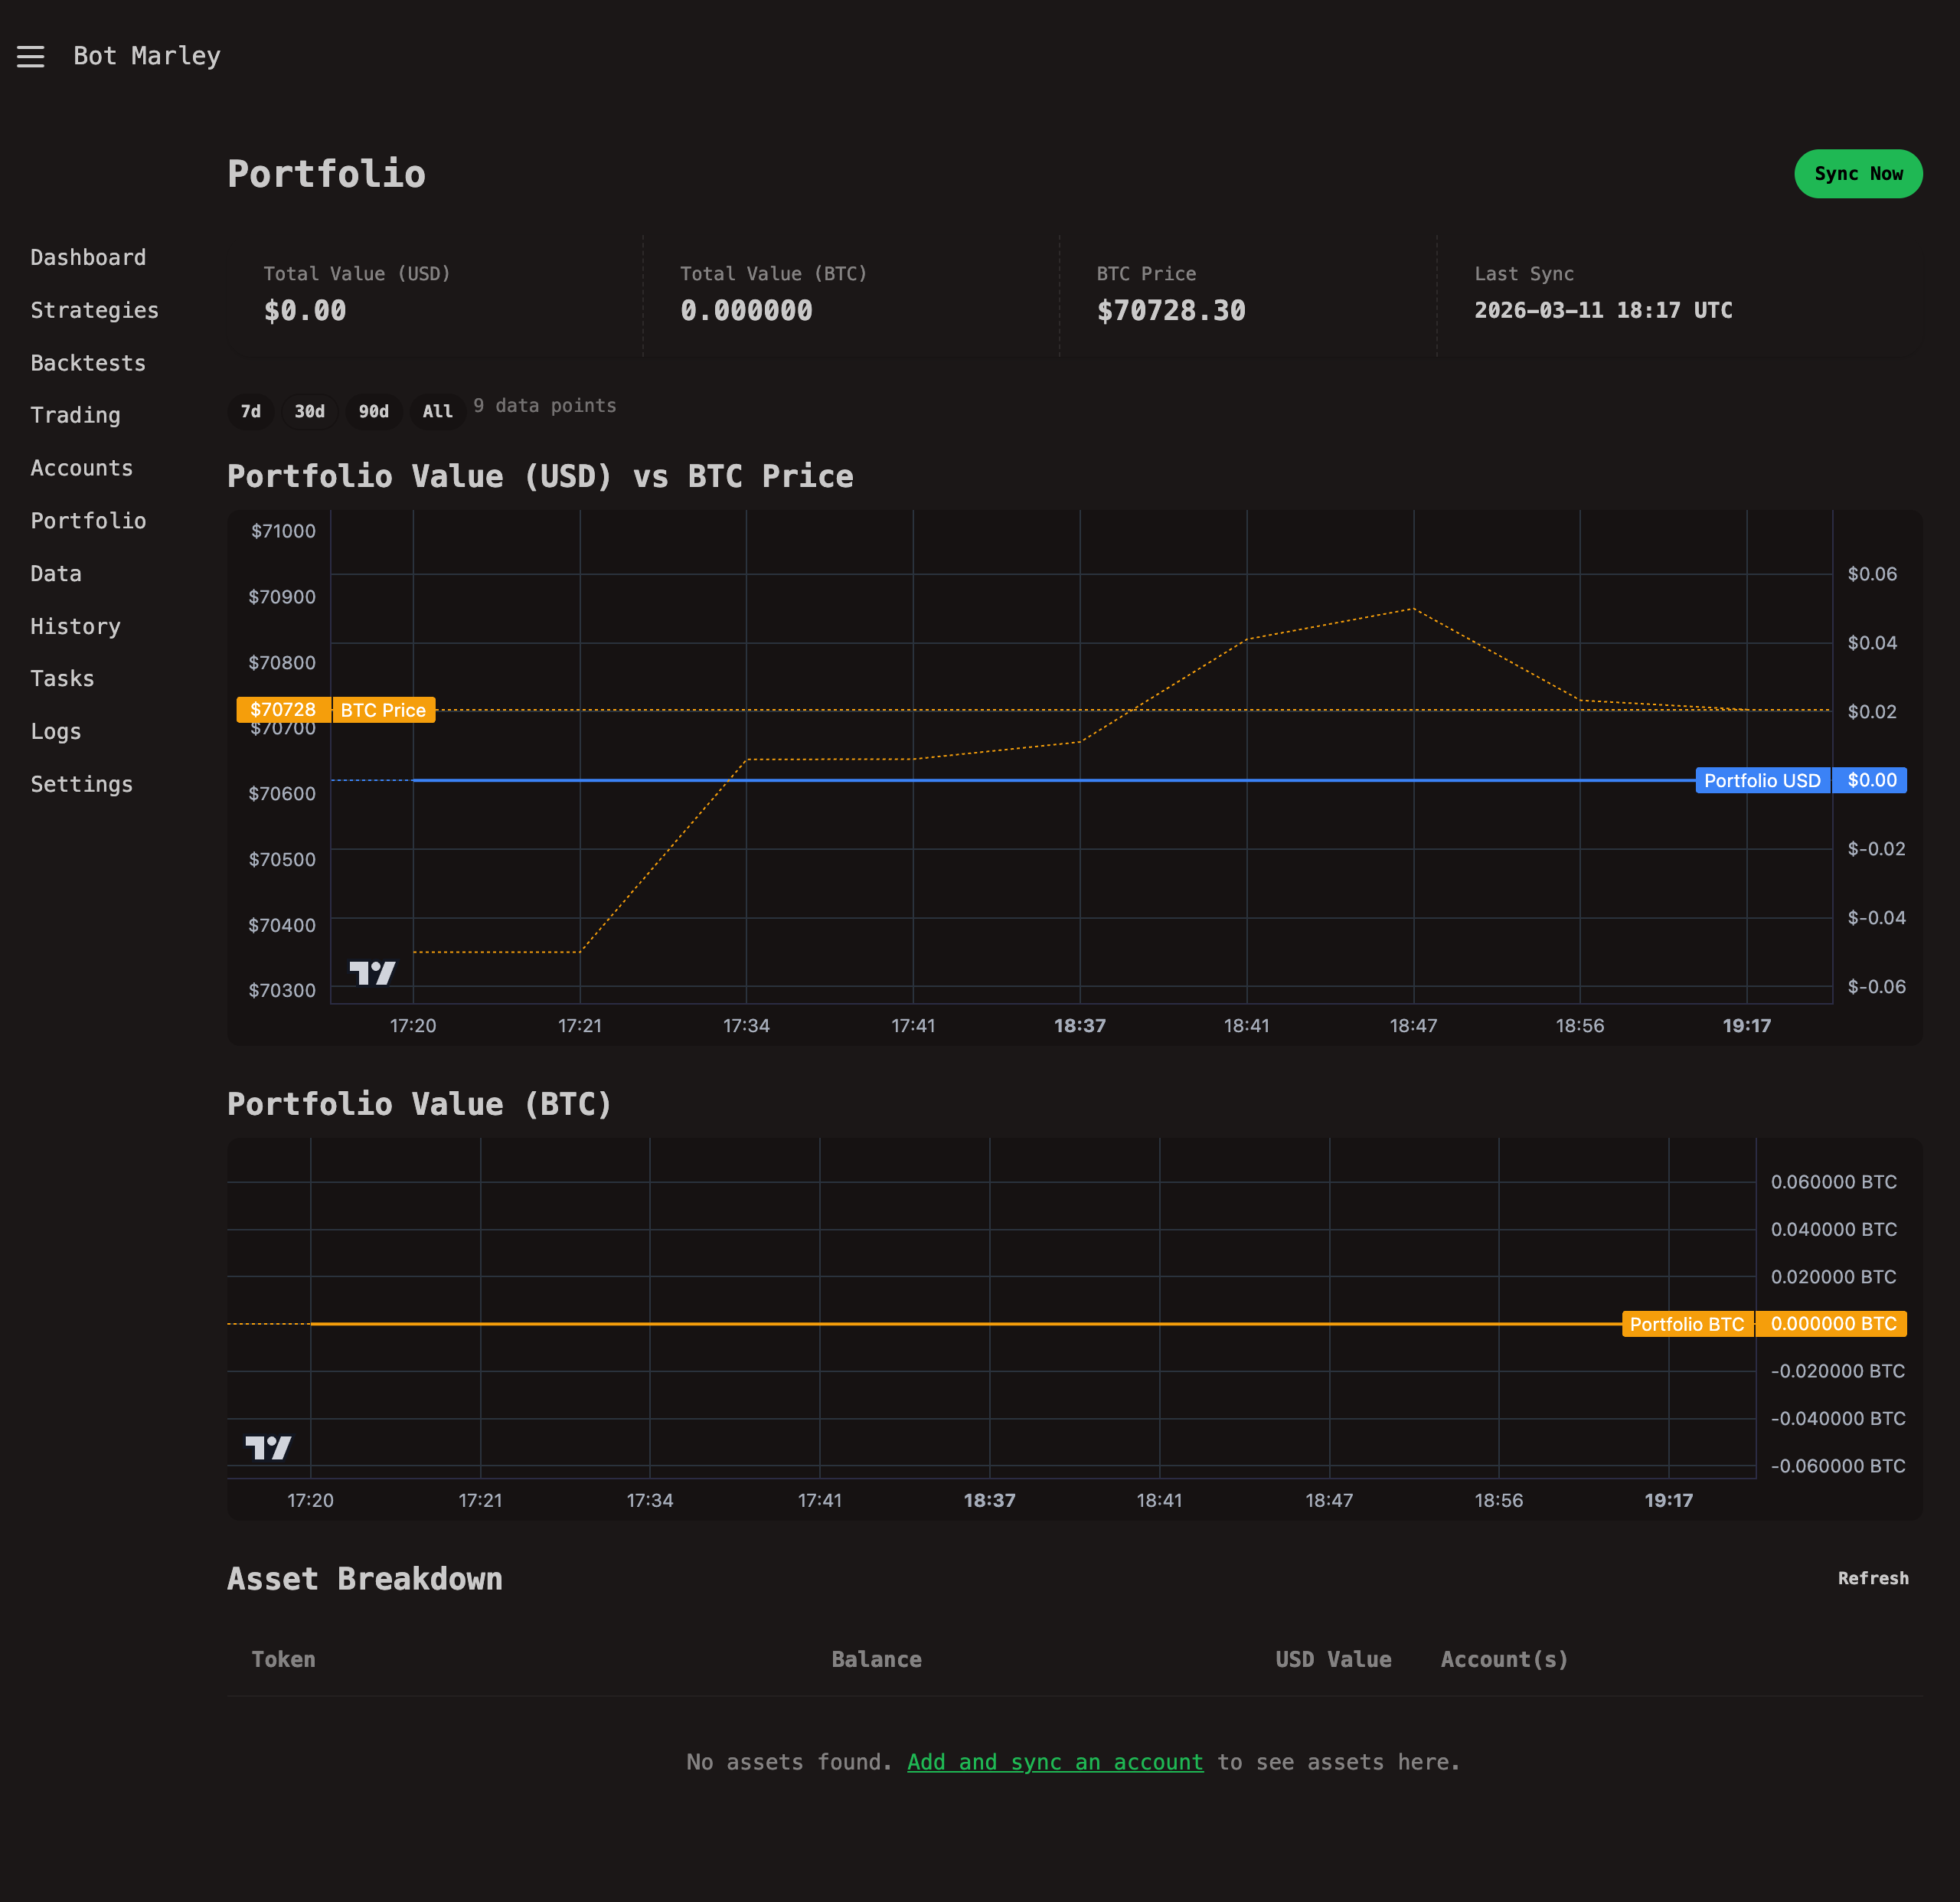
USD Chart: Portfolio Value + BTC Price Overlay
The first chart displays two lines on a dual-axis layout:
- Portfolio USD (blue, right axis) -- your total portfolio value over time in US dollars.
- BTC Price (amber/dashed, left axis) -- the Bitcoin price over the same period.
This overlay lets you visually compare whether your portfolio is outperforming or underperforming a simple Bitcoin hold. The charts are rendered using Lightweight Charts loaded from a CDN.
BTC Chart: Portfolio Value in BTC
The second chart shows a single amber line: your portfolio's value expressed in Bitcoin. If this line trends upward, you are accumulating more BTC-equivalent value over time, even if the USD value moves sideways.
Asset Breakdown Table
Below the charts, a table lists every token you hold across all accounts:
| Column | Description |
|---|---|
| Token | The asset symbol (BTC, ETH, USDC, etc.) |
| Balance | Total holdings of that token across all accounts. |
| USD Value | Balance multiplied by the current USD price. |
| Account(s) | Which accounts hold this token and how much each one holds. |
The table includes a Refresh button that fetches the latest data via HTMX without reloading the page. Assets are sorted by USD value in descending order, so your largest holdings appear first.
Manual Sync
You do not have to wait for the hourly scheduler. To trigger a portfolio sync on demand:
- Go to the Portfolio page (
/portfolio). - Click the Sync Now button in the top-right corner.
- Botmarley enqueues a
PortfolioSynctask and redirects you back to the portfolio page. - The task worker processes the sync (usually completes within a few seconds).
- Refresh the page to see updated values and charts.
After adding a new exchange account and verifying it, click "Sync Now" on the Portfolio page to immediately pull in its balances rather than waiting for the next scheduled sync.
How Prices Are Fetched
Botmarley uses the Kraken public Ticker API to fetch USD prices. This endpoint requires no authentication and has generous rate limits.
The API call
A single request is made to https://api.kraken.com/0/public/Ticker?pair=XXBTZUSD,XETHZUSD,... with all needed trading pairs joined by commas. The response includes the last trade price for each pair, which Botmarley uses as the current price.
Token-to-pair mapping
Botmarley maps normalized token names to Kraken trading pair identifiers:
| Token | Kraken Pair |
|---|---|
| BTC / XBT | XXBTZUSD |
| ETH | XETHZUSD |
| LTC | XLTCZUSD |
| XRP | XXRPZUSD |
| XLM | XXLMZUSD |
| (others) | {TOKEN}USD |
For tokens that Kraken does not list, the price falls back to 0.0 and a warning is logged.
Stablecoin Handling
Stablecoins and fiat currencies are handled without an API call:
| Tokens | Assumed USD price |
|---|---|
| USD, USDC, USDT, BUSD, DAI, TUSD, USDP, GUSD | $1.00 |
| EUR, GBP, CAD, AUD, CHF, JPY | ~$1.00 (rough approximation) |
The fiat approximation (treating EUR, GBP, etc. as $1.00) is a simplification. For portfolios with significant fiat holdings in non-USD currencies, the total USD value will be approximate. A more accurate forex conversion may be added in a future release.
Architecture: Full Sync Flow
The following diagram shows the complete lifecycle of a portfolio sync, from trigger through to the stored snapshot.
sequenceDiagram
    participant S as Scheduler (1h) /<br>Manual Button
    participant Q as Task Queue
    participant W as Task Worker
    participant K as Kraken API
    participant DB as PostgreSQL

    S->>Q: Enqueue PortfolioSync task
    Q->>W: Dequeue task

    Note over W: Step 1: Sync exchange accounts
    W->>DB: List verified exchange accounts
    DB-->>W: [Kraken accounts]
    loop Each verified account
        W->>K: POST /0/private/Balance (signed)
        K-->>W: Token balances
        W->>DB: Upsert account_assets
    end

    Note over W: Step 2: Gather all assets
    W->>DB: SELECT token, balance FROM account_assets
    DB-->>W: All non-zero balances

    Note over W: Step 3: Fetch prices
    W->>K: GET /0/public/Ticker?pair=...
    K-->>W: USD prices per pair

    Note over W: Step 4-5: Compute and store
    W->>W: total_usd = SUM(balance * price)<br>total_btc = total_usd / btc_price
    W->>DB: INSERT INTO portfolio_snapshots
    DB-->>W: Snapshot ID

    W->>Q: Mark task complete