SMA -- Simple Moving Average
Contents
The Simple Moving Average is the most fundamental technical indicator in trading. It calculates the arithmetic mean of the last N closing prices, giving equal weight to every candle in the window. If you set the period to 50, the SMA takes the last 50 closing prices, adds them up, and divides by 50. Each new candle drops the oldest price and adds the newest.
Because every candle carries the same weight, SMA is a smooth, stable line that filters out short-term noise. The trade-off is lag -- SMA reacts slowly to sudden price changes because old prices influence the average just as much as the most recent one.
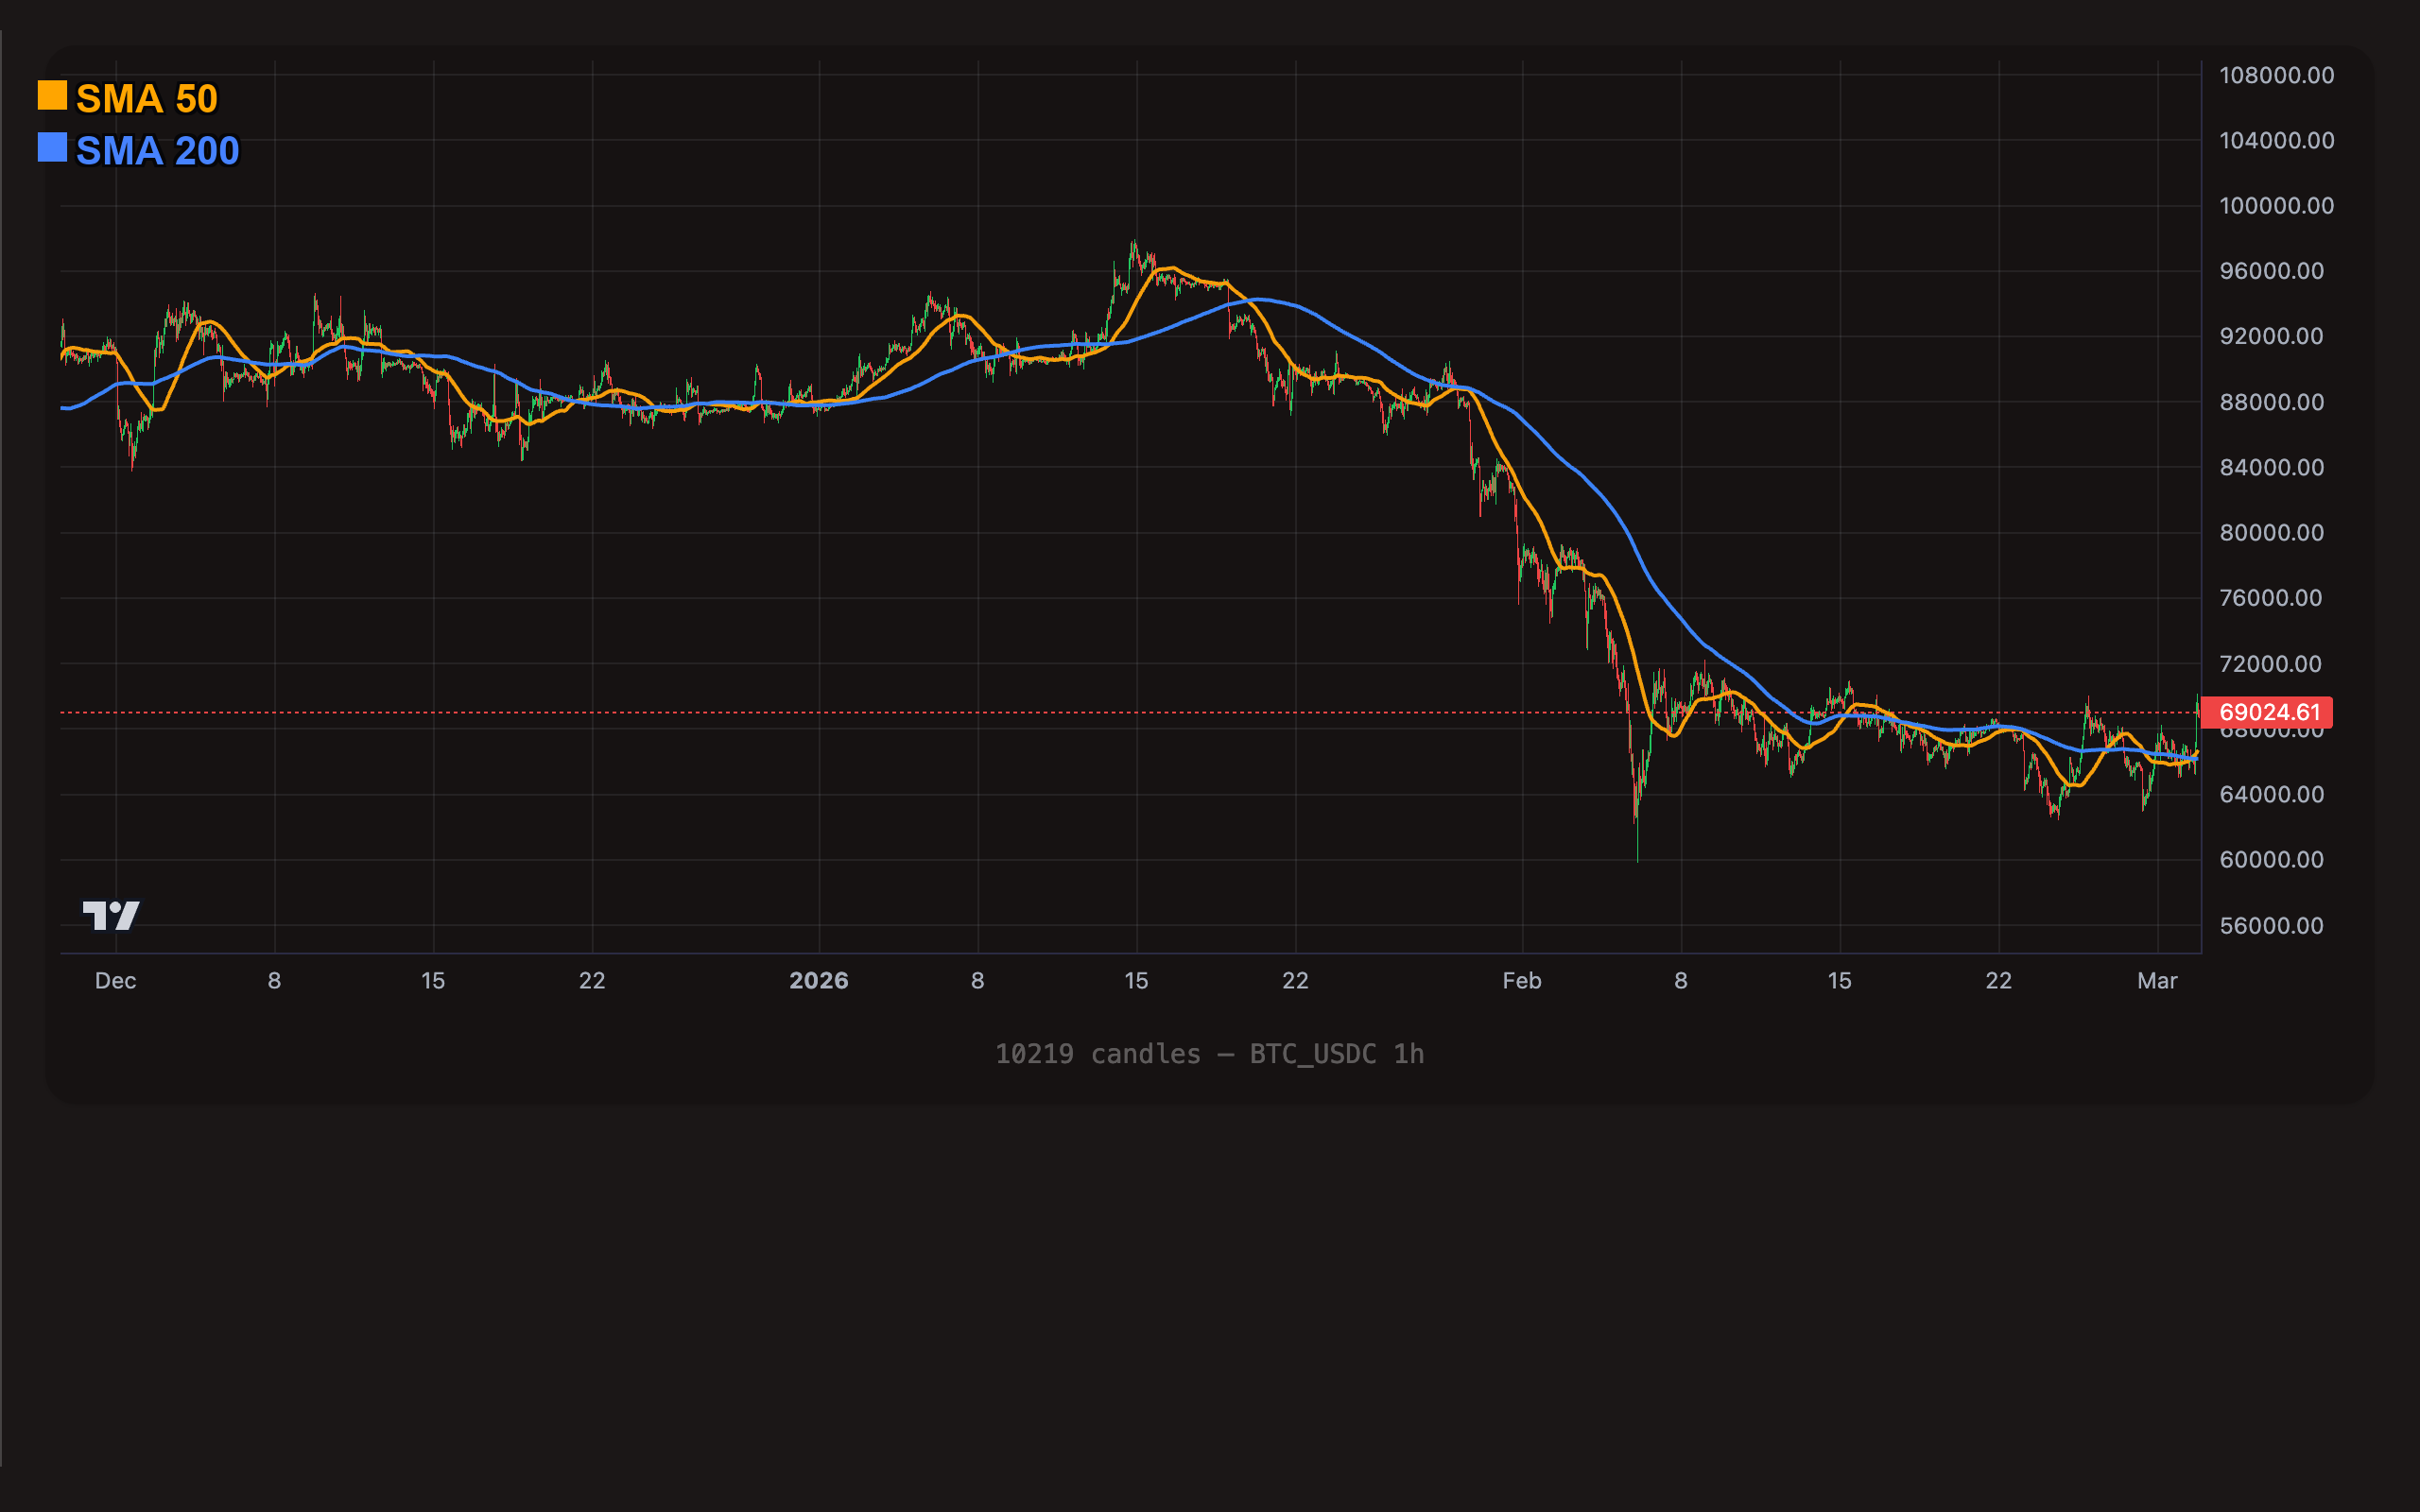
BTC/USDC 1-hour chart with SMA(50) (orange) and SMA(200) (blue). The faster SMA(50) reacts more quickly to price changes while the slower SMA(200) shows the long-term trend.
Format
sma_{period}
The period must be an integer between 1 and 200.
Examples:
| TOML value | Meaning |
|---|---|
sma_20 | 20-period Simple Moving Average |
sma_50 | 50-period Simple Moving Average |
sma_200 | 200-period Simple Moving Average |
Common Periods
| Period | Style | Typical Use |
|---|---|---|
sma_20 | Short-term | Tracks recent momentum. On daily candles this covers roughly one trading month. Good for timing entries in active markets. |
sma_50 | Medium-term | The "workhorse" moving average. Widely watched by traders as a dynamic support/resistance level. A popular component of crossover strategies. |
sma_200 | Long-term | The institutional benchmark. Price above the 200-period SMA is generally considered a bull market; below it, a bear market. Often used as a macro trend filter. |
Understanding Operators with SMA
Every trigger in Botmarley compares an indicator to a target using an operator. Here is what each operator means visually on the chart when used with SMA.
> (Greater Than)
"Price is ABOVE the SMA line on the chart."
As long as the candle closes above the line, this condition is true. Think of it as "price is in bullish territory." This is a state-based operator -- it remains true on every candle where the condition holds, not just the first one.
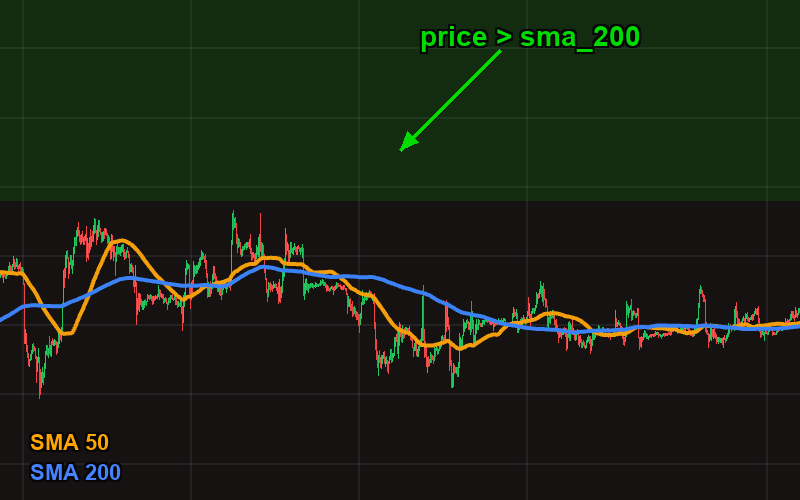
Price candles closing above the SMA(200) line. The green zone represents "bullish territory" — every candle here makes price > sma_200 true.
# True on every candle where price closes above the SMA(200)
[[actions.triggers]]
indicator = "price"
operator = ">"
target = "sma_200"
< (Less Than)
"Price is BELOW the SMA line on the chart."
The mirror image of >. When the candle closes below the SMA line, this condition is true. Think of it as "price is in bearish territory."
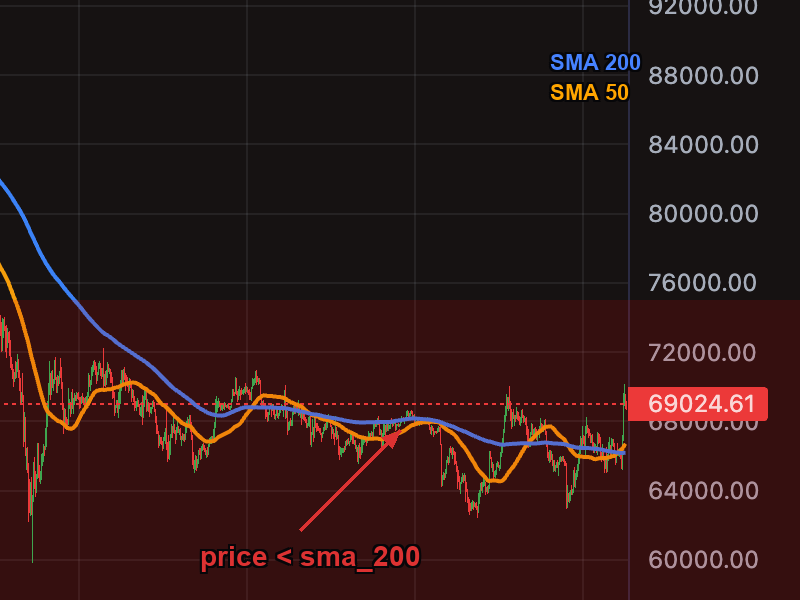
Price candles closing below the SMA(200) line. The red zone represents "bearish territory" — every candle here makes price < sma_200 true.
# True on every candle where price closes below the SMA(20)
[[actions.triggers]]
indicator = "price"
operator = "<"
target = "sma_20"
= (Equal)
Rarely useful with SMA. Since SMA values are floating-point decimals (e.g., 67,432.18), exact equality with another floating-point value almost never happens. This operator exists mainly for discrete indicators like TTM Trend. Use > or < instead when working with SMA.
cross_above
"The MOMENT the indicator line crosses from below to above the target."
On the chart, look for where two lines intersect and the indicator moves from underneath to on top. This fires once at the crossing candle, not continuously. It checks two consecutive candles: the indicator was at or below the target on the previous candle, and is above it on the current candle.
This is the famous Golden Cross when SMA(50) crosses above SMA(200) -- one of the most widely watched signals in both traditional finance and crypto.
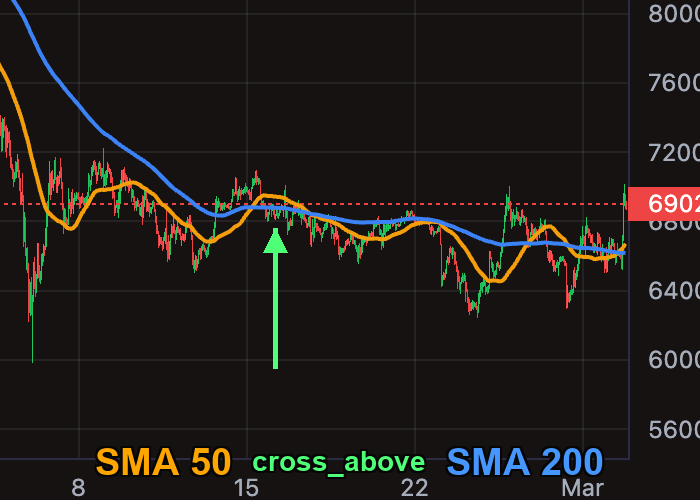
The moment SMA(50) crosses above SMA(200) — the Golden Cross. This event-based signal fires once at the crossing candle.
# Golden Cross: fires once when SMA(50) crosses above SMA(200)
[[actions.triggers]]
indicator = "sma_50"
operator = "cross_above"
target = "sma_200"
timeframe = "1d"
cross_below
"The MOMENT the indicator line crosses from above to below the target."
The opposite crossing -- from above to below. On the chart, the indicator line drops through the target line. Like cross_above, this fires once at the crossing candle.
This is the Death Cross when SMA(50) crosses below SMA(200) -- a widely watched bearish signal.
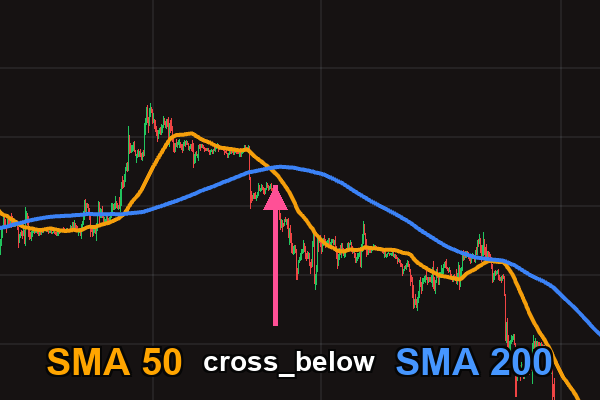
The moment SMA(50) crosses below SMA(200) — the Death Cross. The bearish mirror of the Golden Cross.
# Death Cross: fires once when SMA(50) crosses below SMA(200)
[[actions.triggers]]
indicator = "sma_50"
operator = "cross_below"
target = "sma_200"
timeframe = "1d"
cross_above and cross_below are event-based -- they fire only on the candle where the crossing happens. In contrast, > and < are state-based -- they fire on every candle where the condition holds. Choose the right operator for your strategy logic: use crossovers for entry signals, use comparisons for ongoing filters.
TOML Examples
Golden Cross Entry
Buy when the 50-period SMA crosses above the 200-period SMA on the daily chart. This is a classic long-term trend-following signal.
[[actions]]
type = "open_long"
amount = "200 USDC"

[[actions.triggers]]
indicator = "sma_50"
operator = "cross_above"
target = "sma_200"
timeframe = "1d"
Death Cross Exit
Sell the entire position when SMA(50) crosses below SMA(200). Even if your take-profit has not been reached, a death cross signals the uptrend may be over.
[[actions]]
type = "sell"
amount = "100%"

[[actions.triggers]]
indicator = "sma_50"
operator = "cross_below"
target = "sma_200"
timeframe = "1d"
Price Above SMA(200) as Trend Filter
Use the 200-period SMA as a macro trend gate. Only allow entries while price is above the long-term average. This is a state-based filter that stays active as long as the condition holds. Combined with an RSI dip on a lower timeframe, this creates the classic "trend-safe DCA" pattern.
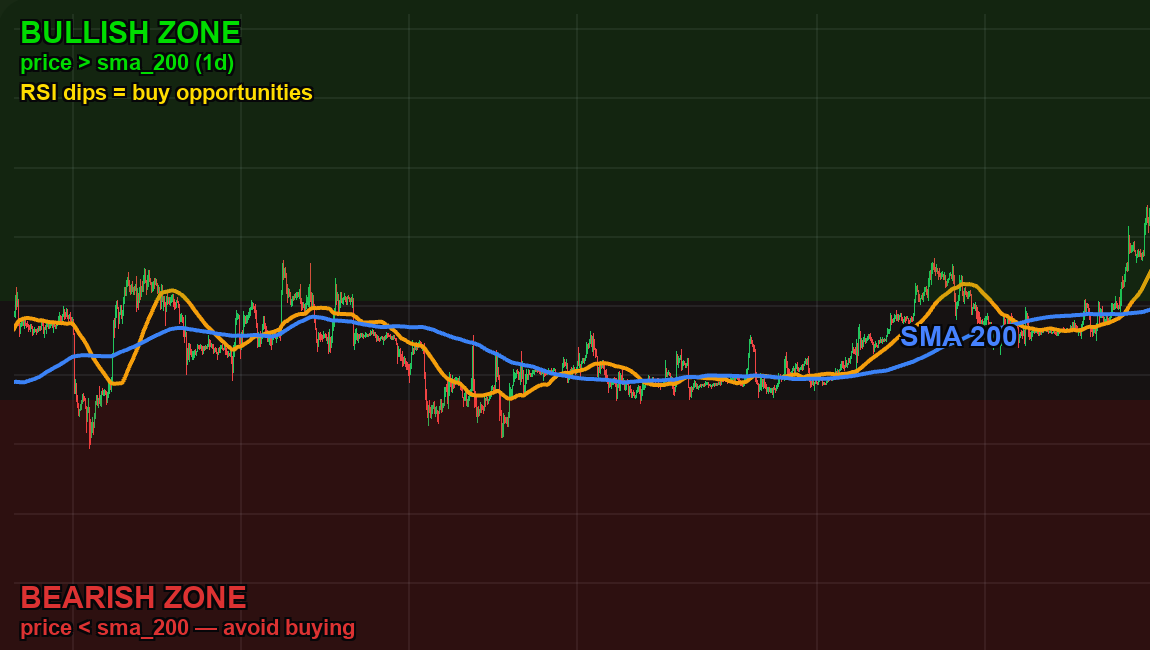
The SMA(200) divides the chart into a bullish zone (above) and a bearish zone (below). Only buy RSI dips when price is in the bullish zone. This multi-indicator, multi-timeframe pattern avoids buying into falling markets.
[[actions]]
type = "open_long"
amount = "100 USDC"

# Macro filter: only buy when price is above the 200 SMA
[[actions.triggers]]
indicator = "price"
operator = ">"
target = "sma_200"
timeframe = "1d"

# Entry signal: RSI dip on lower timeframe
[[actions.triggers]]
indicator = "rsi_14"
operator = "<"
target = "35"
timeframe = "1h"
Price Drops Below Short-Term SMA
Detect when price falls below the 50-period SMA. This can be used as an early warning or exit signal on shorter timeframes.
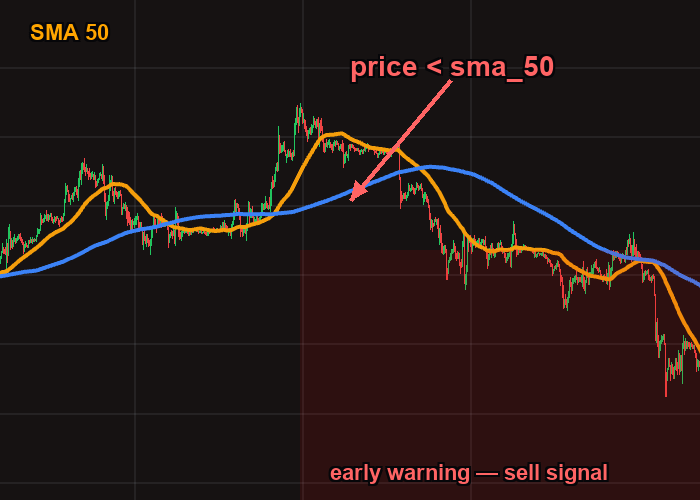
Price falling below the SMA(50) line — an early warning that the short-term trend may be weakening. This sell trigger lets you reduce exposure before a larger drop develops.
[[actions]]
type = "sell"
amount = "50%"

[[actions.triggers]]
indicator = "price"
operator = "<"
target = "sma_20"
timeframe = "4h"
Multi-SMA Trend Confirmation
Combine multiple SMA conditions. This entry requires all three SMAs to be in the correct alignment (fast above medium above slow), confirming a strong uptrend before entering.
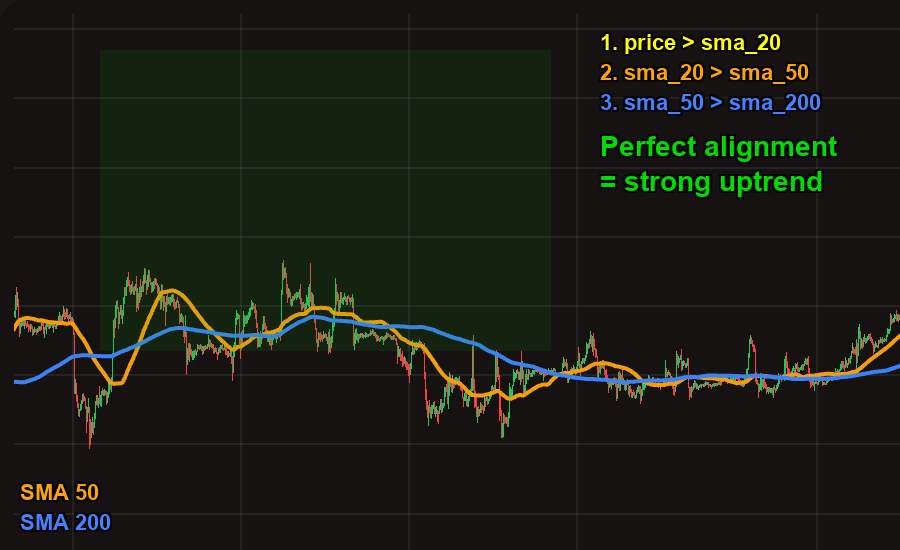
Perfect SMA alignment: price > SMA(20) > SMA(50) > SMA(200). When all three layers stack in the correct order, it confirms a strong uptrend across all timeframes.
[[actions]]
type = "open_long"
amount = "150 USDC"

# SMA(20) above SMA(50) -- short-term trend is bullish
[[actions.triggers]]
indicator = "sma_20"
operator = ">"
target = "sma_50"
timeframe = "1d"

# SMA(50) above SMA(200) -- medium-term trend is bullish
[[actions.triggers]]
indicator = "sma_50"
operator = ">"
target = "sma_200"
timeframe = "1d"

# Price above SMA(20) -- price is in the strongest zone
[[actions.triggers]]
indicator = "price"
operator = ">"
target = "sma_20"
timeframe = "1d"
Tips
SMA(20) reacts more quickly to price changes but generates more false signals. SMA(200) is very smooth and reliable but slow to respond. Match the period to your strategy's timeframe: use shorter periods for scalping on 5m/15m charts, longer periods for swing trading on 4h/1d charts.
While the Golden Cross and Death Cross are famous, relying on a single SMA crossover can produce late entries and many false signals in sideways markets. The real power of SMA is as a trend filter layered with other indicators. For example: "only buy RSI dips when price is above SMA(200)."
If you want to enter on a crossover event (one-time signal), use cross_above or cross_below. If you want to gate entries behind a trend condition that stays active as long as it holds, use > or <. Mixing them up is a common mistake -- a > trigger fires on every candle, which can cause repeated entries if you do not use max_count.
SMA gives equal weight to all candles in the window, making it smoother but slower to react. If you need faster response to price changes with less lag, consider using EMA instead. Many strategies combine both: SMA for the macro trend view and EMA for entry timing.